Comparing Server Availability Monitoring Tools - MN506 Report
VerifiedAdded on 2023/01/19
|10
|2110
|80
Report
AI Summary
This report provides an overview of server availability monitoring tools, comparing various open-source options based on their metrics and functionalities. The report begins with an introduction to the importance of such tools in identifying and resolving server-related issues before they impact websi...

rams rama
SYSTEM MANAGEMENT
SYSTEM MANAGEMENT
Paraphrase This Document
Need a fresh take? Get an instant paraphrase of this document with our AI Paraphraser

Table of Contents
Introduction.............................................................................................................................................2
Server availability monitoring tools.........................................................................................................2
Server availability monitoring architecture.............................................................................................5
Identification and analysis of server availability monitoring architecture...............................................6
Solution to avoid data vulnerabilities in server availability monitoring tool............................................7
Conclusion...............................................................................................................................................7
Introduction
The report below gives an oversight of the importance of the server availability monitoring tools. It
compares a number of well know server availability monitoring tools with reference to their metrics.
The importance of such a tool is to identify and resolve server related problem before they have caused
negative impacts on a website.
Server availability monitoring tools
Nagios Core
In order for you to monitor the attributes or services that are present in a machine, you need to install
an agent on it. It will act as a proxy that conducts the monitoring between the Nagios core. A machine
that does not have the agent installed into it will not be able to be monitored by the Nagios Core [1].
The Nagios Core Technical features include:
Network monitoring- TCP/IP, POP3, IMAP, FTP, SSH, SMTP, DNS, Bandwidth
Reporting- SLA availability report, Alert and notification history, RRD-based add-ons
Reporting channels- email, SMS, Jabber, custom script, RSS
Operating system monitoring- Linux, Windows, Unix
Hardware- switches, firewall, printer, UPSes, workstations, routers
Application monitoring-SAP, Exchange, JBOSS, Apache/IIS
Customizable code- open source software, full access to source code, released under the GPL
license
The system requirement for this software includes:
Server operating system should be either: Linux, RHEL, Ubuntu, Fedora, CentOS, Debian, SLES,
Unix
Server hardware- 1GHz CPU, 512 MB RAM (minimum) or 2GHz, 1 GB RAM (recommended)
Server storage- a minimum of 512 MB free space and a maximum of 2 GB free space
Browsers - Firefox 2.0+
Internet Explorer 5.5+
Safari 2.0+
⊘ This is a preview!⊘
Do you want full access?
Subscribe today to unlock all pages.

Trusted by 1+ million students worldwide
The client operating system can be a Windows (Windows 2000, Vista, X, 2003, 2007) or a Linux/Unix
(FreeBSD 6.4+, Solaris 9+, AIX 5.2/5.3, kernel Linux distribution)
Ganglia
Ganglia are powerful monitoring tools as it is operational from any monitoring system. It can run on any
of the top popular Operating Systems and can scale without difficulty to a vast network. Its design
makes it resilient to node failures. This tool can be used to offer real-time monitoring and their
performance matrix is above other older monitoring software tools. Ganglia consume a lot of RAM; it
may use over 2 GB RAM and this will cause a system failure. The disk usage for this software is higher
than other software since it has to duplicates the majority of the RRD files [2]. The Software is bound to
a sidle thread in the CPU, making it faster and thus utilizing a larger CPU core.
CollectD
This is a software daemon that is used to collect application and also system performance metrics over a
period of time and conveniently stores the information in various ways i.e. in RRD files. The metric can
be from various sources ranging from system applications, operating system, external devices and also
log-files, this information can be store and through the internet made available.
In comparison with other monitory tools, it is written in C language making it more portable and of high
performance.
Spiceworks
This is a free open source monitoring software that offers quality infrastructure for monitoring network.
Previously, it was known for working with only Windows but over the years it now operates on Linux
(Fedora, RedHat, Arch, and SuSE) and also Ubuntu. Devices that can support Simple Network
Management Protocols (SNMP versions 1 and 2) can work together with Spiceworks. Router and
switches and switches are among the infrastructure devices that can be monitored. For Window 7 and
10, it can monitor disk utilization, Network rate, memory utilization and also CPU utilization [2].
Despite the powerful functionalities of Spiceworks, it is unable to monitor other devices such as mobile
devices. In network monitoring, some features such as SNMP version 3 are missing in Spiceworks.
Paraphrase This Document
Need a fresh take? Get an instant paraphrase of this document with our AI Paraphraser
Cacti
It is a front-end developed open source software that is used to monitor web-based network
monitoring, data-logging and as a graphical tool. With Cacti, a user can monitor the services at specific
intervals and represent the reading in a graph. The data retrieved from the graphs include network
bandwidth and CPU utilization. When monitoring a switch or a router, it graphs network traffic via the
Simple Network Management Protocol (SNMP).
Zabbix
It is an open source monitoring software suited for an enterprise that aid in the monitoring of numerous
metric that is collected from devices such as servers, routers, switches, and virtual machines. With it,
users can collect and represent the data and get prompt alerts on problems that are impending. The
scale of Zabbix is small, comprising of a small business setting that does not have a lot of servers to be
monitored.
Icinga
This is an open source server availability monitoring tools that as developed to solve the problem
encountered with the Nagios Monitoring system in the year 2009. Apart from solving the Nagios
system's shortcoming, it also had additional features that ranged from a new Web UI, REST API and
additional databases connectors. It delivers an enterprise-grade service that monitors the network and
generates performance information. It also registers issues and raises respective alerts. Its core feature
is: dashboards, alerting, REST APIs, authentications, security and monitoring performance.
OpenNMS
OpenNMS (Open Network Management System) is an open source model written in Java that can be
able to track and monitor a vast number of devices through one server. With the use of centralized
server (Cluster Server) it can manage a number of devices. OpenNMS can manage the network devices
and also configure them with the use of an incorporated Discovery Engine [3]. OpenNMS is very popular
for managing a larger scale; this does not limit it to managing smaller scales of devices.
The functionality scope of the OpenNMS is:
Network-based service monitoring
With the use of JMX and SNMP in data collection
Raising notifications which are event-driven
WhatsUp Gold
This is a unified server availability monitoring tool for both large scale and small scale service providers.
It is strictly constricted to Windows User. Its core functionality is to efficiently identify and effectively
scrutinize performance issues before they escalate [4]. It monitors disk usage, CPU utilization, and
bandwidth and represents the data to the user.
Server availability monitoring architecture
There are various tools that can be found in a typical availability monitoring tool. The tools are divided
into two; some may contain multiple tools that have undergone full integration while others may need
the user to install other tools for it to be operational. In some instances, some tolls may contain several
components that need managed and installed separately. Some of the components involved include:
Pooling engines
System database
User console
Analytic server among others
The architecture of these tools determines the operation and performance of this server availability
monitoring tools [5]. Some server monitoring tools can monitor several servers while others are strictly
restricted to monitoring a single server.
⊘ This is a preview!⊘
Do you want full access?
Subscribe today to unlock all pages.

Trusted by 1+ million students worldwide
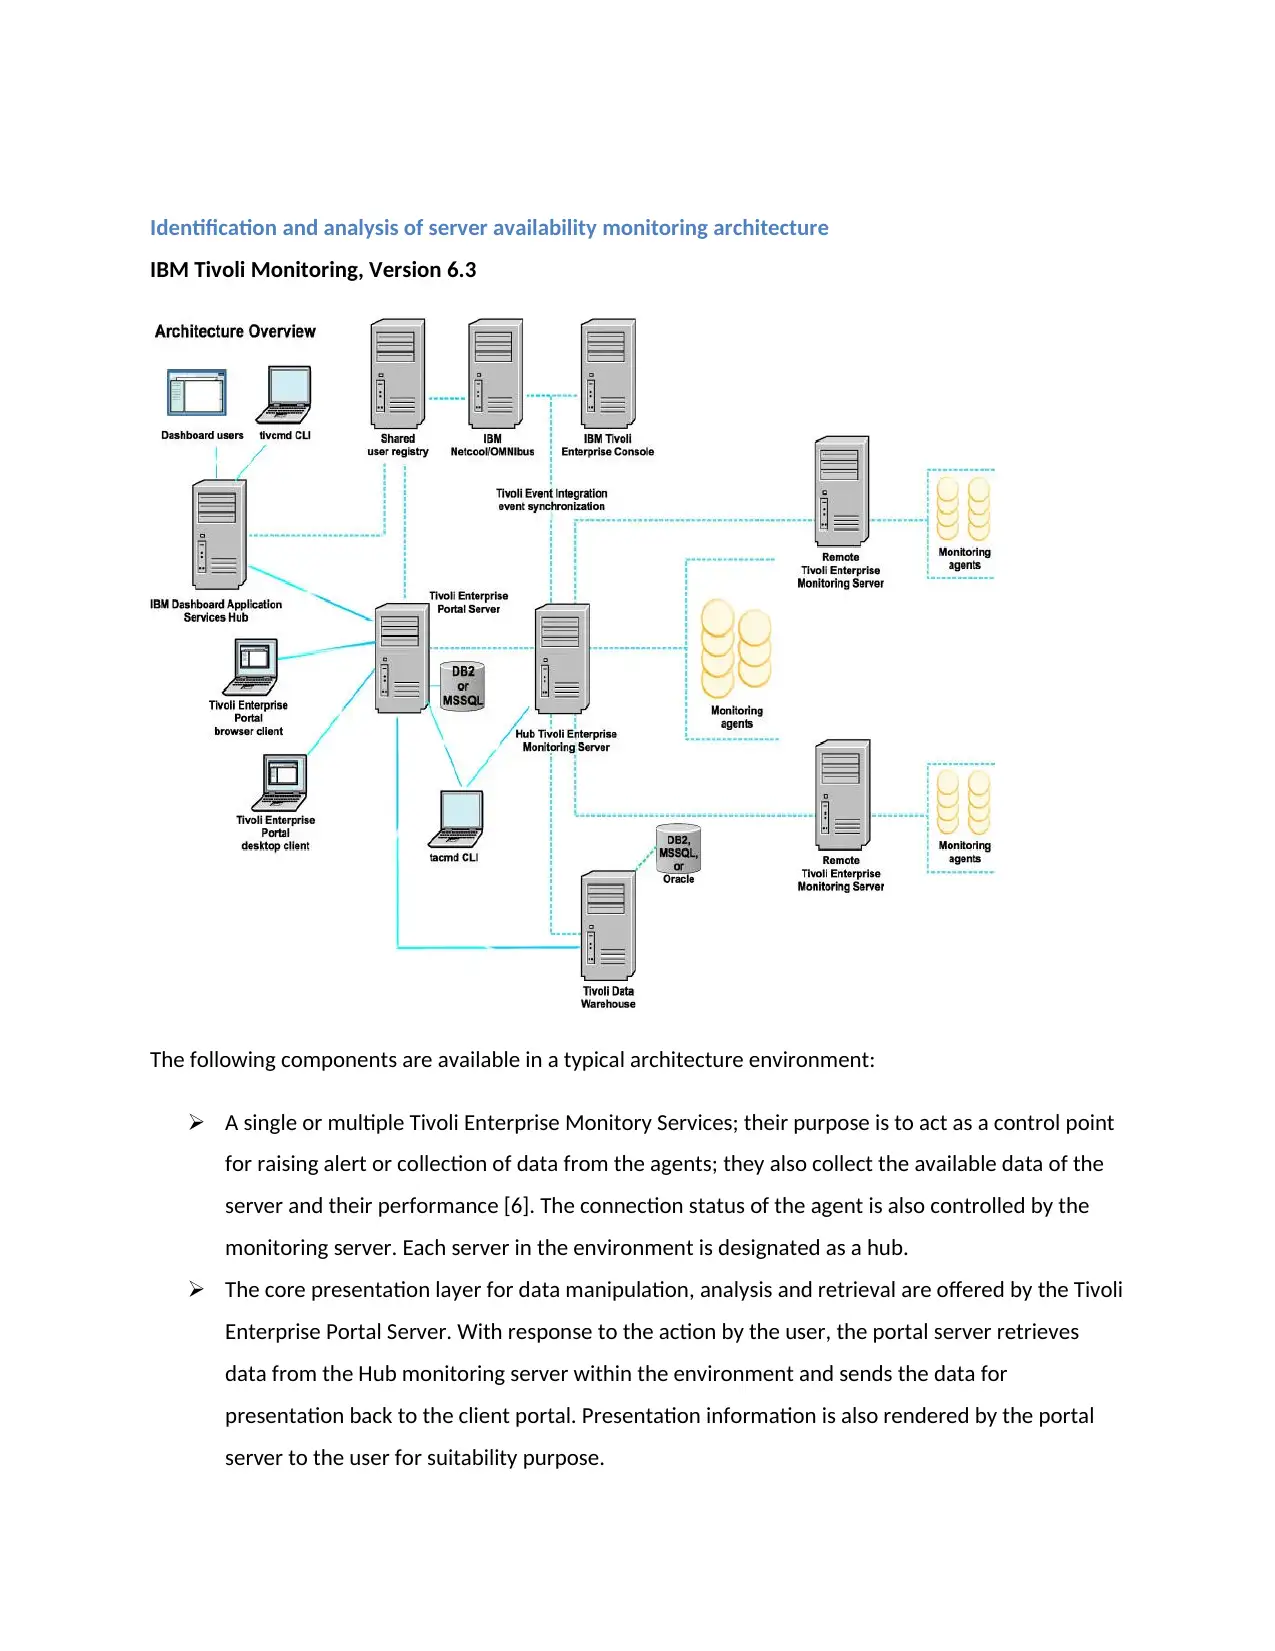
Identification and analysis of server availability monitoring architecture
IBM Tivoli Monitoring, Version 6.3
The following components are available in a typical architecture environment:
A single or multiple Tivoli Enterprise Monitory Services; their purpose is to act as a control point
for raising alert or collection of data from the agents; they also collect the available data of the
server and their performance [6]. The connection status of the agent is also controlled by the
monitoring server. Each server in the environment is designated as a hub.
The core presentation layer for data manipulation, analysis and retrieval are offered by the Tivoli
Enterprise Portal Server. With response to the action by the user, the portal server retrieves
data from the Hub monitoring server within the environment and sends the data for
presentation back to the client portal. Presentation information is also rendered by the portal
server to the user for suitability purpose.
Paraphrase This Document
Need a fresh take? Get an instant paraphrase of this document with our AI Paraphraser
Multiple or single Tivoli Enterprise Portal clients that offer monitory and view of the interface by
using a Java-based UI.
Installed in the system are Tivoli Enterprise Portal clients that gather information from the
monitored system and disseminate this information to the SNMP or the monitoring servers.
A Command Line Interface that is used to manage the monitored environment, it can also be
used to automate some functionalities on the Tivoli Enterprise Portal. The request from the CLI
can be sent to the Tivoli Enterprise Portal server or the Hub.
One Eclipse Help Server that is used to render assistance for the portal and other devices that
have the support installed. At the Tivoli Enterprise Portal server is where the Help Server is
installed.
Solution to avoid data vulnerabilities in server availability monitoring tool
The most effective way to prevent this kind of attacks is to occasionally update our software and also
hardware equipment. Majority of the software and hardware developer have adopted the Security
Development Life Cycle [7]. This has proven to be effective as it has been able to respond to the very
adaptive data vulnerabilities. Thus making it the most effective and secure
Conclusion
The current industry has several tools that can be used to monitor server availability. Based on the
requirement of the user, the user can narrow down to possible server availability monitory tools they
can use. For one to be able to determine the best server availability tool, they have to consider the key
factors of scale, CPU monitoring, and bandwidth monitoring.
Apart from determining the suitable tool, the user must ensure the security of these tools since they can
have data vulnerabilities. There are various measure can be placed to ensure security the most effective
one being frequently updating the software.
References
[1] Dreibholz, T. and Gran, E.G. Design and implementation of the NorNet core research testbed for
multi-homed systems. In 2013 27th International Conference on Advanced Information Networking and
Applications Workshops (pp. 1094-1100). IEEE, March, 2013.
[2] J. Hernantes, G. Gallardo and N. Serrano, "IT Infrastructure-Monitoring Tools" in IEEE Software, vol.
32, no. 04, pp. 88-93, 2015.doi: 10.1109/MS.2015.96.
[3] Kaushik, A. Use of open source technologies for enterprise server monitoring using
SNMP. International Journal on Computer Science and Engineering, 2(07), pp.2246-2252, 2010.
[4] Andreolini, M., Colajanni, M. and Pietri, M. A scalable architecture for real-time monitoring of large
information systems. In 2012 Second Symposium on Network Cloud Computing and Applications (pp.
143-150). IEEE,December, 2012.
[5] Dickerson, S.S. and Klazynski, J.N., International Business Machines Corp. Detecting changes in end-
user transaction performance and availability caused by changes in transaction server configuration. U.S.
Patent 9,122,715, 2015.
[6] Nasuto, A., Cassone, G. and Gotta, D., Telecom Italia SpA. Method and system for monitoring
performance of a client-server architecture. U.S. Patent 7,933,988, 2011.
[7] Krutz, R.L. and Vines, R.D. Cloud security: A comprehensive guide to secure cloud computing. Wiley
Publishing, 2010.
⊘ This is a preview!⊘
Do you want full access?
Subscribe today to unlock all pages.

Trusted by 1+ million students worldwide

1 out of 10
Related Documents
Your All-in-One AI-Powered Toolkit for Academic Success.
+13062052269
info@desklib.com
Available 24*7 on WhatsApp / Email
![[object Object]](/_next/static/media/star-bottom.7253800d.svg)
Unlock your academic potential
© 2024 | Zucol Services PVT LTD | All rights reserved.


