University Healthcare System Simulation and Solution Report MN5617
VerifiedAdded on 2022/08/28
|17
|4538
|18
Report
AI Summary
This report details a system simulation and solution for a healthcare clinic using Arena simulation software. The clinic, operating in a war-torn environment, handles two patient types: low-priority (Type 1) and high-priority (Type 2). The simulation models patient arrival rates, registration, triage, treatment by clinical nurses or general practitioners, and resource utilization, including beds, ambulances, and operating rooms. The report analyzes patient wait times, resource bottlenecks, and the impact of different operational parameters. The study includes multiple replications, providing statistical insights into system performance and potential areas for improvement. The simulation considers patient flow, treatment processes, and resource constraints, such as bed availability and ambulance availability, to evaluate the clinic's efficiency and identify areas for optimization. The analysis covers various aspects of patient care, including the impact of triage processes, treatment times, and resource allocation on patient outcomes.
Running head: SYSTEM SIMULATION AND SOLUTION
SYSTEM SIMULATION AND SOLUTION
Name of the Student
Name of the University
Author Note
SYSTEM SIMULATION AND SOLUTION
Name of the Student
Name of the University
Author Note
Paraphrase This Document
Need a fresh take? Get an instant paraphrase of this document with our AI Paraphraser
1SYSTEM SIMULATION AND SOLUTION
Table of Contents
Part 1......................................................................................................................................7
Solution 1:..........................................................................................................................7
Solution 2:..........................................................................................................................8
Solution 3:..........................................................................................................................8
Solution 4:..........................................................................................................................8
Solution 5:..........................................................................................................................9
Solution 6:..........................................................................................................................9
Solution 7:..........................................................................................................................9
Solution 8:..........................................................................................................................9
Solution 9:........................................................................................................................10
Solution 10:......................................................................................................................10
Part 2....................................................................................................................................10
Solution 11:......................................................................................................................10
Solution 12:......................................................................................................................10
Solution 13:......................................................................................................................10
Solution 14:......................................................................................................................11
Part 3....................................................................................................................................11
Bibliography.............................................................................................................................13

2SYSTEM SIMULATION AND SOLUTION
⊘ This is a preview!⊘
Do you want full access?
Subscribe today to unlock all pages.
Trusted by 1+ million students worldwide
3SYSTEM SIMULATION AND SOLUTION
Arena is widely used around the world for tits well-known business process and
discrete event simulation. It is a powerful, easy to use tool, which allows a person to create
and run experimental simulations on various models of any particular system. Arena can be
said as a computer based simulation software in which various suggestive simulating ideas
can be tested and its implemented future can be predicted without affecting the current
business environment (Hashemi and Sattarvand 2015). Some business decisions are straight
forward however, a minor change in one area of the business may impact vastly in other areas
that in most of the cases are not anticipated. On the other hand, discrete event simulation
describes a specific process with a set of specific and unique events in a certain period. These
activity based flexible models can be used effectively for simulating any type of process
(Jilcha, Berhan and Sherif 2015).
A business model differs from manufacturing companies to health care to customer
service. It can gain advantage from simulating their upcoming planning environment
and varies from any emergency clinic layout to any current supply chain arrangement
everything can be structured and simulated to predict various possible outcomes (Wang and
Hung 2016). In order to obtain the same, following steps can be followed in Arena
Simulation.
- Basic model creation – The Arena Simulation software provides an in-built flowchart
like setting for building a current model of a process. In order to do the same, one
simply needs to drag and drop the flowchart shaped modules from the side pane into
the working-model layout window and connect them with in the end to indicate a flow
process (Alhaag, Aziz and Alharkan 2015).
- Refining of the model – In this stage, real time data (like staff level, process time or
any type of resource requirement) are added with the designed model. It is done by
double clicking the modules and filling the information in the popup forms that
Paraphrase This Document
Need a fresh take? Get an instant paraphrase of this document with our AI Paraphraser
4SYSTEM SIMULATION AND SOLUTION
appears on the screen for data insertion. In order to get a more realistic view, the
arena’s auto generated icons can be replaced with any specific clipart based graphic
designs (apart from clipart, the icons can also be drawn and provided using any type
of graphic designing tools) (Geramianfar, Pakzad and Tavakkoli-Moghaddam 2015).
- Simulation of the model – The designed model is now run to verify and simulate the
actual model. It replicates the actual system in every respect. Here, any type of
bottleneck in the simulated system is done next. Determination of any communication
gaps between the system is also done in this step. It is mainly done with the help of
dynamic animation that is found during the simulation (Ghaleb, Suryahatmaja and
Alharkan 2015).
- Analysis of the simulation result – On completion of the designed model simulation,
Arena automatically generates and then provides the auto generated report based on
various common decision making criteria like waiting time of various entities and
utilization of multiple resources within the system. An augmented in-built statistics is
also supplied which is vital for assessment needs (Aliyu, Sulaiman and Yusuf 2015).
- Selection of the best alternative – In the end, changes can be made to the model in
order to take into view, various possible circumstances that one might want to explore
and then the two results (precious compilation and the modified model compilation)
are compared to find the most prominent and suitable solution (Hailu, Jilcha and
Birhan 2015).
There are mainly two types of modules that can be found in Arena Simulation Software.
They are flowchart modules and data modules.
Shapes of flowchart modules are placed in the model window and after placement of all the
modules; they are connected in order to form a desired flowchart of any particular logical
process (Ra and Choi 2015). Data module on the other hand is not positioned in the model
5SYSTEM SIMULATION AND SOLUTION
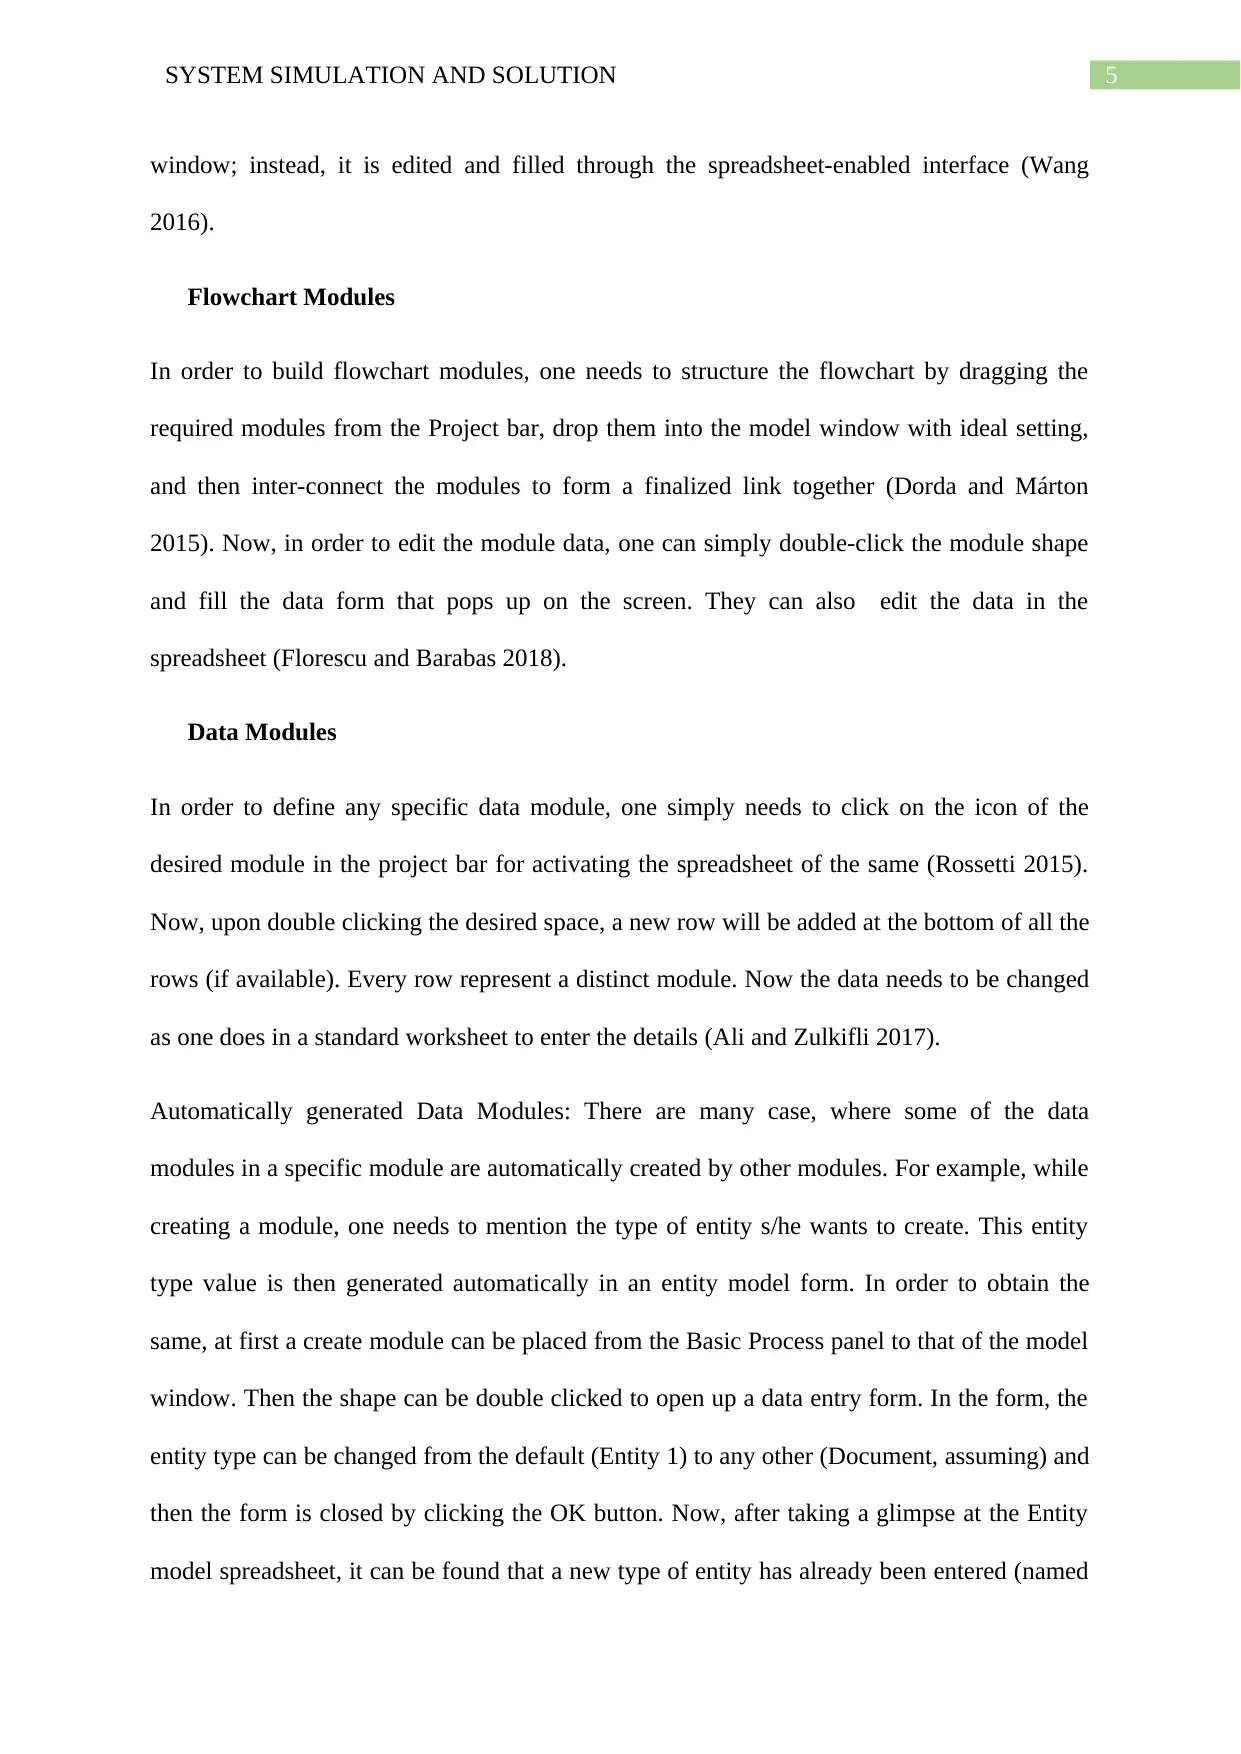
window; instead, it is edited and filled through the spreadsheet-enabled interface (Wang
2016).
Flowchart Modules
In order to build flowchart modules, one needs to structure the flowchart by dragging the
required modules from the Project bar, drop them into the model window with ideal setting,
and then inter-connect the modules to form a finalized link together (Dorda and Márton
2015). Now, in order to edit the module data, one can simply double-click the module shape
and fill the data form that pops up on the screen. They can also edit the data in the
spreadsheet (Florescu and Barabas 2018).
Data Modules
In order to define any specific data module, one simply needs to click on the icon of the
desired module in the project bar for activating the spreadsheet of the same (Rossetti 2015).
Now, upon double clicking the desired space, a new row will be added at the bottom of all the
rows (if available). Every row represent a distinct module. Now the data needs to be changed
as one does in a standard worksheet to enter the details (Ali and Zulkifli 2017).
Automatically generated Data Modules: There are many case, where some of the data
modules in a specific module are automatically created by other modules. For example, while
creating a module, one needs to mention the type of entity s/he wants to create. This entity
type value is then generated automatically in an entity model form. In order to obtain the
same, at first a create module can be placed from the Basic Process panel to that of the model
window. Then the shape can be double clicked to open up a data entry form. In the form, the
entity type can be changed from the default (Entity 1) to any other (Document, assuming) and
then the form is closed by clicking the OK button. Now, after taking a glimpse at the Entity
model spreadsheet, it can be found that a new type of entity has already been entered (named
⊘ This is a preview!⊘
Do you want full access?
Subscribe today to unlock all pages.
Trusted by 1+ million students worldwide
6SYSTEM SIMULATION AND SOLUTION
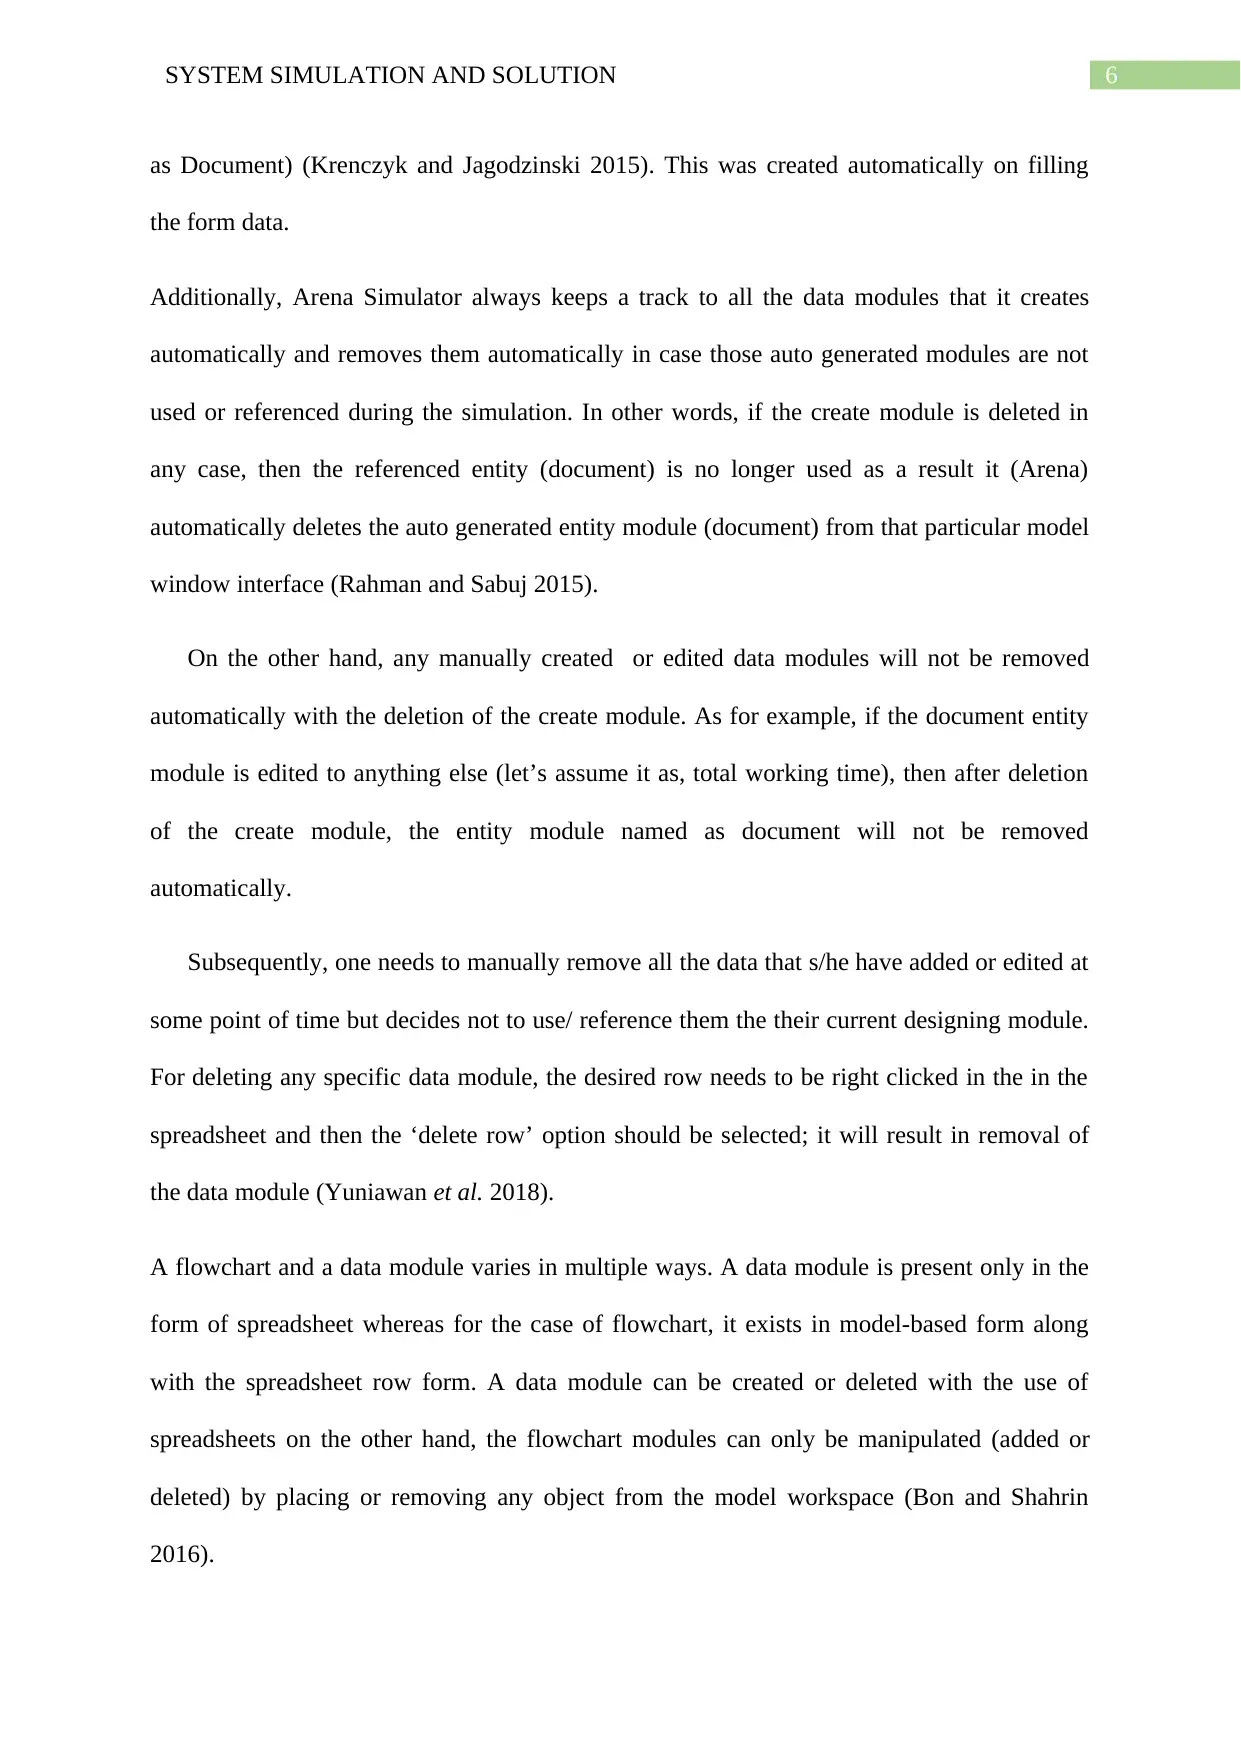
as Document) (Krenczyk and Jagodzinski 2015). This was created automatically on filling
the form data.
Additionally, Arena Simulator always keeps a track to all the data modules that it creates
automatically and removes them automatically in case those auto generated modules are not
used or referenced during the simulation. In other words, if the create module is deleted in
any case, then the referenced entity (document) is no longer used as a result it (Arena)
automatically deletes the auto generated entity module (document) from that particular model
window interface (Rahman and Sabuj 2015).
On the other hand, any manually created or edited data modules will not be removed
automatically with the deletion of the create module. As for example, if the document entity
module is edited to anything else (let’s assume it as, total working time), then after deletion
of the create module, the entity module named as document will not be removed
automatically.
Subsequently, one needs to manually remove all the data that s/he have added or edited at
some point of time but decides not to use/ reference them the their current designing module.
For deleting any specific data module, the desired row needs to be right clicked in the in the
spreadsheet and then the ‘delete row’ option should be selected; it will result in removal of
the data module (Yuniawan et al. 2018).
A flowchart and a data module varies in multiple ways. A data module is present only in the
form of spreadsheet whereas for the case of flowchart, it exists in model-based form along
with the spreadsheet row form. A data module can be created or deleted with the use of
spreadsheets on the other hand, the flowchart modules can only be manipulated (added or
deleted) by placing or removing any object from the model workspace (Bon and Shahrin
2016).
Paraphrase This Document
Need a fresh take? Get an instant paraphrase of this document with our AI Paraphraser
7SYSTEM SIMULATION AND SOLUTION
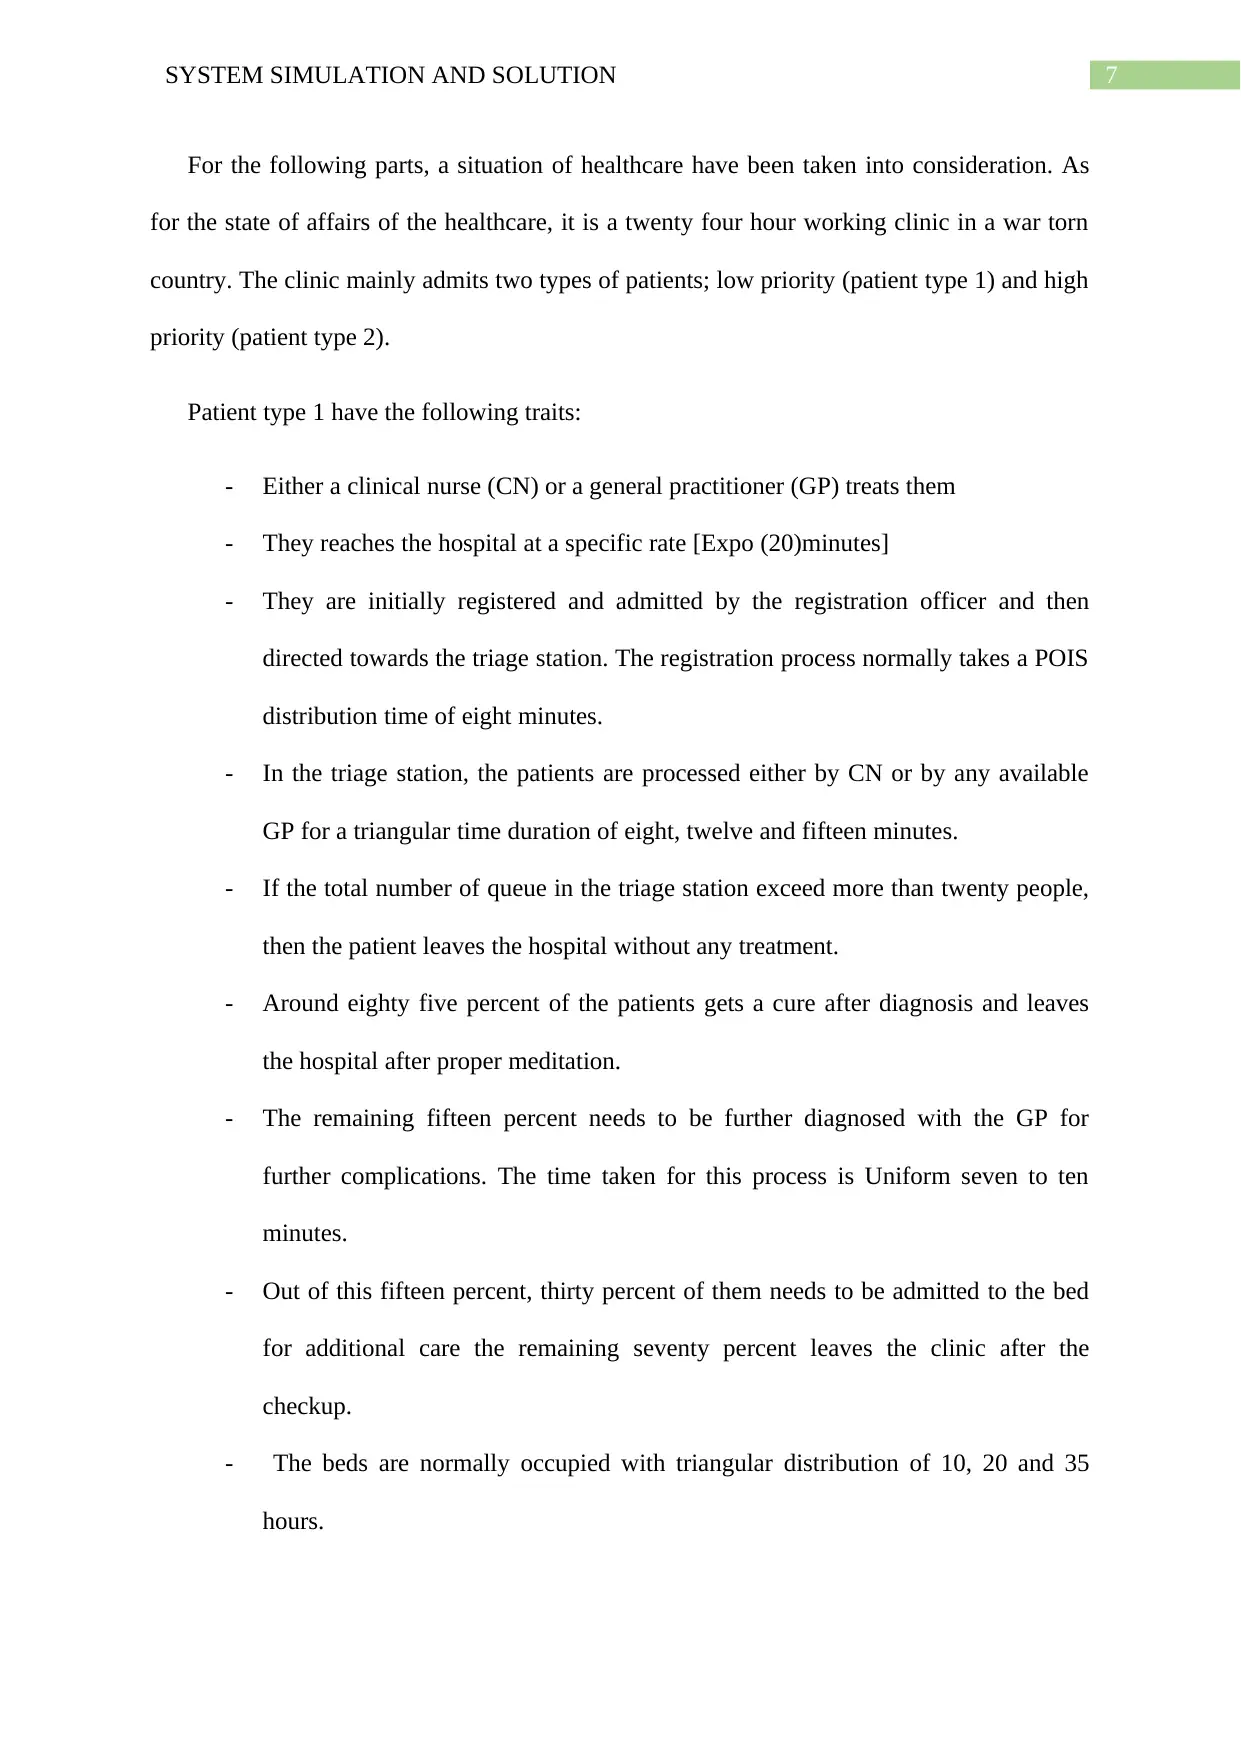
For the following parts, a situation of healthcare have been taken into consideration. As
for the state of affairs of the healthcare, it is a twenty four hour working clinic in a war torn
country. The clinic mainly admits two types of patients; low priority (patient type 1) and high
priority (patient type 2).
Patient type 1 have the following traits:
- Either a clinical nurse (CN) or a general practitioner (GP) treats them
- They reaches the hospital at a specific rate [Expo (20)minutes]
- They are initially registered and admitted by the registration officer and then
directed towards the triage station. The registration process normally takes a POIS
distribution time of eight minutes.
- In the triage station, the patients are processed either by CN or by any available
GP for a triangular time duration of eight, twelve and fifteen minutes.
- If the total number of queue in the triage station exceed more than twenty people,
then the patient leaves the hospital without any treatment.
- Around eighty five percent of the patients gets a cure after diagnosis and leaves
the hospital after proper meditation.
- The remaining fifteen percent needs to be further diagnosed with the GP for
further complications. The time taken for this process is Uniform seven to ten
minutes.
- Out of this fifteen percent, thirty percent of them needs to be admitted to the bed
for additional care the remaining seventy percent leaves the clinic after the
checkup.
- The beds are normally occupied with triangular distribution of 10, 20 and 35
hours.
8SYSTEM SIMULATION AND SOLUTION
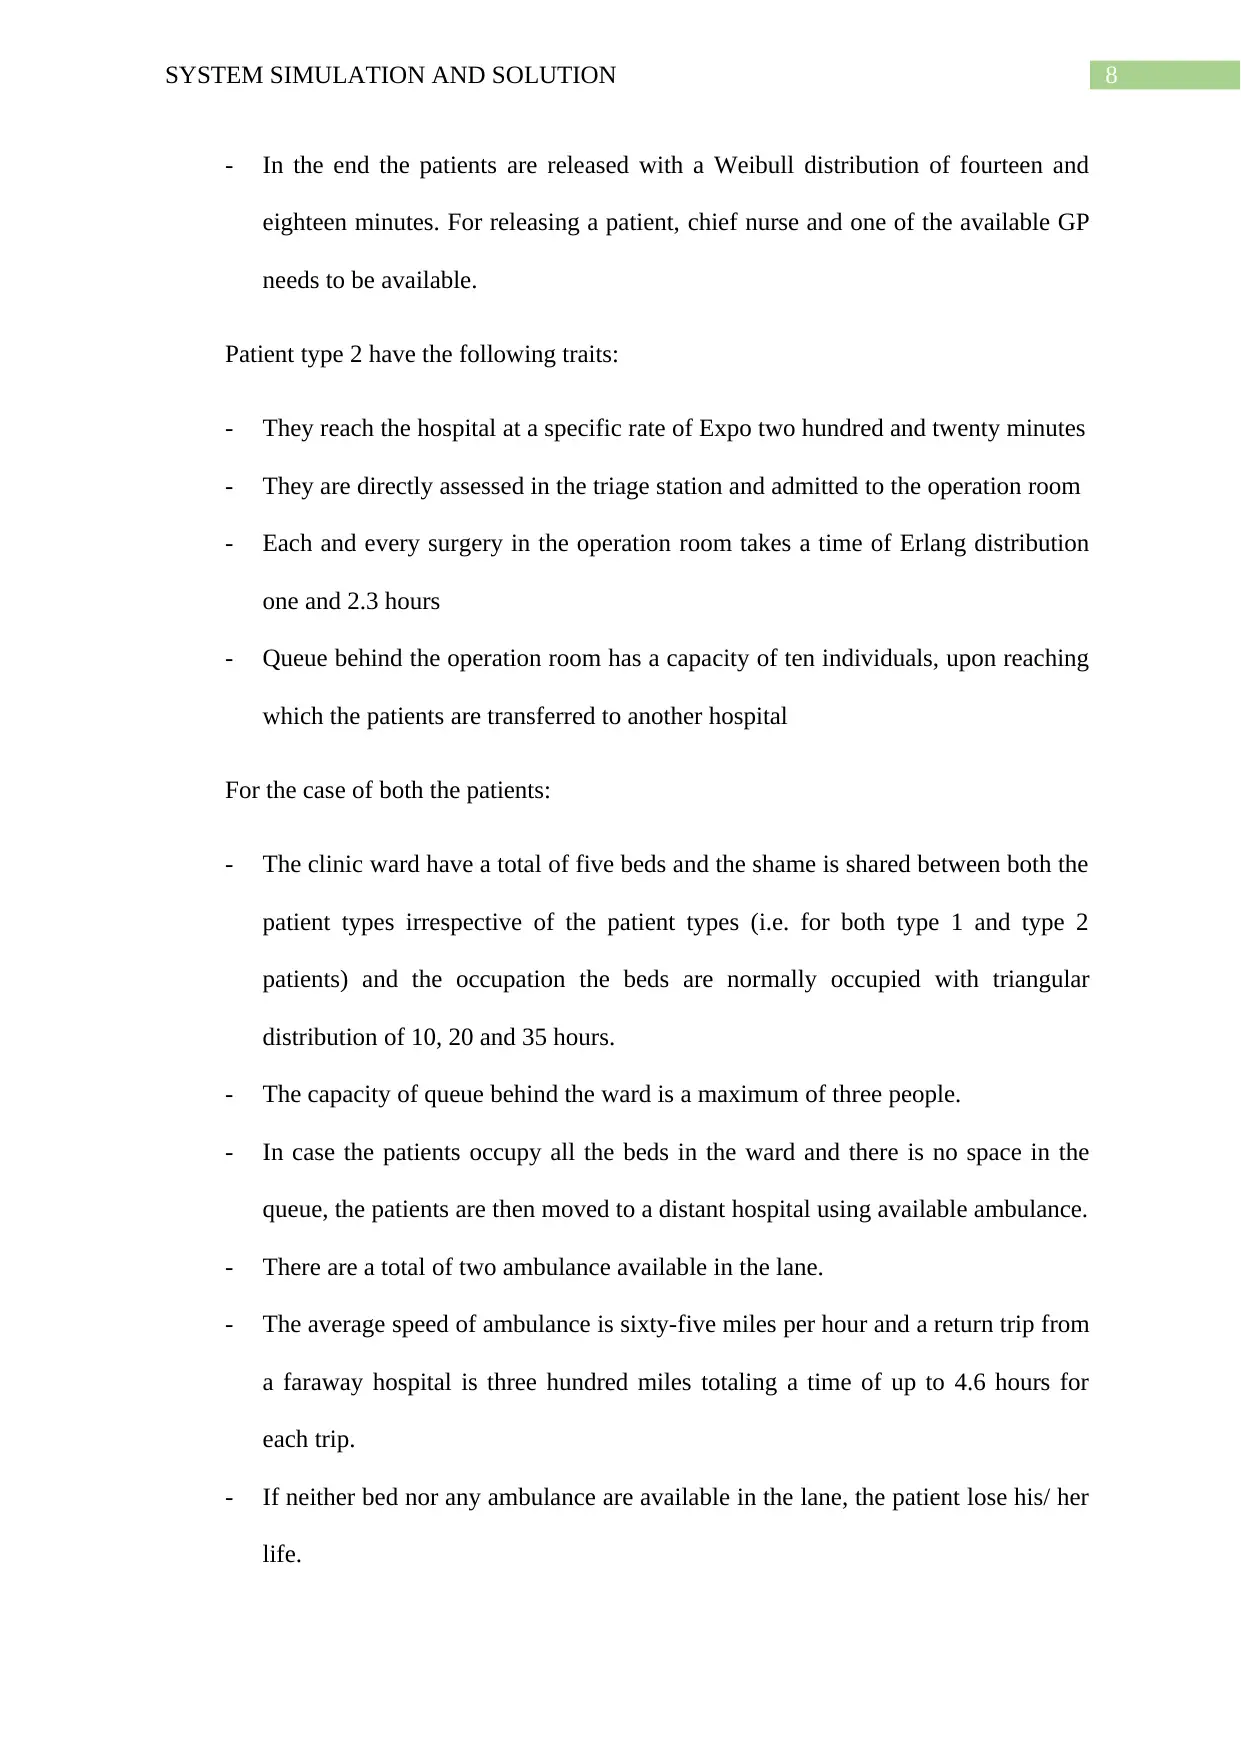
- In the end the patients are released with a Weibull distribution of fourteen and
eighteen minutes. For releasing a patient, chief nurse and one of the available GP
needs to be available.
Patient type 2 have the following traits:
- They reach the hospital at a specific rate of Expo two hundred and twenty minutes
- They are directly assessed in the triage station and admitted to the operation room
- Each and every surgery in the operation room takes a time of Erlang distribution
one and 2.3 hours
- Queue behind the operation room has a capacity of ten individuals, upon reaching
which the patients are transferred to another hospital
For the case of both the patients:
- The clinic ward have a total of five beds and the shame is shared between both the
patient types irrespective of the patient types (i.e. for both type 1 and type 2
patients) and the occupation the beds are normally occupied with triangular
distribution of 10, 20 and 35 hours.
- The capacity of queue behind the ward is a maximum of three people.
- In case the patients occupy all the beds in the ward and there is no space in the
queue, the patients are then moved to a distant hospital using available ambulance.
- There are a total of two ambulance available in the lane.
- The average speed of ambulance is sixty-five miles per hour and a return trip from
a faraway hospital is three hundred miles totaling a time of up to 4.6 hours for
each trip.
- If neither bed nor any ambulance are available in the lane, the patient lose his/ her
life.
⊘ This is a preview!⊘
Do you want full access?
Subscribe today to unlock all pages.
Trusted by 1+ million students worldwide
9SYSTEM SIMULATION AND SOLUTION
Part 1
Solution 1:
There were five replications done for this simulation. Each replication is for thirty
days. An average total of one hundred and sixteen type 1 patients and forty-six type 2 patients
were treated in the clinic in each replication. It results in a total of approximately five
hundred and eighty type 1 patients and two hundred and thirty type 2 patients being treated in
the clinic in for a total of five replications in the simulation.
Solution 2:
The average wait time for Type 1 patient is 3.17 hours whereas for type 2 patient it is
101.2 hours. The time difference between the two are vast because total number of type 1
patient entering and leaving the system is a lot (2138 approx.) compared to that of the type 2
patients (153 approx.). For type 1 patients, after a certain time, some patients leaves the clinic
due to large number of queue. Whereas for the type 2 patients, they do not leave the clinic
because the queue length is long and wait in the queue because they have high priority over
the type 1 ones.
Solution 3:
For the case of Instantaneous Utilization, the average utilization time of admission
officer is 0.41 hours approx., for chief nurse it is 0.90 hours approx., for clinical nurse 1,
clinical nurse 2, general practitioner 1, general practitioner 2, operation nurse, surgeon 1 and
surgeon 2, the utilization times are 0.08, 0.09, 0.99, 0.9, 0.34, 0.33 and 0.006 hours
respectively.
However for the case of Scheduled Utilization, the average utilization time of
admission officer, chief nurse, clinical nurse 1, clinical nurse 2, general practitioner 1, general
Paraphrase This Document
Need a fresh take? Get an instant paraphrase of this document with our AI Paraphraser
10SYSTEM SIMULATION AND SOLUTION
practitioner 2, operation nurse, surgeon 1 and surgeon 2, the utilization times are 0.4, 0.9,
0.085, 0.085, 0.9, 0.9, 0.335, 0.33 and 0.005 hours respectively.
Solution 4:
The average time for Type 1 patient is 3.609 hours approx. whereas for type 2 patient
the average time in the system is 114.85 hours approx. The time difference between the two
are massive because the total number of type 1 patient entering and leaving the system is a lot
(2138 approx.) with respect to that of the type 2 patients (153 approx.). In case of type 1
patients, after a certain period, a number of patient leaves the clinic because of large number
of queue in the triage area. Whereas for the type 2 patients, they do not leave the clinic
because of the queue length but rather wait in the queue as they have higher priority than that
of the type 1 patients.
Solution 5:
The average WIP of patient type 1 is 21.4840 hours whereas average WIP for patient
type 2 is 39.6550 hours.
Solution 6:
Many type 1 patients (2025.20 on an average) leave the system due to long queue in
the triage station. If the number of officials for checking the patients are increased, these can
be reduced by a huge amount. Many patients have to wait for getting access to ward beds.
Many of them died due to lack of ambulance availability and certain number of patients are
queuing behind the operation room. If the total number of beds in the wards, number of
operation room and operation personnel and number of ambulance availability are increased,
then these cases can be avoided.
11SYSTEM SIMULATION AND SOLUTION
Solution 7:
For single replication type analysis, sixty-seven patients died. However, for five
replications, a minimum of nine to a maximum of 109 patients lost their lives. The main
reason for losing their lives is due to large queue behind the wards and unavailability of
ambulance. These can be increased by increasing the ambulance availability and number of
beds in the clinic ward.
Solution 8:
The average mortality rate for one replication is 2.9 percent. It is obtained by taking
the total number of person expired divided by the total number of person entering the system.
Solution 9:
If an assumption is added like, the patients who wait has to wait more than one hour
in the queue for transferring to hospital will lose their lives, then the mortality rate will
decrease to some extent. It is so because for the current system, there is no queue for waiting
to avail the ambulance service in other words, in the current system, if the ambulance in not
available, the patient dies.
Solution 10:
The ideal number of queue behind the operation room should be around 1 to two
personnel to reduce the mortality rate.
Part 2
Solution 11:
In order to reduce the number of lost patients due to long queue, separate checkup
sections should be done for different types of patients with more number of personnel
available in the type two areas. Number of bed in the wards should be separated for type 1
and 2 patients with more beds for the type 2 patients. There is also a need for increase of
⊘ This is a preview!⊘
Do you want full access?
Subscribe today to unlock all pages.
Trusted by 1+ million students worldwide
1 out of 17
Related Documents


Your All-in-One AI-Powered Toolkit for Academic Success.
+13062052269
info@desklib.com
Available 24*7 on WhatsApp / Email
![[object Object]](/_next/static/media/star-bottom.7253800d.svg)
Unlock your academic potential
Copyright © 2020–2026 A2Z Services. All Rights Reserved. Developed and managed by ZUCOL.