PSYC 2525: Statistical Analysis of T-Tests and Hypothesis Results
VerifiedAdded on 2023/06/05
|3
|875
|227
Homework Assignment
AI Summary
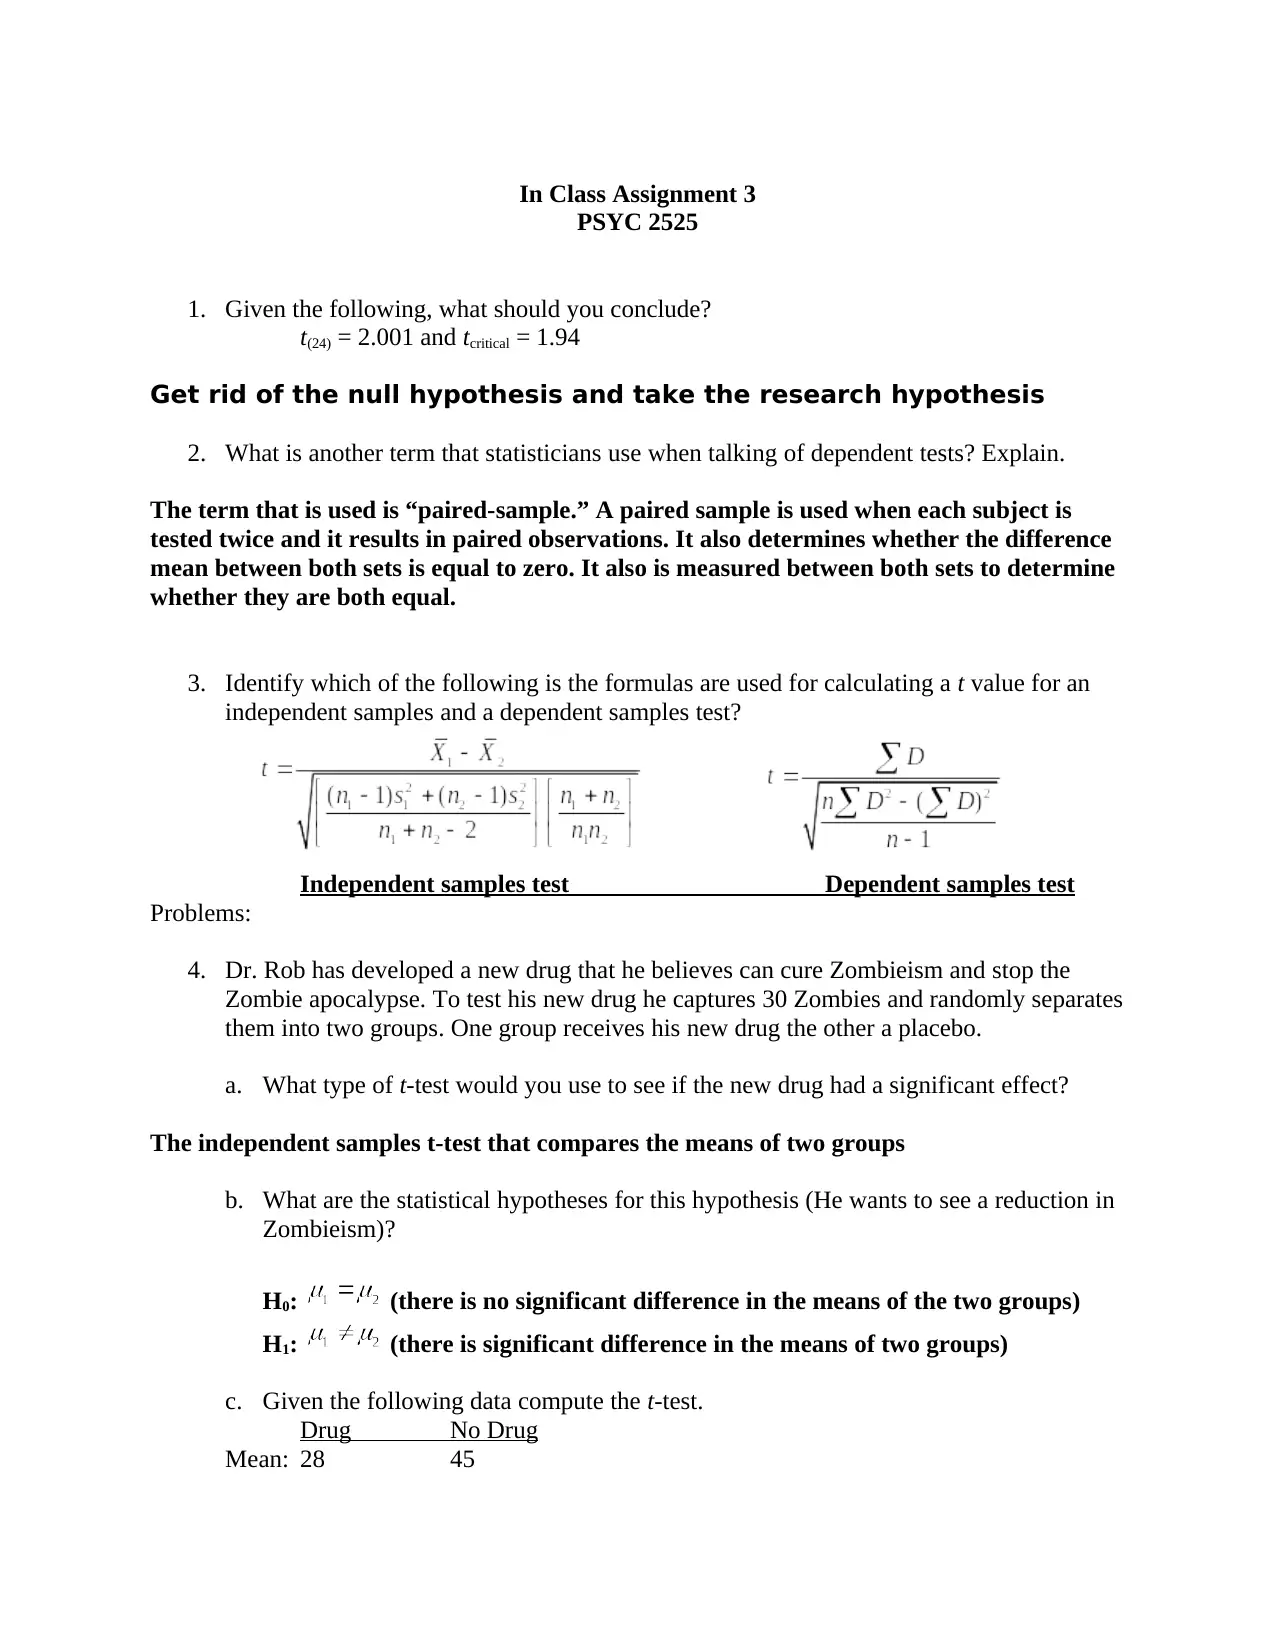
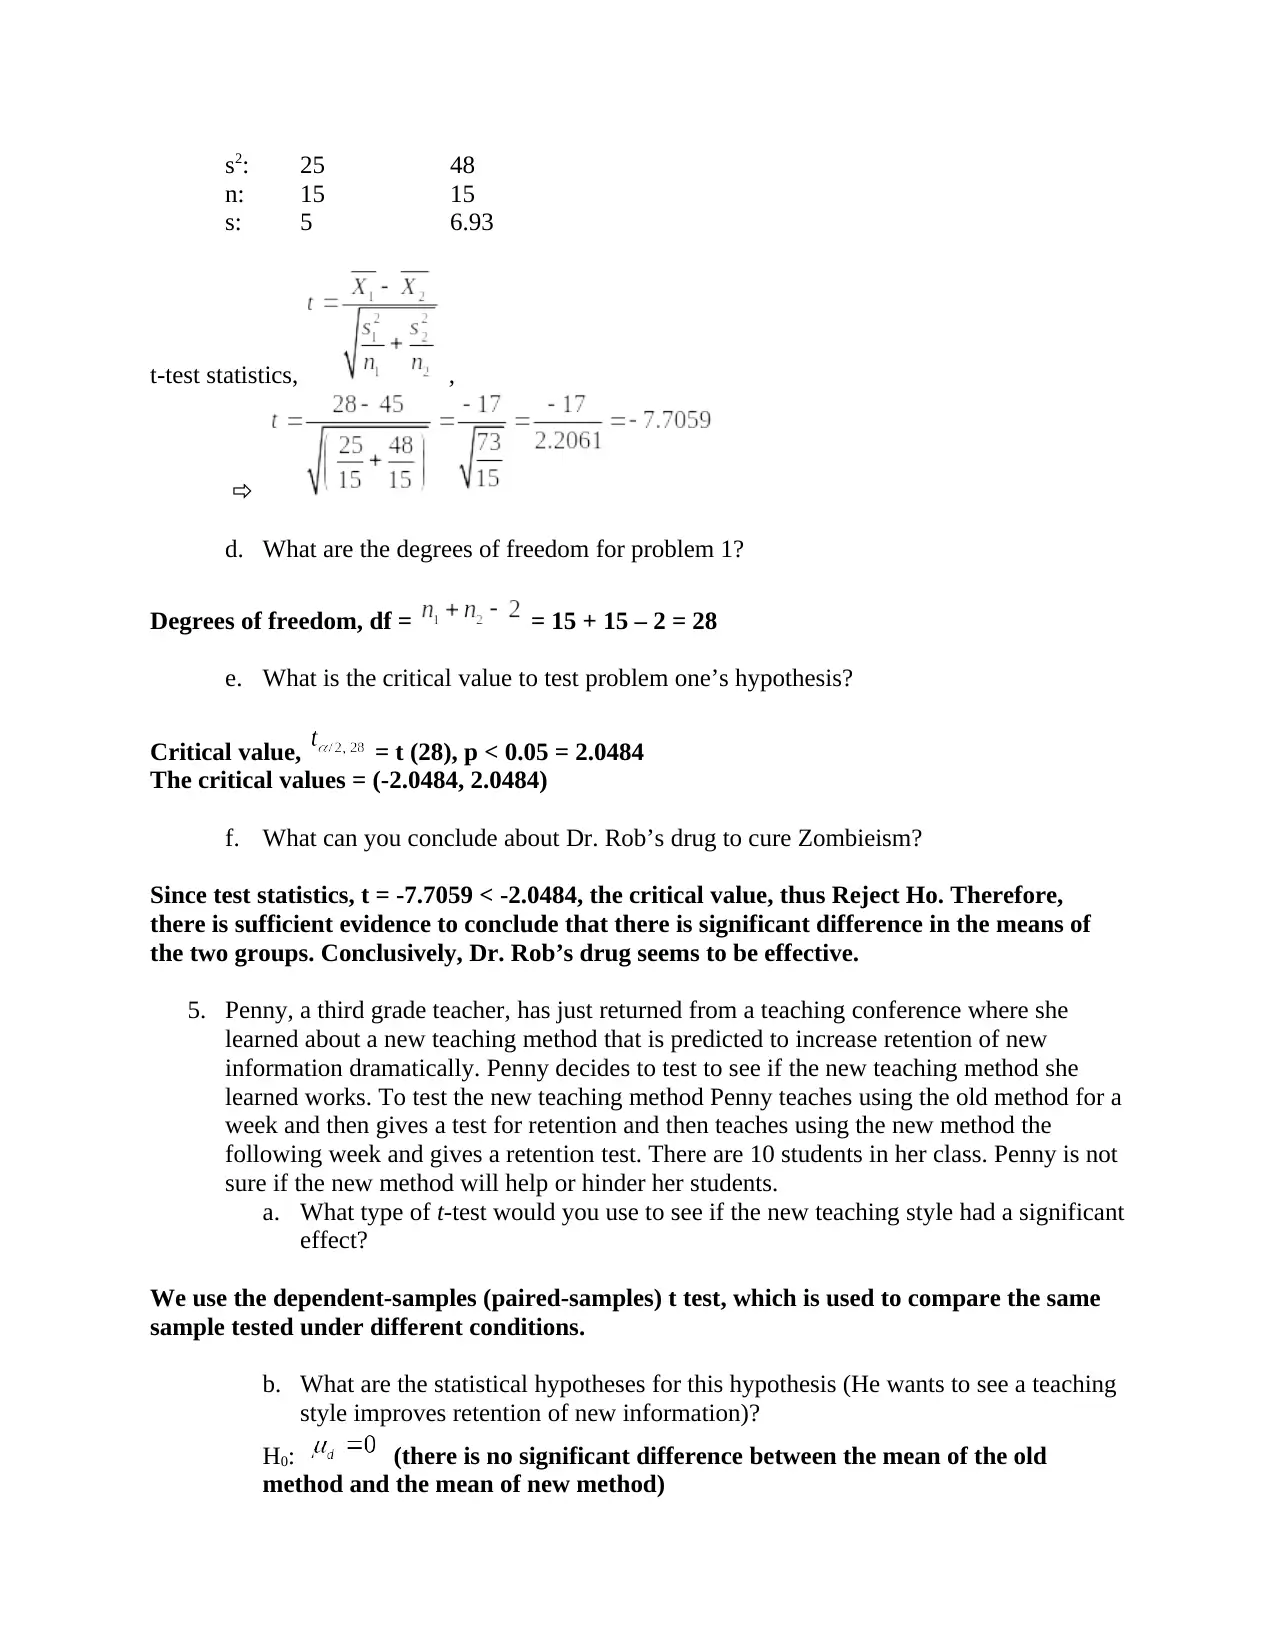
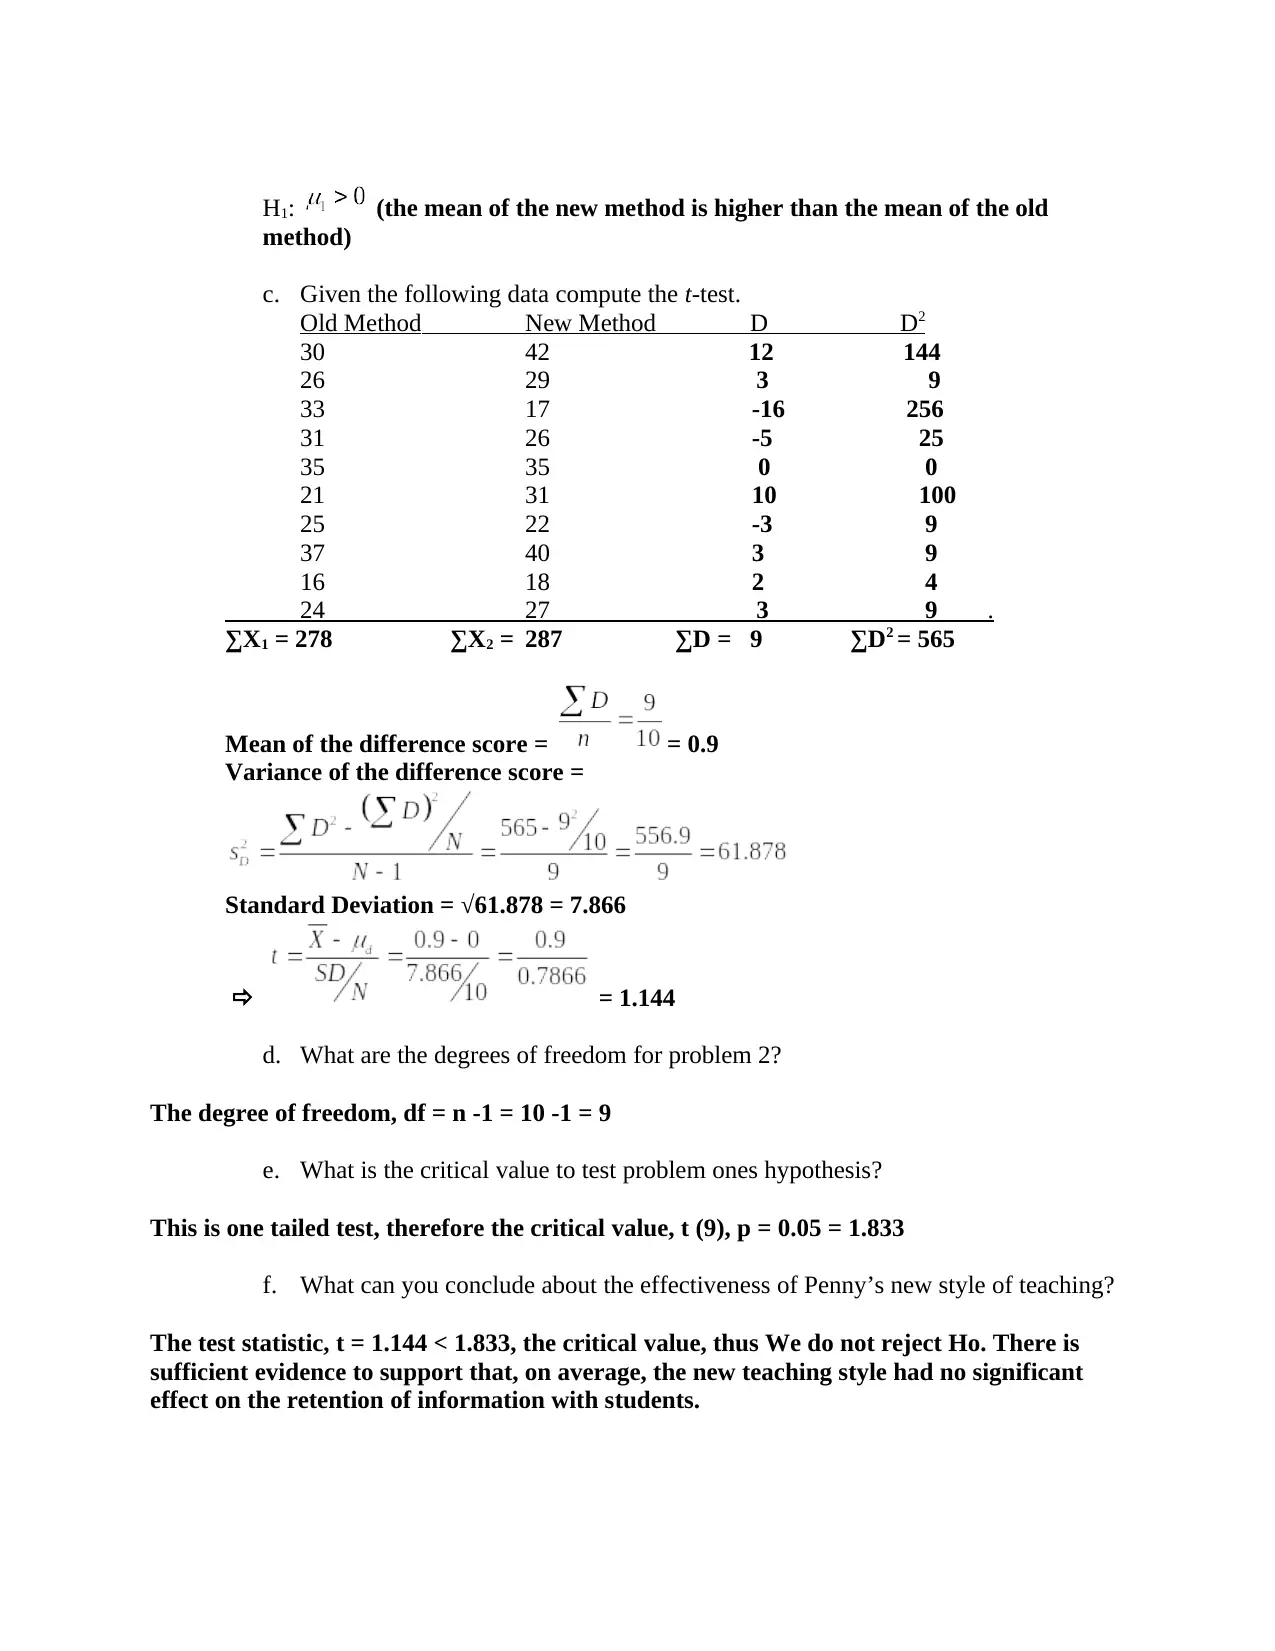
This assignment solution for PSYC 2525 covers t-tests, including independent and dependent samples tests. It addresses statistical hypotheses, degrees of freedom, and critical values. The solution includes practical problems, such as analyzing the effectiveness of a new drug to cure Zombieism using an independent samples t-test and evaluating a new teaching method's impact on student retention using a dependent samples t-test. Detailed calculations and conclusions are provided for each problem, demonstrating the application of t-tests in research hypothesis testing. The assignment concludes by interpreting the results and determining whether to reject or fail to reject the null hypothesis based on the calculated test statistics and critical values.
1 out of 3
Related Documents


Your All-in-One AI-Powered Toolkit for Academic Success.
+13062052269
info@desklib.com
Available 24*7 on WhatsApp / Email
![[object Object]](/_next/static/media/star-bottom.7253800d.svg)
© 2024 | Zucol Services PVT LTD | All rights reserved.