Financial Analysis: Share Portfolio Performance and Recommendations
VerifiedAdded on 2020/09/09
|23
|2827
|353
Report
AI Summary
This report presents a comprehensive analysis of a share portfolio comprising BHP Group Limited, Woolworths Group Limited, and Wesfarmers Limited. It begins with a comparative description of each company, including key financial data and CEO information. The report then examines the share price performance of each company, along with the All Ordinaries Index, using a table and charts to illustrate market trends from July 29th to August 28th, 2019. An overview of share price performance highlights the impact of the US-China trade war on the Australian stock market, discussing the fluctuations of each stock. Calculations of gains and losses on the portfolio are provided, leading to investment recommendations for each stock. The report further includes an identification of key financial data and ratio analysis, focusing on liquidity, stability, profitability, and investment metrics. The analysis aims to provide a clear understanding of the portfolio's performance and offer informed investment advice.
Table of Contents
Table of Contents
Table of Contents........................................................................................................................................1
Part 2...........................................................................................................................................................2
(a) Brief Description of Each Company....................................................................................................2
(b) Graphs, Share price table and All Ordinaries Index of Each Company...............................................3
(c) Overview of Share price Performance................................................................................................6
(d) Calculation of Gain and Loss on Portfolio...........................................................................................7
(e) Recommendation of the share portfolio............................................................................................8
Part 3...........................................................................................................................................................8
(a) Identification of Key financial data.....................................................................................................8
(b) Ratio Analysis.....................................................................................................................................8
Liquidity...............................................................................................................................................8
Stability................................................................................................................................................9
Profitability........................................................................................................................................10
Investment.........................................................................................................................................10
References.................................................................................................................................................12
Appendices................................................................................................................................................13
1 | P a g e
Paraphrase This Document
Need a fresh take? Get an instant paraphrase of this document with our AI Paraphraser
Part 2
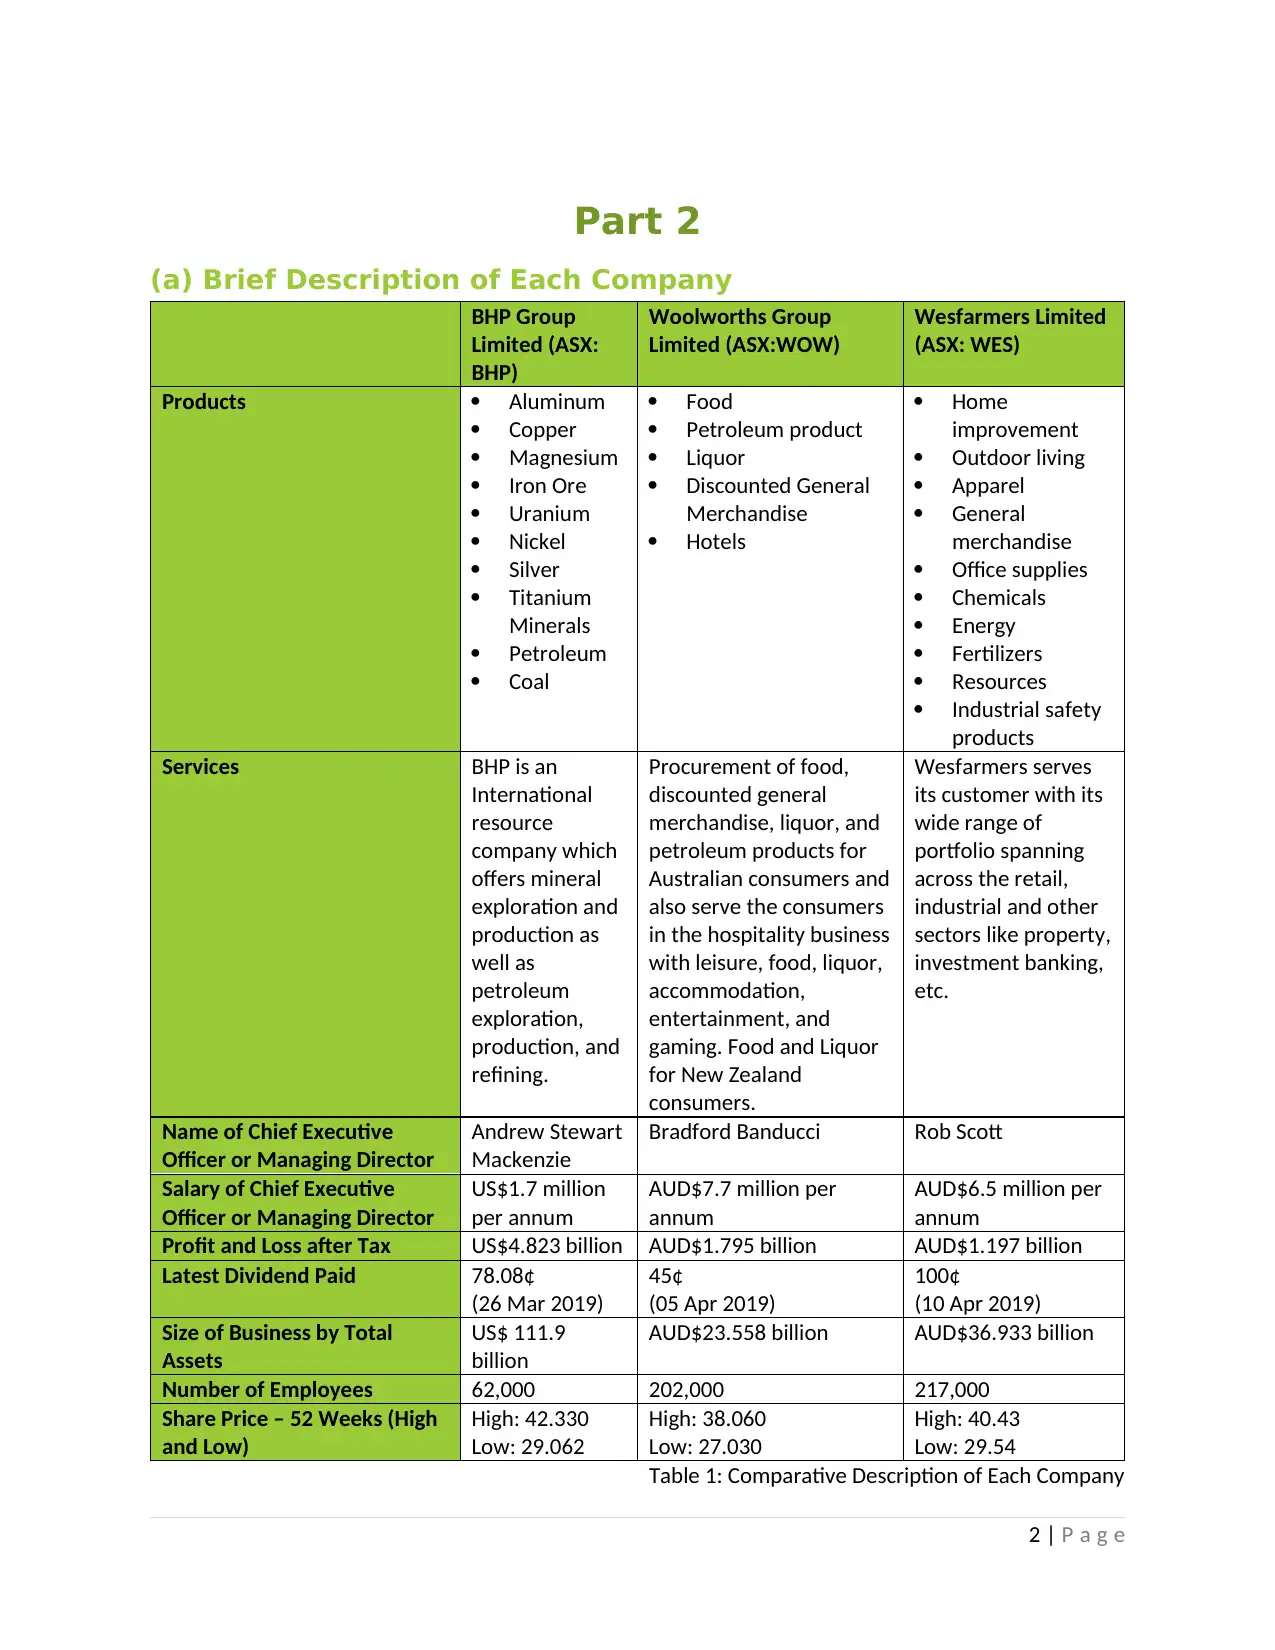
(a) Brief Description of Each Company
BHP Group
Limited (ASX:
BHP)
Woolworths Group
Limited (ASX:WOW)
Wesfarmers Limited
(ASX: WES)
Products Aluminum
Copper
Magnesium
Iron Ore
Uranium
Nickel
Silver
Titanium
Minerals
Petroleum
Coal
Food
Petroleum product
Liquor
Discounted General
Merchandise
Hotels
Home
improvement
Outdoor living
Apparel
General
merchandise
Office supplies
Chemicals
Energy
Fertilizers
Resources
Industrial safety
products
Services BHP is an
International
resource
company which
offers mineral
exploration and
production as
well as
petroleum
exploration,
production, and
refining.
Procurement of food,
discounted general
merchandise, liquor, and
petroleum products for
Australian consumers and
also serve the consumers
in the hospitality business
with leisure, food, liquor,
accommodation,
entertainment, and
gaming. Food and Liquor
for New Zealand
consumers.
Wesfarmers serves
its customer with its
wide range of
portfolio spanning
across the retail,
industrial and other
sectors like property,
investment banking,
etc.
Name of Chief Executive
Officer or Managing Director
Andrew Stewart
Mackenzie
Bradford Banducci Rob Scott
Salary of Chief Executive
Officer or Managing Director
US$1.7 million
per annum
AUD$7.7 million per
annum
AUD$6.5 million per
annum
Profit and Loss after Tax US$4.823 billion AUD$1.795 billion AUD$1.197 billion
Latest Dividend Paid 78.08¢
(26 Mar 2019)
45¢
(05 Apr 2019)
100¢
(10 Apr 2019)
Size of Business by Total
Assets
US$ 111.9
billion
AUD$23.558 billion AUD$36.933 billion
Number of Employees 62,000 202,000 217,000
Share Price – 52 Weeks (High
and Low)
High: 42.330
Low: 29.062
High: 38.060
Low: 27.030
High: 40.43
Low: 29.54
Table 1: Comparative Description of Each Company
2 | P a g e
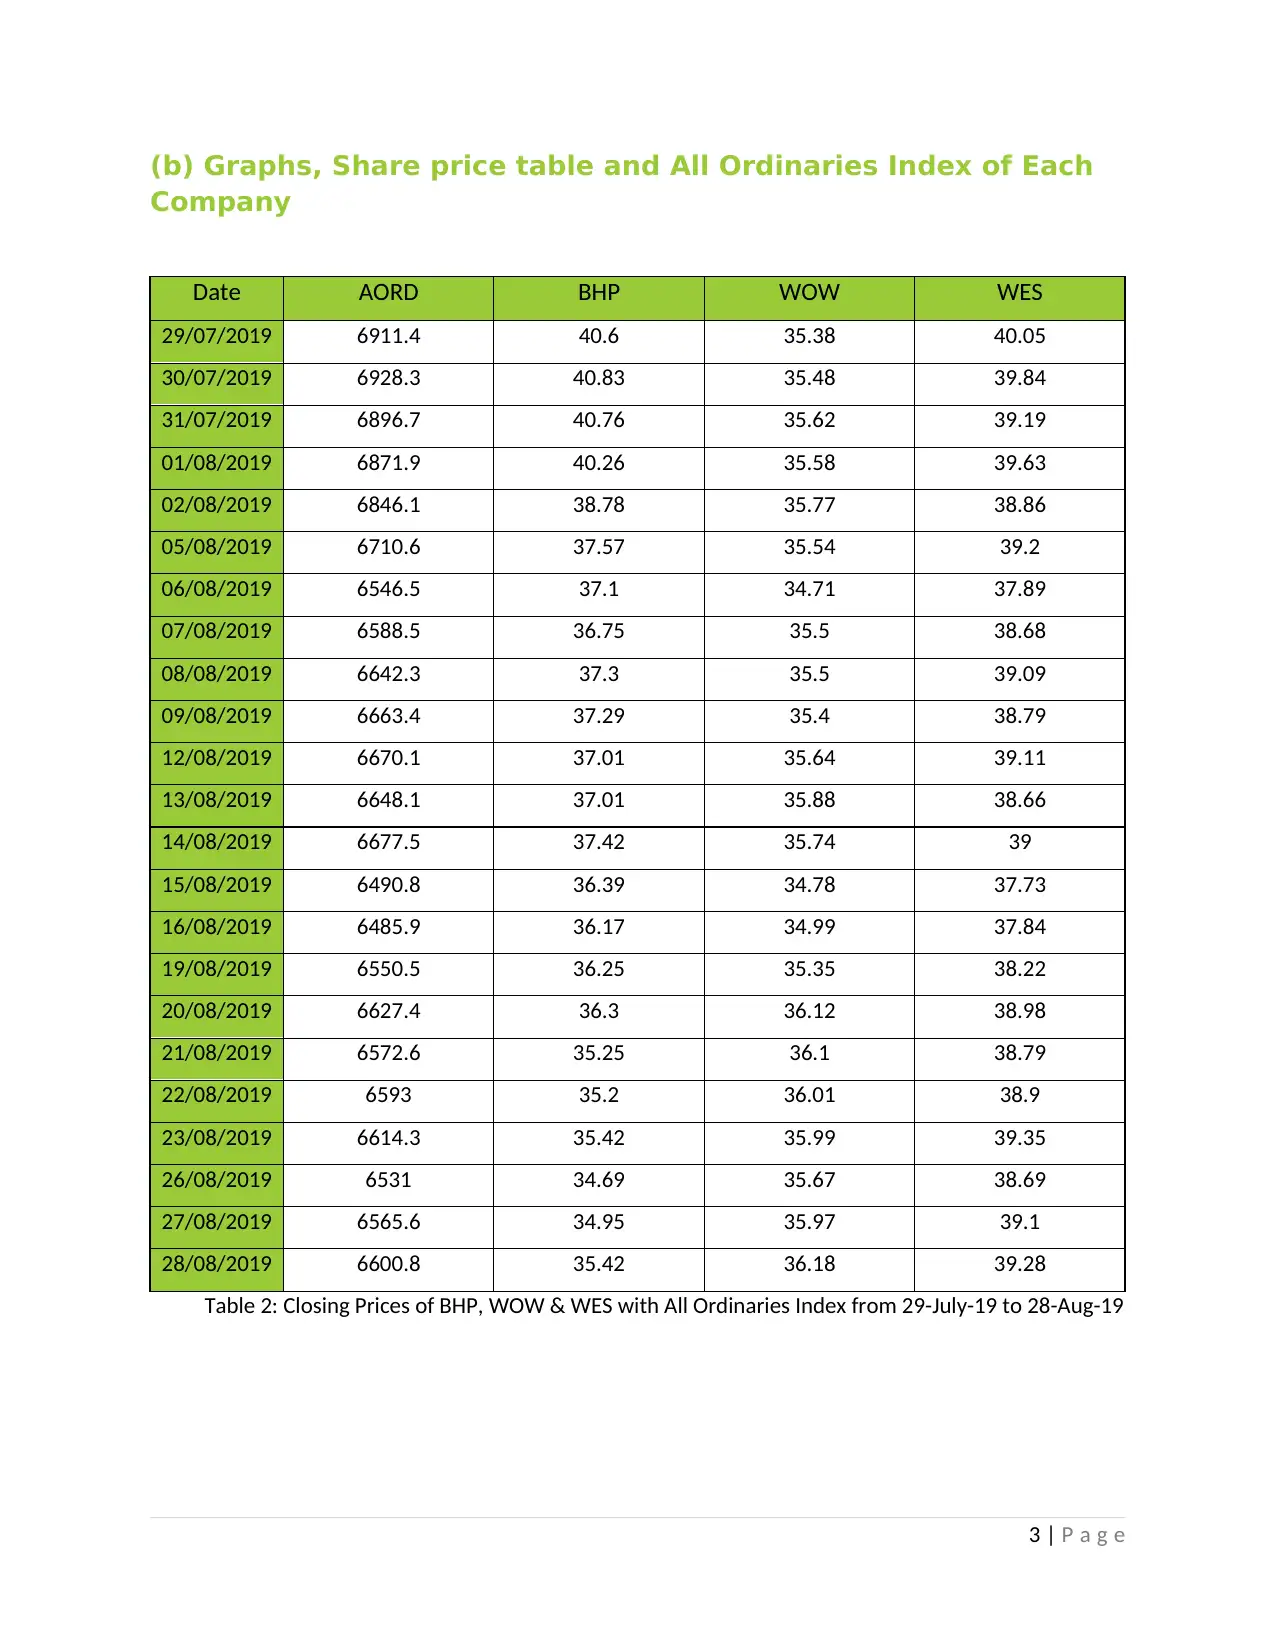
(b) Graphs, Share price table and All Ordinaries Index of Each
Company
Date AORD BHP WOW WES
29/07/2019 6911.4 40.6 35.38 40.05
30/07/2019 6928.3 40.83 35.48 39.84
31/07/2019 6896.7 40.76 35.62 39.19
01/08/2019 6871.9 40.26 35.58 39.63
02/08/2019 6846.1 38.78 35.77 38.86
05/08/2019 6710.6 37.57 35.54 39.2
06/08/2019 6546.5 37.1 34.71 37.89
07/08/2019 6588.5 36.75 35.5 38.68
08/08/2019 6642.3 37.3 35.5 39.09
09/08/2019 6663.4 37.29 35.4 38.79
12/08/2019 6670.1 37.01 35.64 39.11
13/08/2019 6648.1 37.01 35.88 38.66
14/08/2019 6677.5 37.42 35.74 39
15/08/2019 6490.8 36.39 34.78 37.73
16/08/2019 6485.9 36.17 34.99 37.84
19/08/2019 6550.5 36.25 35.35 38.22
20/08/2019 6627.4 36.3 36.12 38.98
21/08/2019 6572.6 35.25 36.1 38.79
22/08/2019 6593 35.2 36.01 38.9
23/08/2019 6614.3 35.42 35.99 39.35
26/08/2019 6531 34.69 35.67 38.69
27/08/2019 6565.6 34.95 35.97 39.1
28/08/2019 6600.8 35.42 36.18 39.28
Table 2: Closing Prices of BHP, WOW & WES with All Ordinaries Index from 29-July-19 to 28-Aug-19
3 | P a g e
⊘ This is a preview!⊘
Do you want full access?
Subscribe today to unlock all pages.
Trusted by 1+ million students worldwide
7/ 2 9 / 2 01 9
7/ 3 0 / 2 01 9
7/ 3 1 / 2 01 9
8/ 1 / 2 0 19
8/ 2 / 2 0 19
8/ 3 / 2 0 19
8/ 4 / 2 0 19
8/ 5 / 2 0 19
8/ 6 / 2 0 19
8/ 7 / 2 0 19
8/ 8 / 2 0 19
8/ 9 / 2 0 19
8/ 1 0 / 2 01 9
8/ 1 1 / 2 01 9
8/ 1 2 / 2 01 9
8/ 1 3 / 2 01 9
8/ 1 4 / 2 01 9
8/ 1 5 / 2 01 9
8/ 1 6 / 2 01 9
8/ 1 7 / 2 01 9
8/ 1 8 / 2 01 9
8/ 1 9 / 2 01 9
8/ 2 0 / 2 01 9
8/ 2 1 / 2 01 9
8/ 2 2 / 2 01 9
8/ 2 3 / 2 01 9
8/ 2 4 / 2 01 9
8/ 2 5 / 2 01 9
8/ 2 6 / 2 01 9
8/ 2 7 / 2 01 9
8/ 2 8 / 2 01 9
6200
6300
6400
6500
6600
6700
6800
6900
7000
ALL ORDINARIES INDEX
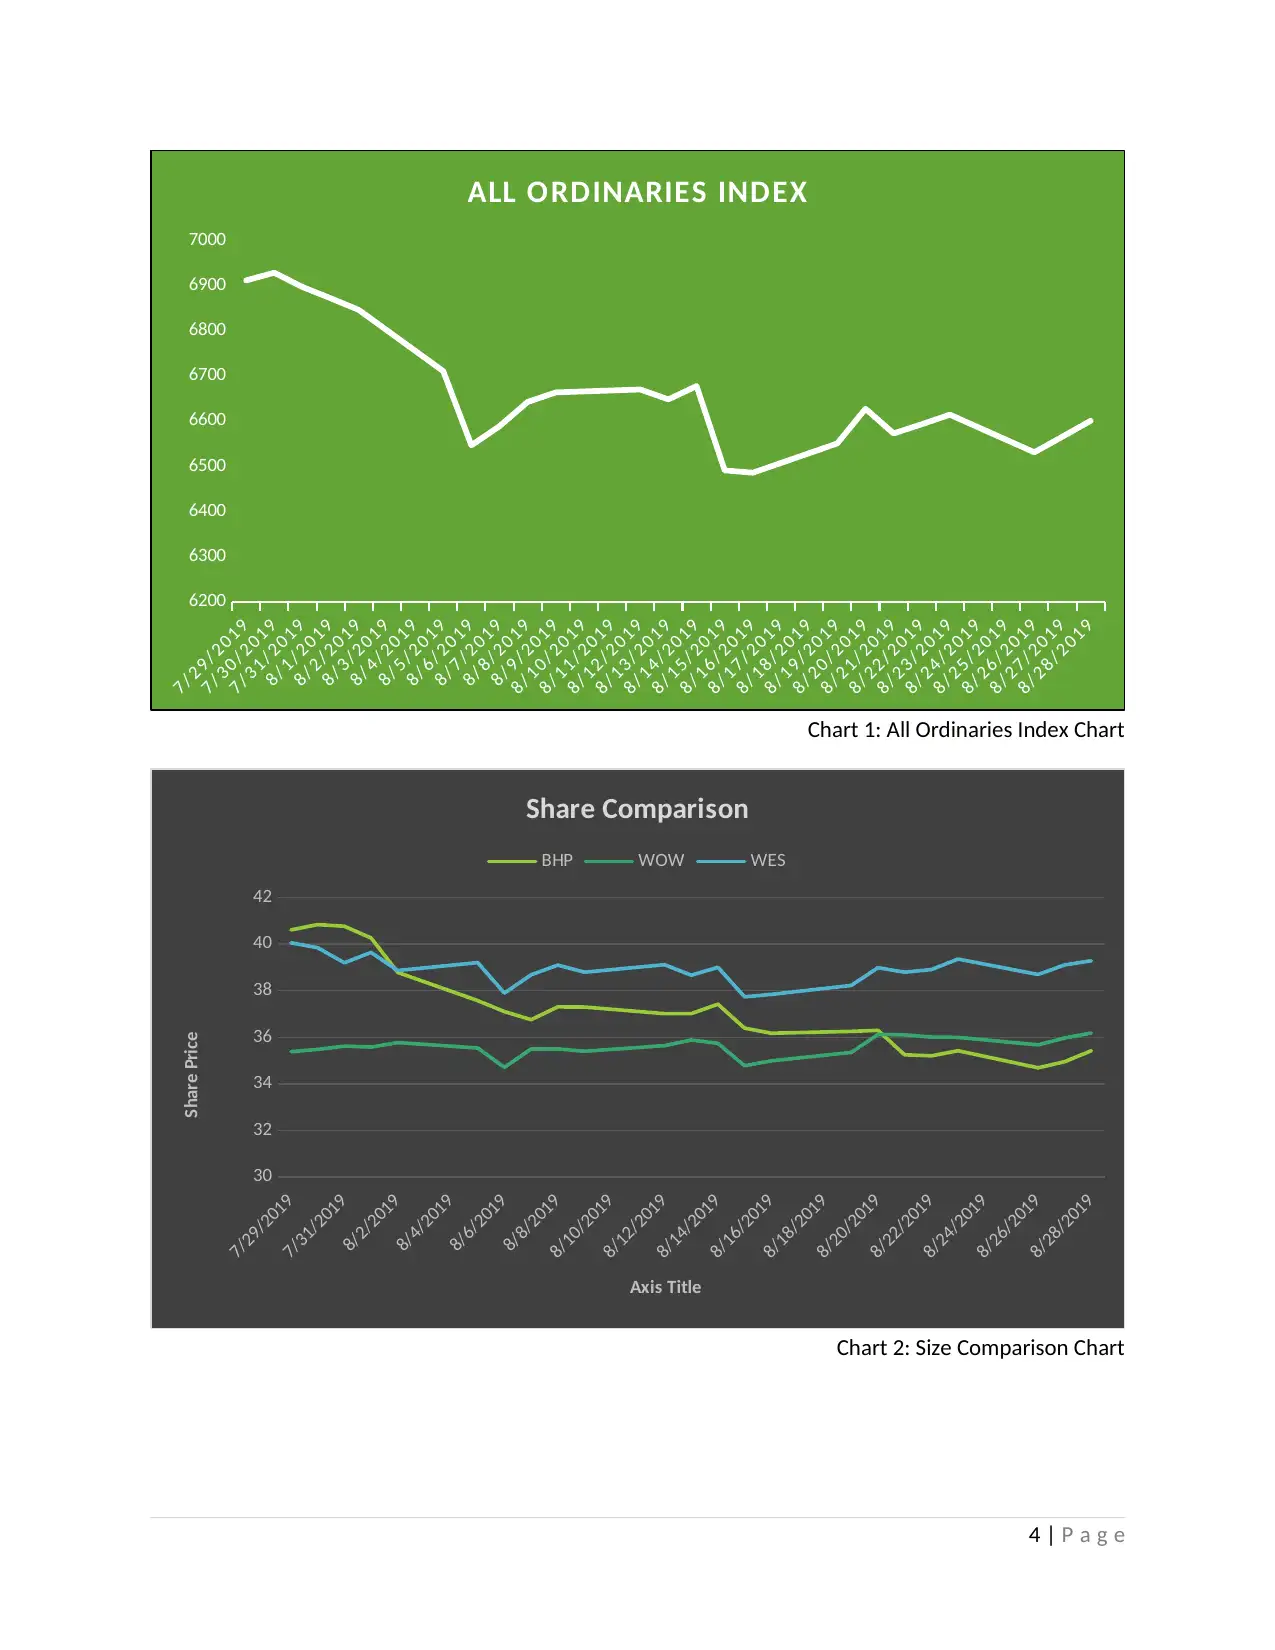
Chart 1: All Ordinaries Index Chart
7/29/2019
7/31/2019
8/2/2019
8/4/2019
8/6/2019
8/8/2019
8/10/2019
8/12/2019
8/14/2019
8/16/2019
8/18/2019
8/20/2019
8/22/2019
8/24/2019
8/26/2019
8/28/2019
30
32
34
36
38
40
42
Share Comparison
BHP WOW WES
Axis Title
Share Price
Chart 2: Size Comparison Chart
4 | P a g e
7/ 3 0 / 2 01 9
7/ 3 1 / 2 01 9
8/ 1 / 2 0 19
8/ 2 / 2 0 19
8/ 3 / 2 0 19
8/ 4 / 2 0 19
8/ 5 / 2 0 19
8/ 6 / 2 0 19
8/ 7 / 2 0 19
8/ 8 / 2 0 19
8/ 9 / 2 0 19
8/ 1 0 / 2 01 9
8/ 1 1 / 2 01 9
8/ 1 2 / 2 01 9
8/ 1 3 / 2 01 9
8/ 1 4 / 2 01 9
8/ 1 5 / 2 01 9
8/ 1 6 / 2 01 9
8/ 1 7 / 2 01 9
8/ 1 8 / 2 01 9
8/ 1 9 / 2 01 9
8/ 2 0 / 2 01 9
8/ 2 1 / 2 01 9
8/ 2 2 / 2 01 9
8/ 2 3 / 2 01 9
8/ 2 4 / 2 01 9
8/ 2 5 / 2 01 9
8/ 2 6 / 2 01 9
8/ 2 7 / 2 01 9
8/ 2 8 / 2 01 9
6200
6300
6400
6500
6600
6700
6800
6900
7000
ALL ORDINARIES INDEX
Chart 1: All Ordinaries Index Chart
7/29/2019
7/31/2019
8/2/2019
8/4/2019
8/6/2019
8/8/2019
8/10/2019
8/12/2019
8/14/2019
8/16/2019
8/18/2019
8/20/2019
8/22/2019
8/24/2019
8/26/2019
8/28/2019
30
32
34
36
38
40
42
Share Comparison
BHP WOW WES
Axis Title
Share Price
Chart 2: Size Comparison Chart
4 | P a g e
Paraphrase This Document
Need a fresh take? Get an instant paraphrase of this document with our AI Paraphraser
7/29/2019
7/31/2019
8/2/2019
8/4/2019
8/6/2019
8/8/2019
8/10/2019
8/12/2019
8/14/2019
8/16/2019
8/18/2019
8/20/2019
8/22/2019
8/24/2019
8/26/2019
8/28/2019
6200
6300
6400
6500
6600
6700
6800
6900
7000
30
32
34
36
38
40
42
BHP in Comparison wih AORD
AORD BHP
AORD Index
Share Price
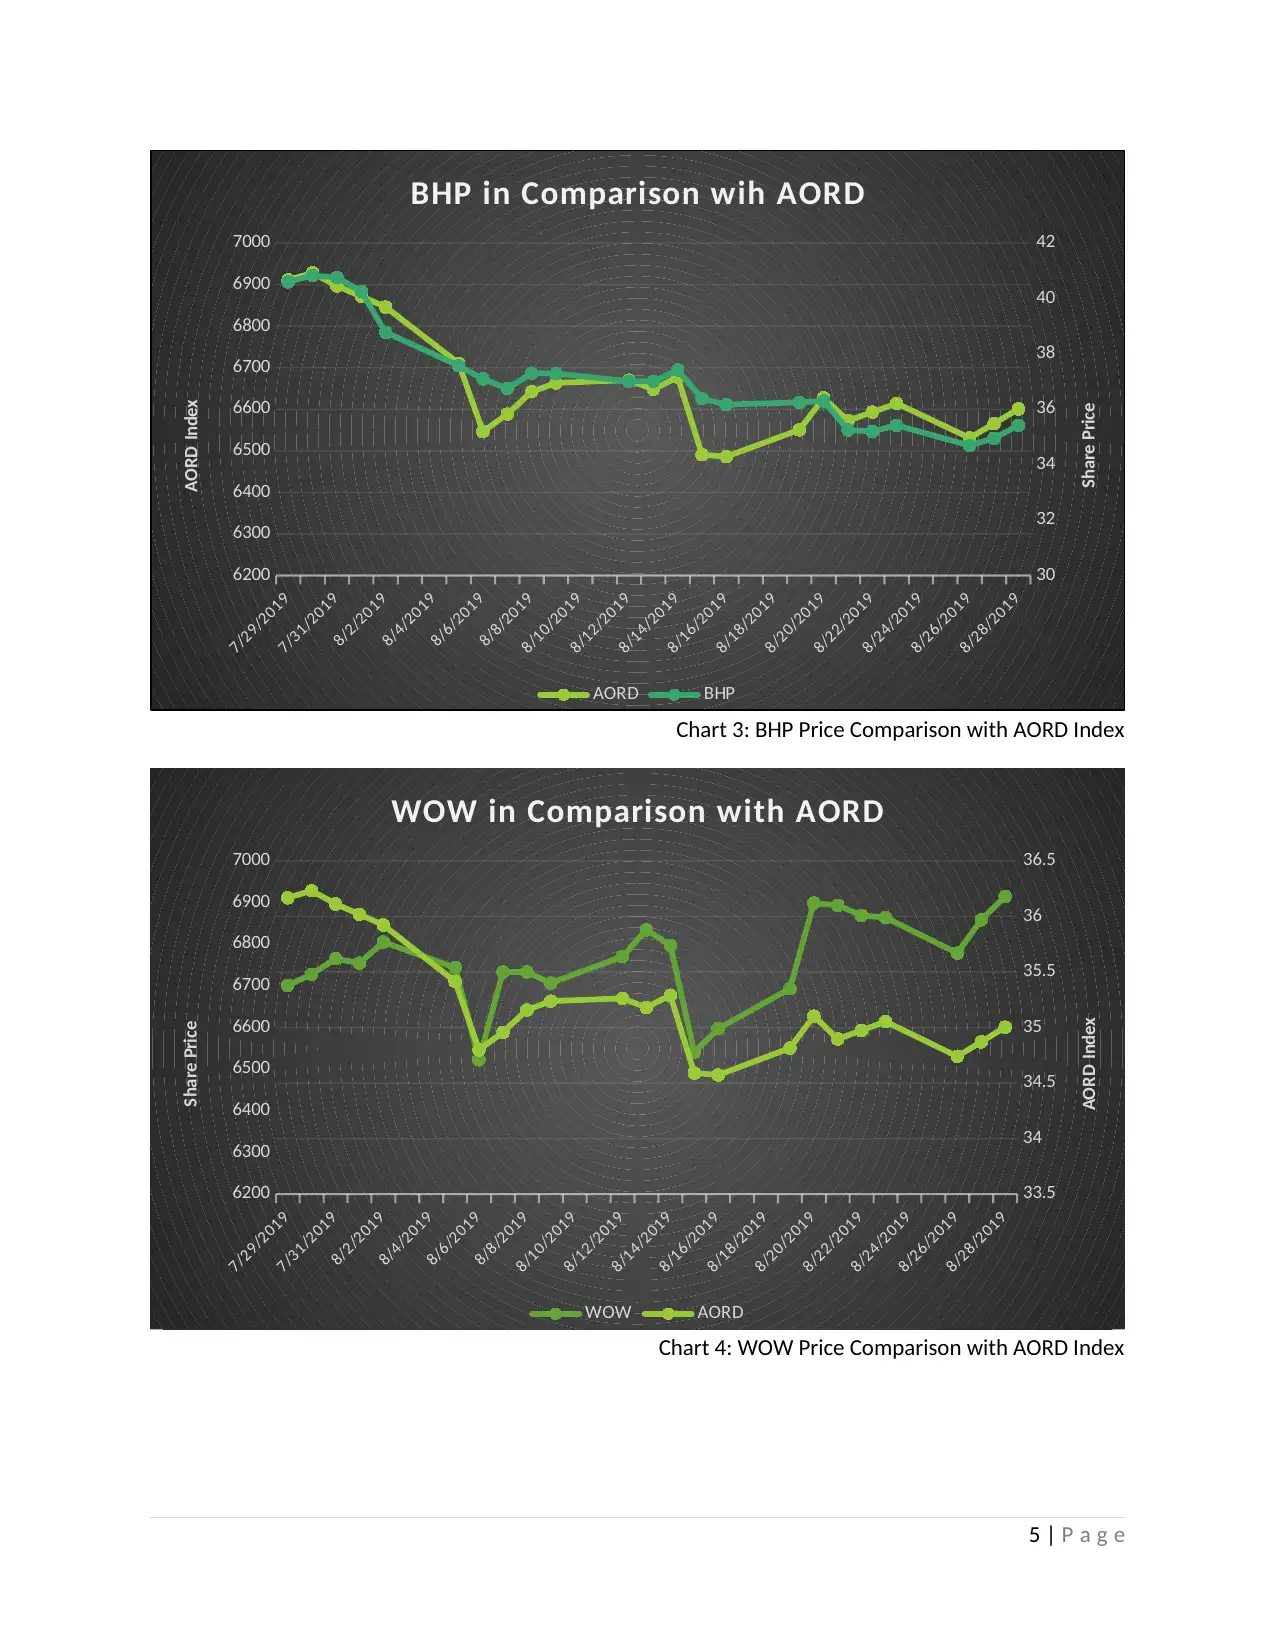
Chart 3: BHP Price Comparison with AORD Index
7/29/2019
7/31/2019
8/2/2019
8/4/2019
8/6/2019
8/8/2019
8/10/2019
8/12/2019
8/14/2019
8/16/2019
8/18/2019
8/20/2019
8/22/2019
8/24/2019
8/26/2019
8/28/2019
33.5
34
34.5
35
35.5
36
36.5
6200
6300
6400
6500
6600
6700
6800
6900
7000
WOW in Comparison with AORD
WOW AORD
Share Price
AORD Index
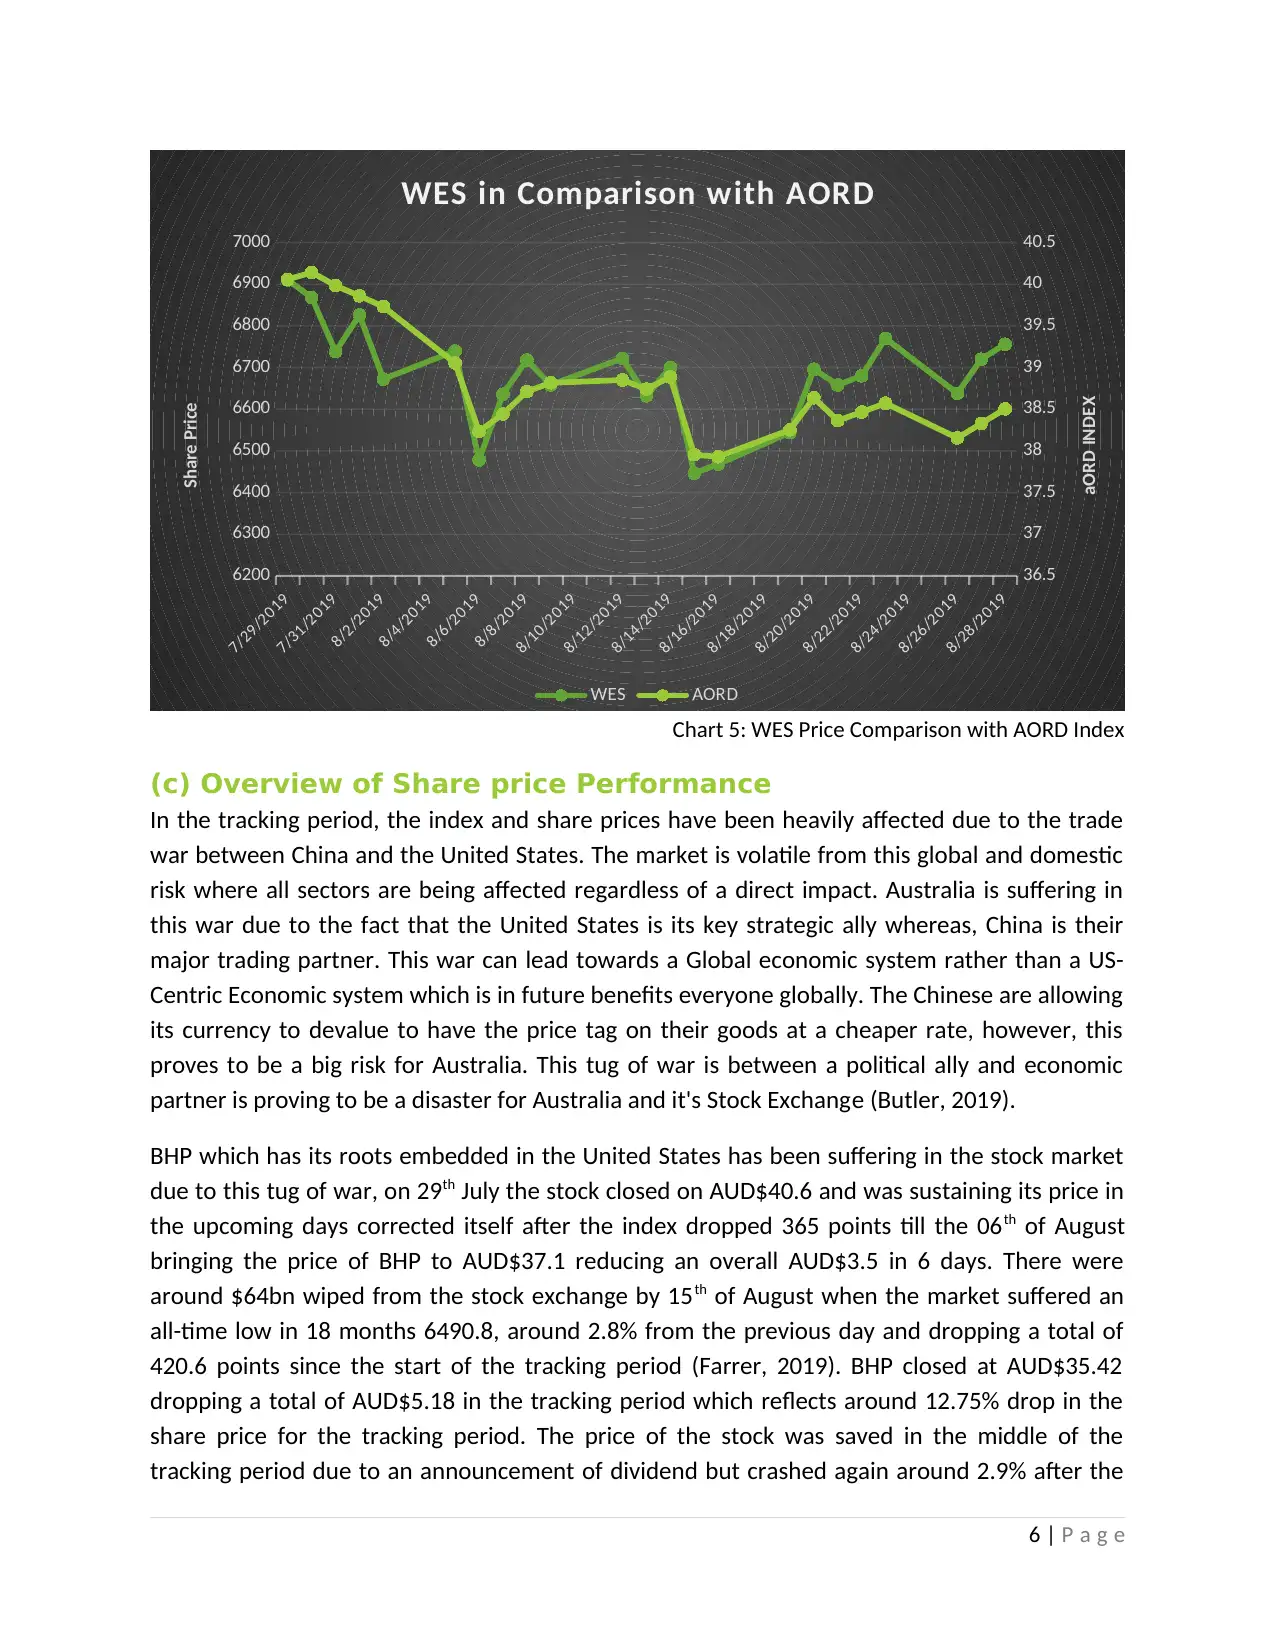
Chart 4: WOW Price Comparison with AORD Index
5 | P a g e
7/31/2019
8/2/2019
8/4/2019
8/6/2019
8/8/2019
8/10/2019
8/12/2019
8/14/2019
8/16/2019
8/18/2019
8/20/2019
8/22/2019
8/24/2019
8/26/2019
8/28/2019
6200
6300
6400
6500
6600
6700
6800
6900
7000
30
32
34
36
38
40
42
BHP in Comparison wih AORD
AORD BHP
AORD Index
Share Price
Chart 3: BHP Price Comparison with AORD Index
7/29/2019
7/31/2019
8/2/2019
8/4/2019
8/6/2019
8/8/2019
8/10/2019
8/12/2019
8/14/2019
8/16/2019
8/18/2019
8/20/2019
8/22/2019
8/24/2019
8/26/2019
8/28/2019
33.5
34
34.5
35
35.5
36
36.5
6200
6300
6400
6500
6600
6700
6800
6900
7000
WOW in Comparison with AORD
WOW AORD
Share Price
AORD Index
Chart 4: WOW Price Comparison with AORD Index
5 | P a g e
7/29/2019
7/31/2019
8/2/2019
8/4/2019
8/6/2019
8/8/2019
8/10/2019
8/12/2019
8/14/2019
8/16/2019
8/18/2019
8/20/2019
8/22/2019
8/24/2019
8/26/2019
8/28/2019
36.5
37
37.5
38
38.5
39
39.5
40
40.5
6200
6300
6400
6500
6600
6700
6800
6900
7000
WES in Comparison with AORD
WES AORD
Share Price
aORD INDEX
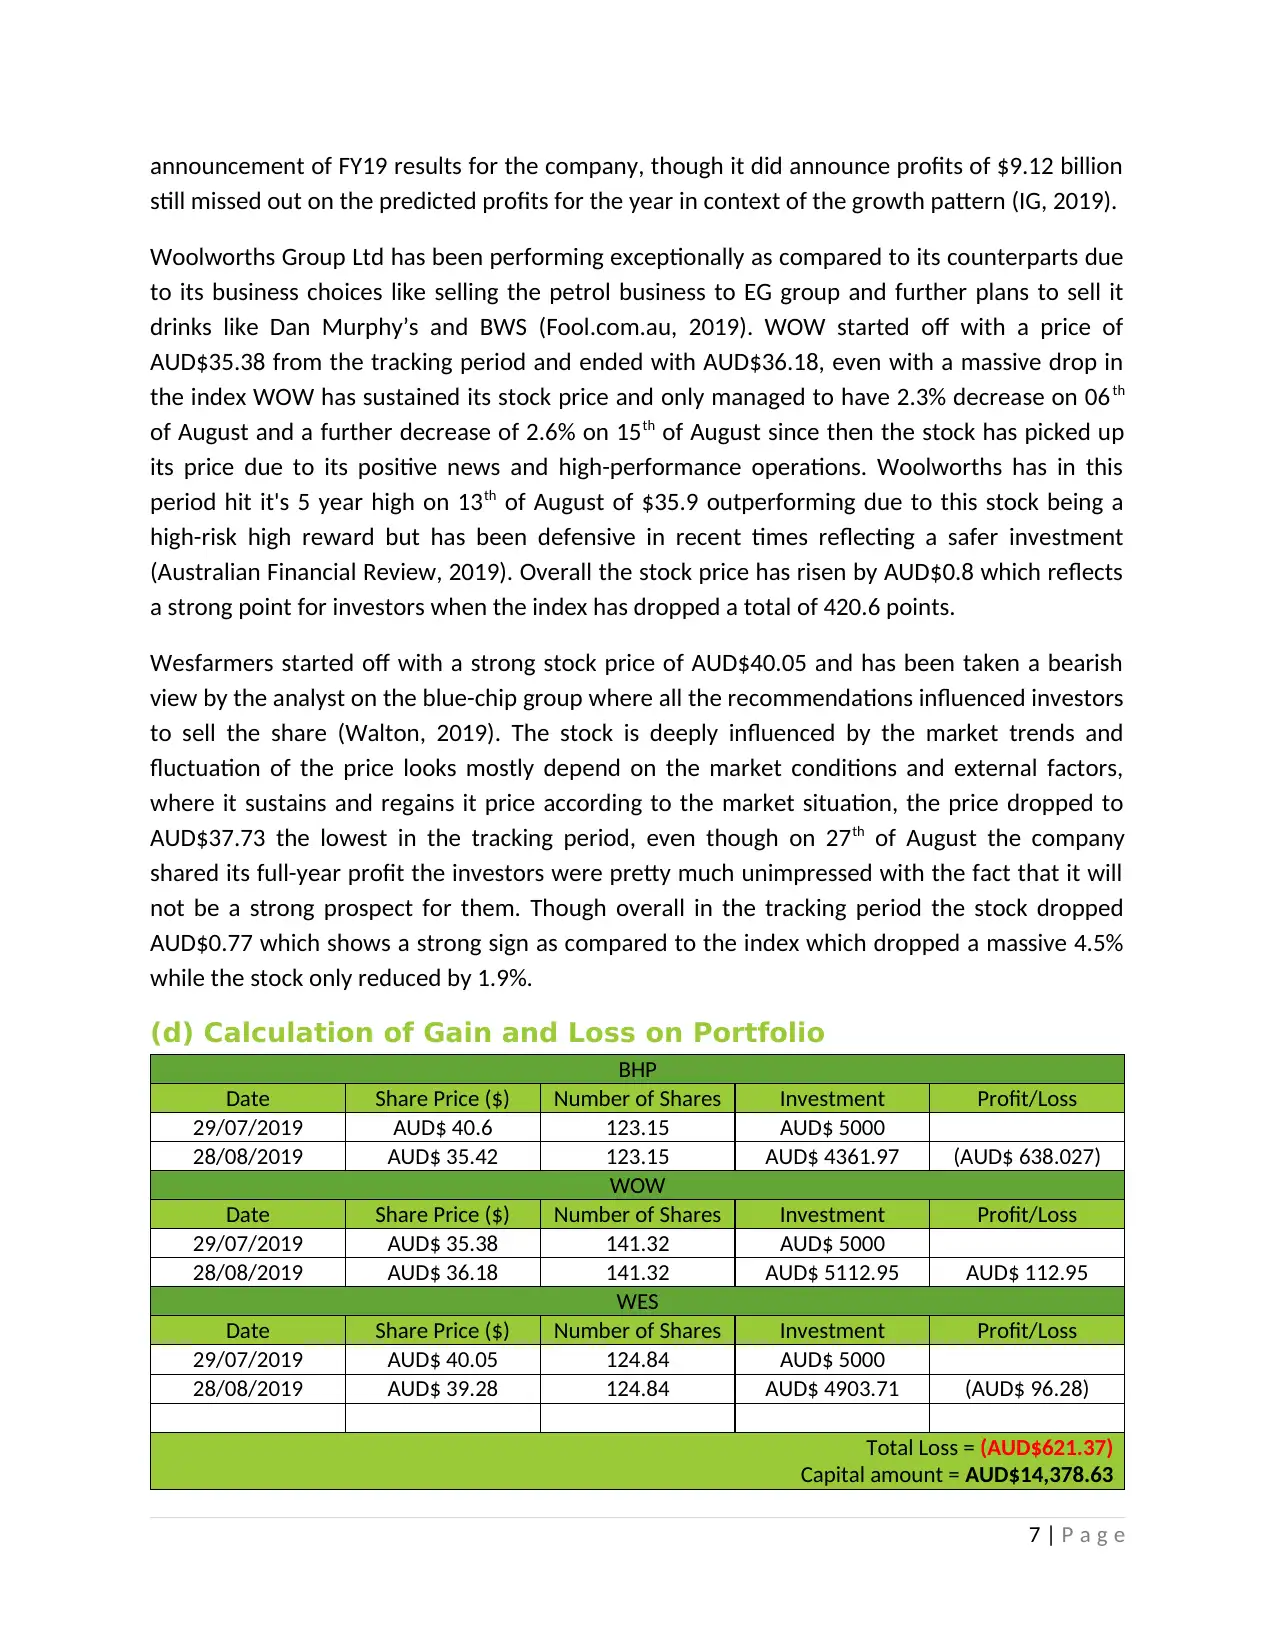
Chart 5: WES Price Comparison with AORD Index
(c) Overview of Share price Performance
In the tracking period, the index and share prices have been heavily affected due to the trade
war between China and the United States. The market is volatile from this global and domestic
risk where all sectors are being affected regardless of a direct impact. Australia is suffering in
this war due to the fact that the United States is its key strategic ally whereas, China is their
major trading partner. This war can lead towards a Global economic system rather than a US-
Centric Economic system which is in future benefits everyone globally. The Chinese are allowing
its currency to devalue to have the price tag on their goods at a cheaper rate, however, this
proves to be a big risk for Australia. This tug of war is between a political ally and economic
partner is proving to be a disaster for Australia and it's Stock Exchange (Butler, 2019).
BHP which has its roots embedded in the United States has been suffering in the stock market
due to this tug of war, on 29th July the stock closed on AUD$40.6 and was sustaining its price in
the upcoming days corrected itself after the index dropped 365 points till the 06th of August
bringing the price of BHP to AUD$37.1 reducing an overall AUD$3.5 in 6 days. There were
around $64bn wiped from the stock exchange by 15th of August when the market suffered an
all-time low in 18 months 6490.8, around 2.8% from the previous day and dropping a total of
420.6 points since the start of the tracking period (Farrer, 2019). BHP closed at AUD$35.42
dropping a total of AUD$5.18 in the tracking period which reflects around 12.75% drop in the
share price for the tracking period. The price of the stock was saved in the middle of the
tracking period due to an announcement of dividend but crashed again around 2.9% after the
6 | P a g e
7/31/2019
8/2/2019
8/4/2019
8/6/2019
8/8/2019
8/10/2019
8/12/2019
8/14/2019
8/16/2019
8/18/2019
8/20/2019
8/22/2019
8/24/2019
8/26/2019
8/28/2019
36.5
37
37.5
38
38.5
39
39.5
40
40.5
6200
6300
6400
6500
6600
6700
6800
6900
7000
WES in Comparison with AORD
WES AORD
Share Price
aORD INDEX
Chart 5: WES Price Comparison with AORD Index
(c) Overview of Share price Performance
In the tracking period, the index and share prices have been heavily affected due to the trade
war between China and the United States. The market is volatile from this global and domestic
risk where all sectors are being affected regardless of a direct impact. Australia is suffering in
this war due to the fact that the United States is its key strategic ally whereas, China is their
major trading partner. This war can lead towards a Global economic system rather than a US-
Centric Economic system which is in future benefits everyone globally. The Chinese are allowing
its currency to devalue to have the price tag on their goods at a cheaper rate, however, this
proves to be a big risk for Australia. This tug of war is between a political ally and economic
partner is proving to be a disaster for Australia and it's Stock Exchange (Butler, 2019).
BHP which has its roots embedded in the United States has been suffering in the stock market
due to this tug of war, on 29th July the stock closed on AUD$40.6 and was sustaining its price in
the upcoming days corrected itself after the index dropped 365 points till the 06th of August
bringing the price of BHP to AUD$37.1 reducing an overall AUD$3.5 in 6 days. There were
around $64bn wiped from the stock exchange by 15th of August when the market suffered an
all-time low in 18 months 6490.8, around 2.8% from the previous day and dropping a total of
420.6 points since the start of the tracking period (Farrer, 2019). BHP closed at AUD$35.42
dropping a total of AUD$5.18 in the tracking period which reflects around 12.75% drop in the
share price for the tracking period. The price of the stock was saved in the middle of the
tracking period due to an announcement of dividend but crashed again around 2.9% after the
6 | P a g e
⊘ This is a preview!⊘
Do you want full access?
Subscribe today to unlock all pages.
Trusted by 1+ million students worldwide
announcement of FY19 results for the company, though it did announce profits of $9.12 billion
still missed out on the predicted profits for the year in context of the growth pattern (IG, 2019).
Woolworths Group Ltd has been performing exceptionally as compared to its counterparts due
to its business choices like selling the petrol business to EG group and further plans to sell it
drinks like Dan Murphy’s and BWS (Fool.com.au, 2019). WOW started off with a price of
AUD$35.38 from the tracking period and ended with AUD$36.18, even with a massive drop in
the index WOW has sustained its stock price and only managed to have 2.3% decrease on 06th
of August and a further decrease of 2.6% on 15th of August since then the stock has picked up
its price due to its positive news and high-performance operations. Woolworths has in this
period hit it's 5 year high on 13th of August of $35.9 outperforming due to this stock being a
high-risk high reward but has been defensive in recent times reflecting a safer investment
(Australian Financial Review, 2019). Overall the stock price has risen by AUD$0.8 which reflects
a strong point for investors when the index has dropped a total of 420.6 points.
Wesfarmers started off with a strong stock price of AUD$40.05 and has been taken a bearish
view by the analyst on the blue-chip group where all the recommendations influenced investors
to sell the share (Walton, 2019). The stock is deeply influenced by the market trends and
fluctuation of the price looks mostly depend on the market conditions and external factors,
where it sustains and regains it price according to the market situation, the price dropped to
AUD$37.73 the lowest in the tracking period, even though on 27th of August the company
shared its full-year profit the investors were pretty much unimpressed with the fact that it will
not be a strong prospect for them. Though overall in the tracking period the stock dropped
AUD$0.77 which shows a strong sign as compared to the index which dropped a massive 4.5%
while the stock only reduced by 1.9%.
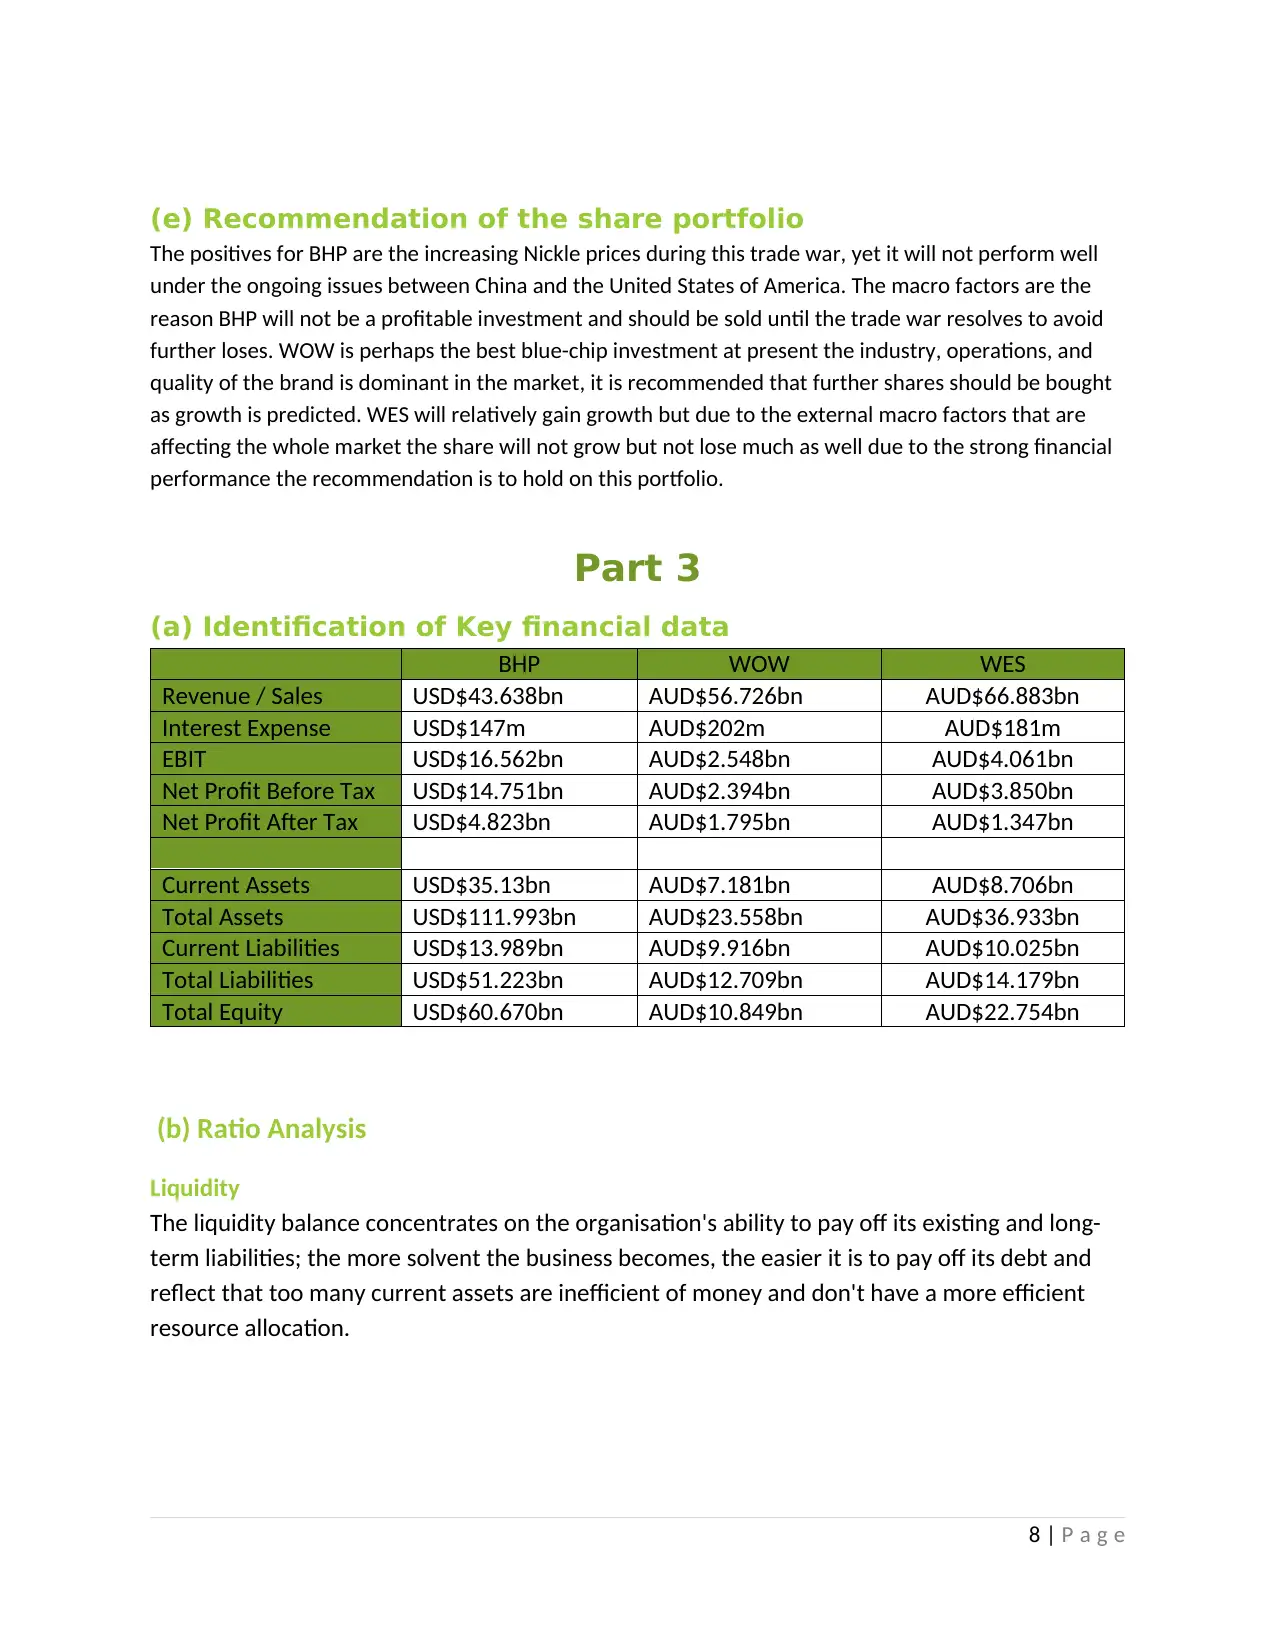
(d) Calculation of Gain and Loss on Portfolio
BHP
Date Share Price ($) Number of Shares Investment Profit/Loss
29/07/2019 AUD$ 40.6 123.15 AUD$ 5000
28/08/2019 AUD$ 35.42 123.15 AUD$ 4361.97 (AUD$ 638.027)
WOW
Date Share Price ($) Number of Shares Investment Profit/Loss
29/07/2019 AUD$ 35.38 141.32 AUD$ 5000
28/08/2019 AUD$ 36.18 141.32 AUD$ 5112.95 AUD$ 112.95
WES
Date Share Price ($) Number of Shares Investment Profit/Loss
29/07/2019 AUD$ 40.05 124.84 AUD$ 5000
28/08/2019 AUD$ 39.28 124.84 AUD$ 4903.71 (AUD$ 96.28)
Total Loss = (AUD$621.37)
Capital amount = AUD$14,378.63
7 | P a g e
still missed out on the predicted profits for the year in context of the growth pattern (IG, 2019).
Woolworths Group Ltd has been performing exceptionally as compared to its counterparts due
to its business choices like selling the petrol business to EG group and further plans to sell it
drinks like Dan Murphy’s and BWS (Fool.com.au, 2019). WOW started off with a price of
AUD$35.38 from the tracking period and ended with AUD$36.18, even with a massive drop in
the index WOW has sustained its stock price and only managed to have 2.3% decrease on 06th
of August and a further decrease of 2.6% on 15th of August since then the stock has picked up
its price due to its positive news and high-performance operations. Woolworths has in this
period hit it's 5 year high on 13th of August of $35.9 outperforming due to this stock being a
high-risk high reward but has been defensive in recent times reflecting a safer investment
(Australian Financial Review, 2019). Overall the stock price has risen by AUD$0.8 which reflects
a strong point for investors when the index has dropped a total of 420.6 points.
Wesfarmers started off with a strong stock price of AUD$40.05 and has been taken a bearish
view by the analyst on the blue-chip group where all the recommendations influenced investors
to sell the share (Walton, 2019). The stock is deeply influenced by the market trends and
fluctuation of the price looks mostly depend on the market conditions and external factors,
where it sustains and regains it price according to the market situation, the price dropped to
AUD$37.73 the lowest in the tracking period, even though on 27th of August the company
shared its full-year profit the investors were pretty much unimpressed with the fact that it will
not be a strong prospect for them. Though overall in the tracking period the stock dropped
AUD$0.77 which shows a strong sign as compared to the index which dropped a massive 4.5%
while the stock only reduced by 1.9%.
(d) Calculation of Gain and Loss on Portfolio
BHP
Date Share Price ($) Number of Shares Investment Profit/Loss
29/07/2019 AUD$ 40.6 123.15 AUD$ 5000
28/08/2019 AUD$ 35.42 123.15 AUD$ 4361.97 (AUD$ 638.027)
WOW
Date Share Price ($) Number of Shares Investment Profit/Loss
29/07/2019 AUD$ 35.38 141.32 AUD$ 5000
28/08/2019 AUD$ 36.18 141.32 AUD$ 5112.95 AUD$ 112.95
WES
Date Share Price ($) Number of Shares Investment Profit/Loss
29/07/2019 AUD$ 40.05 124.84 AUD$ 5000
28/08/2019 AUD$ 39.28 124.84 AUD$ 4903.71 (AUD$ 96.28)
Total Loss = (AUD$621.37)
Capital amount = AUD$14,378.63
7 | P a g e
Paraphrase This Document
Need a fresh take? Get an instant paraphrase of this document with our AI Paraphraser
(e) Recommendation of the share portfolio
The positives for BHP are the increasing Nickle prices during this trade war, yet it will not perform well
under the ongoing issues between China and the United States of America. The macro factors are the
reason BHP will not be a profitable investment and should be sold until the trade war resolves to avoid
further loses. WOW is perhaps the best blue-chip investment at present the industry, operations, and
quality of the brand is dominant in the market, it is recommended that further shares should be bought
as growth is predicted. WES will relatively gain growth but due to the external macro factors that are
affecting the whole market the share will not grow but not lose much as well due to the strong financial
performance the recommendation is to hold on this portfolio.
Part 3
(a) Identification of Key financial data
BHP WOW WES
Revenue / Sales USD$43.638bn AUD$56.726bn AUD$66.883bn
Interest Expense USD$147m AUD$202m AUD$181m
EBIT USD$16.562bn AUD$2.548bn AUD$4.061bn
Net Profit Before Tax USD$14.751bn AUD$2.394bn AUD$3.850bn
Net Profit After Tax USD$4.823bn AUD$1.795bn AUD$1.347bn
Current Assets USD$35.13bn AUD$7.181bn AUD$8.706bn
Total Assets USD$111.993bn AUD$23.558bn AUD$36.933bn
Current Liabilities USD$13.989bn AUD$9.916bn AUD$10.025bn
Total Liabilities USD$51.223bn AUD$12.709bn AUD$14.179bn
Total Equity USD$60.670bn AUD$10.849bn AUD$22.754bn
(b) Ratio Analysis
Liquidity
The liquidity balance concentrates on the organisation's ability to pay off its existing and long-
term liabilities; the more solvent the business becomes, the easier it is to pay off its debt and
reflect that too many current assets are inefficient of money and don't have a more efficient
resource allocation.
8 | P a g e
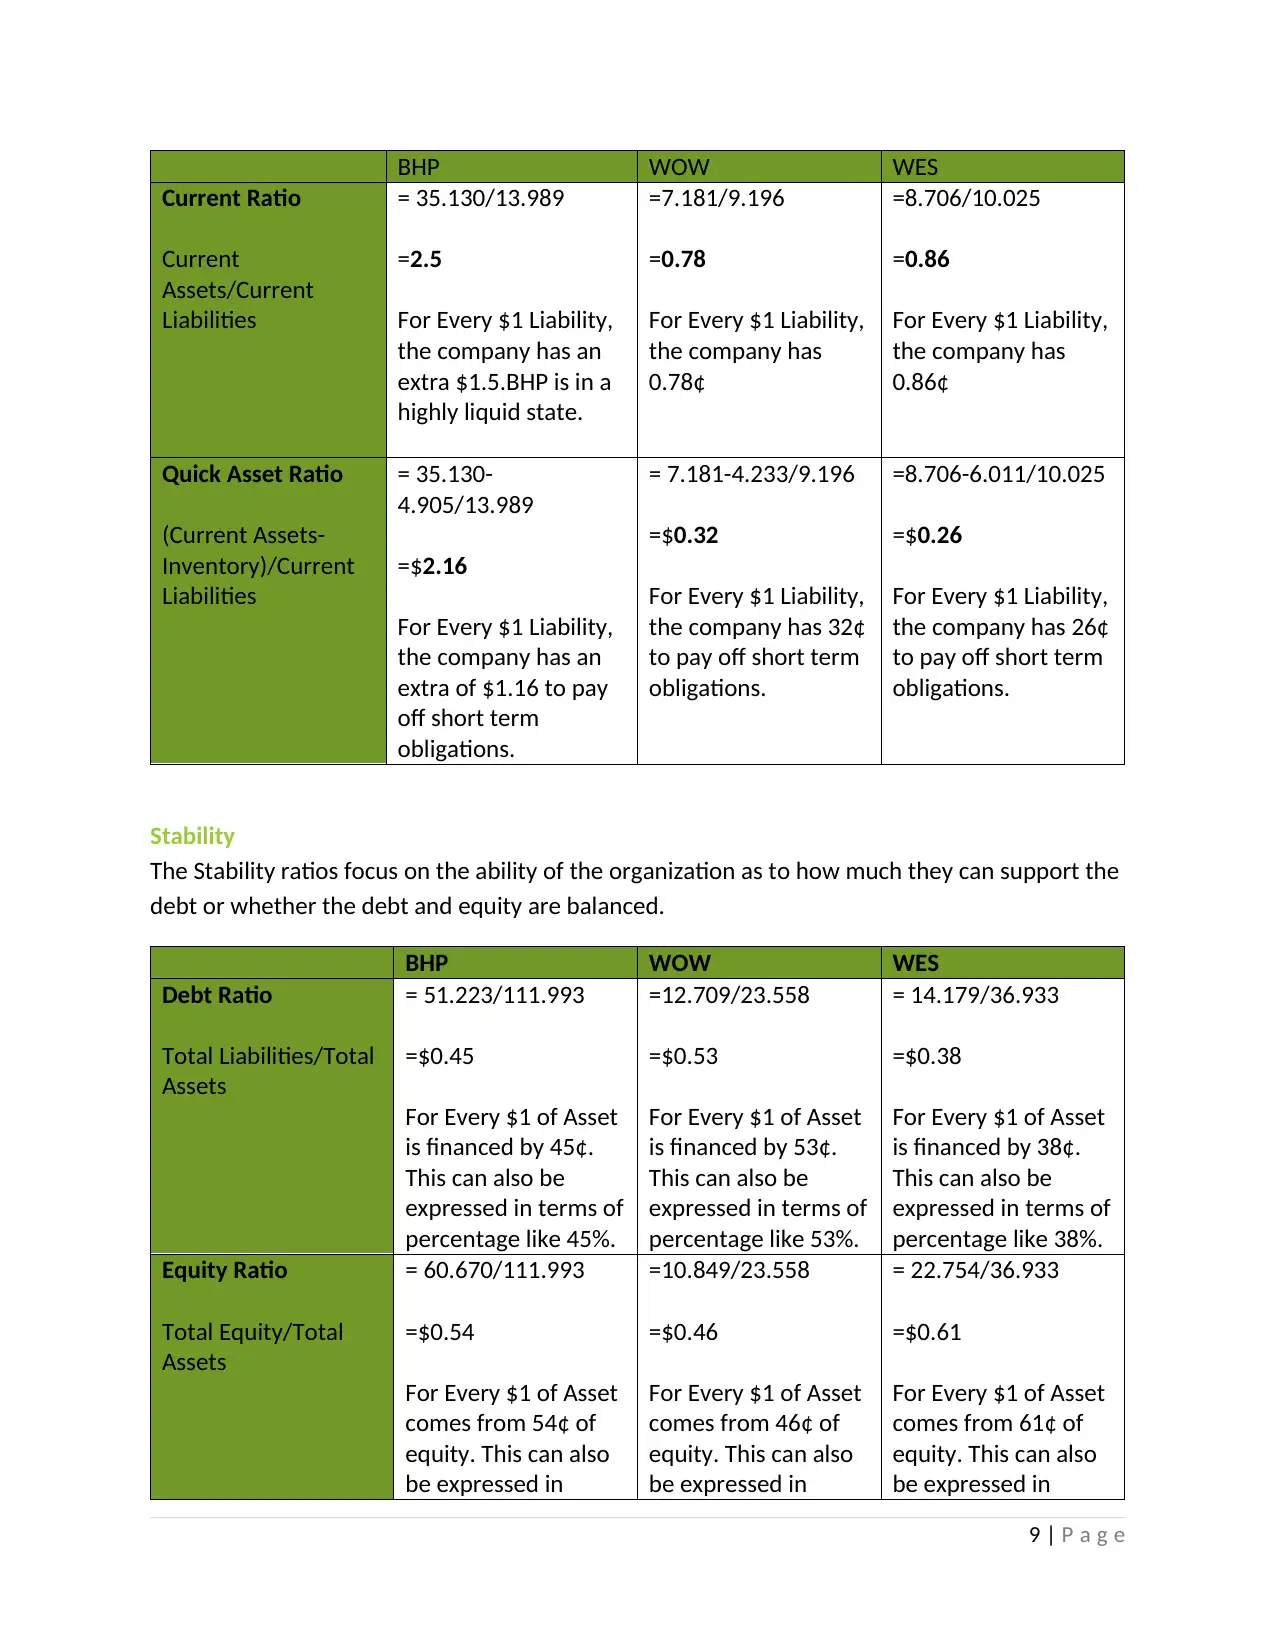
BHP WOW WES
Current Ratio
Current
Assets/Current
Liabilities
= 35.130/13.989
=2.5
For Every $1 Liability,
the company has an
extra $1.5.BHP is in a
highly liquid state.
=7.181/9.196
=0.78
For Every $1 Liability,
the company has
0.78¢
=8.706/10.025
=0.86
For Every $1 Liability,
the company has
0.86¢
Quick Asset Ratio
(Current Assets-
Inventory)/Current
Liabilities
= 35.130-
4.905/13.989
=$2.16
For Every $1 Liability,
the company has an
extra of $1.16 to pay
off short term
obligations.
= 7.181-4.233/9.196
=$0.32
For Every $1 Liability,
the company has 32¢
to pay off short term
obligations.
=8.706-6.011/10.025
=$0.26
For Every $1 Liability,
the company has 26¢
to pay off short term
obligations.
Stability
The Stability ratios focus on the ability of the organization as to how much they can support the
debt or whether the debt and equity are balanced.
BHP WOW WES
Debt Ratio
Total Liabilities/Total
Assets
= 51.223/111.993
=$0.45
For Every $1 of Asset
is financed by 45¢.
This can also be
expressed in terms of
percentage like 45%.
=12.709/23.558
=$0.53
For Every $1 of Asset
is financed by 53¢.
This can also be
expressed in terms of
percentage like 53%.
= 14.179/36.933
=$0.38
For Every $1 of Asset
is financed by 38¢.
This can also be
expressed in terms of
percentage like 38%.
Equity Ratio
Total Equity/Total
Assets
= 60.670/111.993
=$0.54
For Every $1 of Asset
comes from 54¢ of
equity. This can also
be expressed in
=10.849/23.558
=$0.46
For Every $1 of Asset
comes from 46¢ of
equity. This can also
be expressed in
= 22.754/36.933
=$0.61
For Every $1 of Asset
comes from 61¢ of
equity. This can also
be expressed in
9 | P a g e
⊘ This is a preview!⊘
Do you want full access?
Subscribe today to unlock all pages.
Trusted by 1+ million students worldwide
terms of percentage
like 54%.
terms of percentage
like 46%.
terms of percentage
like 61%.
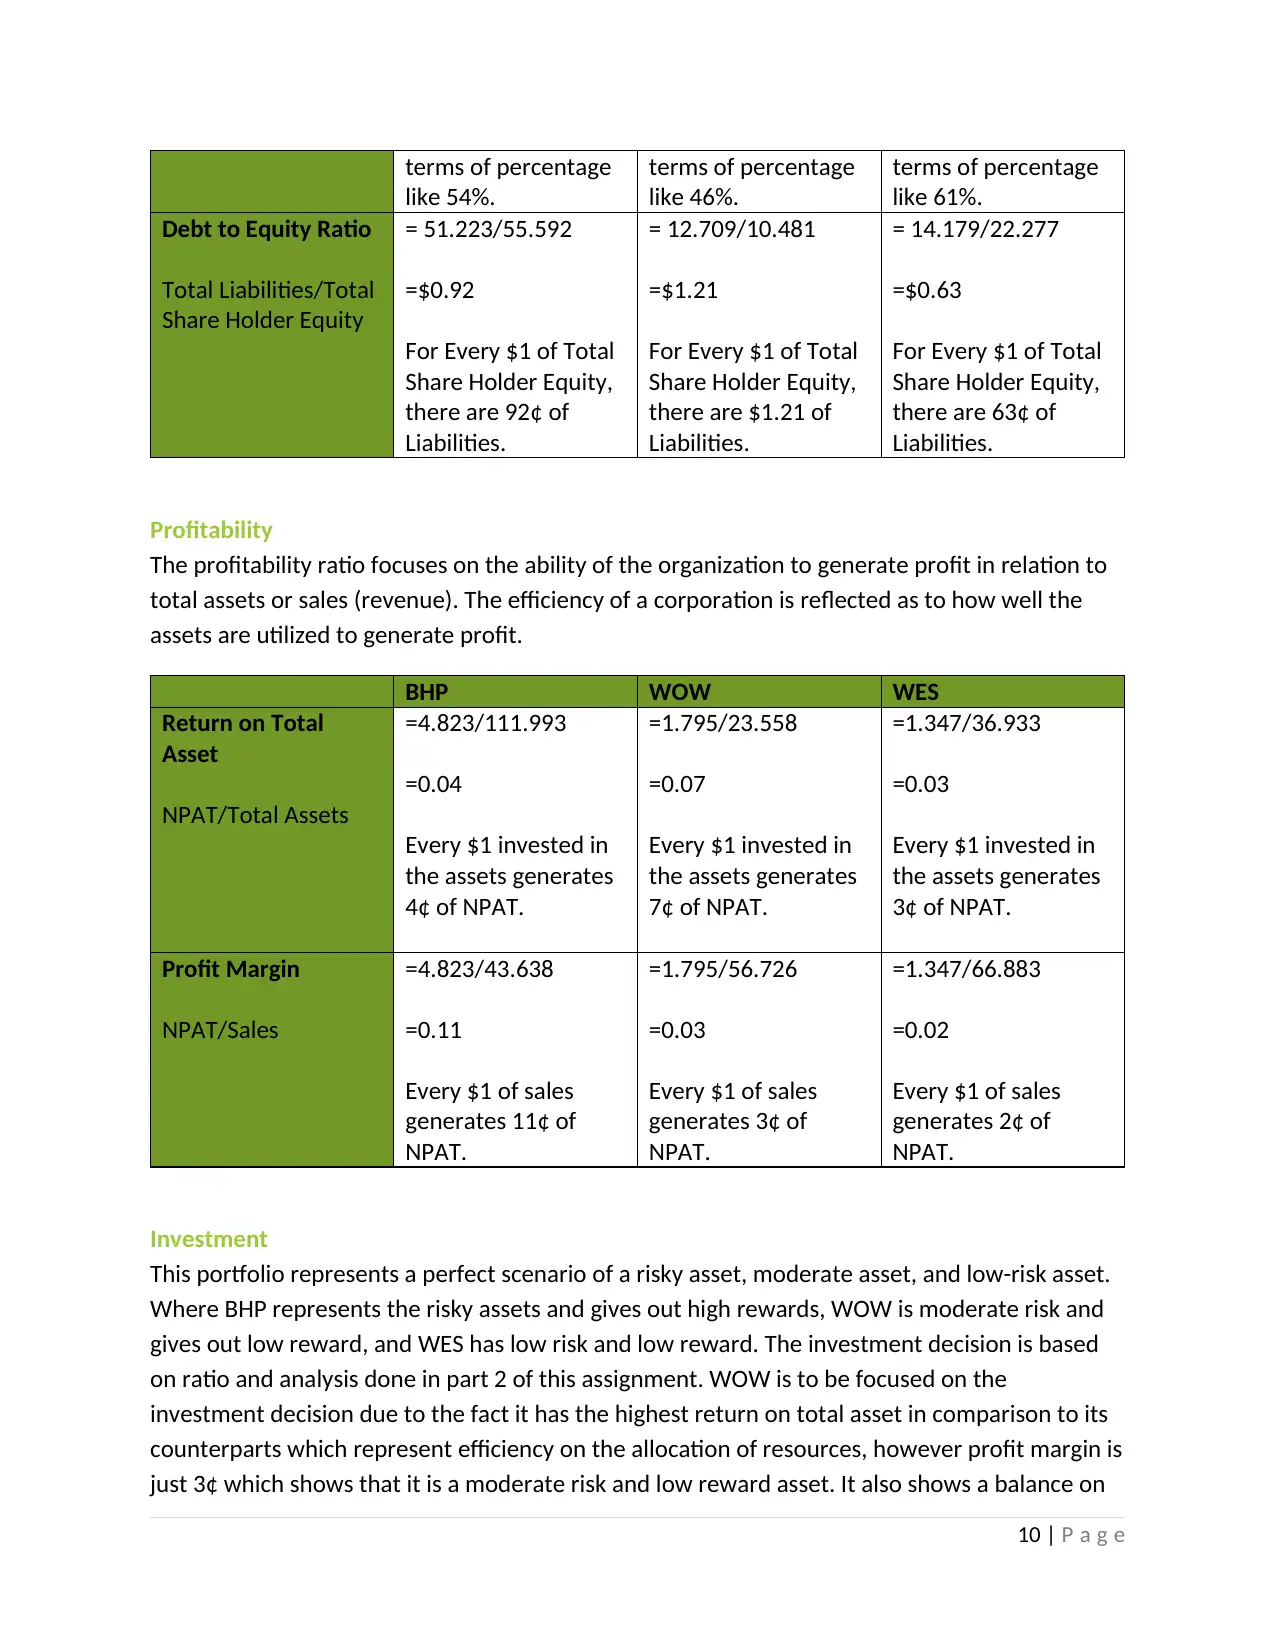
Debt to Equity Ratio
Total Liabilities/Total
Share Holder Equity
= 51.223/55.592
=$0.92
For Every $1 of Total
Share Holder Equity,
there are 92¢ of
Liabilities.
= 12.709/10.481
=$1.21
For Every $1 of Total
Share Holder Equity,
there are $1.21 of
Liabilities.
= 14.179/22.277
=$0.63
For Every $1 of Total
Share Holder Equity,
there are 63¢ of
Liabilities.
Profitability
The profitability ratio focuses on the ability of the organization to generate profit in relation to
total assets or sales (revenue). The efficiency of a corporation is reflected as to how well the
assets are utilized to generate profit.
BHP WOW WES
Return on Total
Asset
NPAT/Total Assets
=4.823/111.993
=0.04
Every $1 invested in
the assets generates
4¢ of NPAT.
=1.795/23.558
=0.07
Every $1 invested in
the assets generates
7¢ of NPAT.
=1.347/36.933
=0.03
Every $1 invested in
the assets generates
3¢ of NPAT.
Profit Margin
NPAT/Sales
=4.823/43.638
=0.11
Every $1 of sales
generates 11¢ of
NPAT.
=1.795/56.726
=0.03
Every $1 of sales
generates 3¢ of
NPAT.
=1.347/66.883
=0.02
Every $1 of sales
generates 2¢ of
NPAT.
Investment
This portfolio represents a perfect scenario of a risky asset, moderate asset, and low-risk asset.
Where BHP represents the risky assets and gives out high rewards, WOW is moderate risk and
gives out low reward, and WES has low risk and low reward. The investment decision is based
on ratio and analysis done in part 2 of this assignment. WOW is to be focused on the
investment decision due to the fact it has the highest return on total asset in comparison to its
counterparts which represent efficiency on the allocation of resources, however profit margin is
just 3¢ which shows that it is a moderate risk and low reward asset. It also shows a balance on
10 | P a g e
like 54%.
terms of percentage
like 46%.
terms of percentage
like 61%.
Debt to Equity Ratio
Total Liabilities/Total
Share Holder Equity
= 51.223/55.592
=$0.92
For Every $1 of Total
Share Holder Equity,
there are 92¢ of
Liabilities.
= 12.709/10.481
=$1.21
For Every $1 of Total
Share Holder Equity,
there are $1.21 of
Liabilities.
= 14.179/22.277
=$0.63
For Every $1 of Total
Share Holder Equity,
there are 63¢ of
Liabilities.
Profitability
The profitability ratio focuses on the ability of the organization to generate profit in relation to
total assets or sales (revenue). The efficiency of a corporation is reflected as to how well the
assets are utilized to generate profit.
BHP WOW WES
Return on Total
Asset
NPAT/Total Assets
=4.823/111.993
=0.04
Every $1 invested in
the assets generates
4¢ of NPAT.
=1.795/23.558
=0.07
Every $1 invested in
the assets generates
7¢ of NPAT.
=1.347/36.933
=0.03
Every $1 invested in
the assets generates
3¢ of NPAT.
Profit Margin
NPAT/Sales
=4.823/43.638
=0.11
Every $1 of sales
generates 11¢ of
NPAT.
=1.795/56.726
=0.03
Every $1 of sales
generates 3¢ of
NPAT.
=1.347/66.883
=0.02
Every $1 of sales
generates 2¢ of
NPAT.
Investment
This portfolio represents a perfect scenario of a risky asset, moderate asset, and low-risk asset.
Where BHP represents the risky assets and gives out high rewards, WOW is moderate risk and
gives out low reward, and WES has low risk and low reward. The investment decision is based
on ratio and analysis done in part 2 of this assignment. WOW is to be focused on the
investment decision due to the fact it has the highest return on total asset in comparison to its
counterparts which represent efficiency on the allocation of resources, however profit margin is
just 3¢ which shows that it is a moderate risk and low reward asset. It also shows a balance on
10 | P a g e
Paraphrase This Document
Need a fresh take? Get an instant paraphrase of this document with our AI Paraphraser
capital where 53% of its assets are financed and 46% of the assets come from the equity. In
terms of liabilities for every dollar of Share Holder Equity has $1.21 of liabilities which does not
represent a strong point for the company. However, the asset coverage is around 78% for the
liabilities and 32% short term liabilities can be paid off instantly. It is recommended to invest in
WOW due to the uncertain market conditions and other macro-economic factors which can
affect the investment.
11 | P a g e
References
Australian Financial Review. (2019). Woolworths class action to proceed as shares hit five-year
highs. [online] Available at: https://www.afr.com/companies/retail/woolworths-class-action-to-
proceed-as-shares-hit-five-year-highs-20190813-p52gn1 [Accessed 3 Sep. 2019].
Butler, B. (2019). Australian stock market down 2.4% as US-China trade war hits home. [online]
the Guardian. Available at: https://www.theguardian.com/australia-news/2019/aug/06/us-
china-trade-war-hits-australian-stock-market [Accessed 2 Sep. 2019].
Farrer, M. (2019). $60bn wiped from Australian stock market on worst day for ASX in 18
months. [online] the Guardian. Available at:
https://www.theguardian.com/australia-news/2019/aug/15/60bn-wiped-from-australian-
stock-market-on-worst-day-for-18-months [Accessed 2 Sep. 2019].
Fool.com.au. (2019). Is the Woolworths share price a buy? | Motley Fool Australia. [online]
Available at: https://www.fool.com.au/2019/07/23/is-the-woolworths-share-price-a-buy-12/
[Accessed 3 Sep. 2019].
IG. (2019). BHP shares down on FY19 earnings: $3.9 billion dividend declared. [online] Available
at: https://www.ig.com/au/news-and-trade-ideas/bhp-shares-mixed-on-fy19-results---3-9-
billion-dividend-revealed-190820 [Accessed 3 Sep. 2019].
Walton, S. (2019). Wesfarmers share price drops 2.25%: investors mixed on FY19 results.
[online] IG. Available at: https://www.ig.com/au/news-and-trade-ideas/wesfarmers-share-
price-drops-2-25--on-fy19-results-190827 [Accessed 3 Sep. 2019].
12 | P a g e
⊘ This is a preview!⊘
Do you want full access?
Subscribe today to unlock all pages.
Trusted by 1+ million students worldwide
1 out of 23


Your All-in-One AI-Powered Toolkit for Academic Success.
+13062052269
info@desklib.com
Available 24*7 on WhatsApp / Email
![[object Object]](/_next/static/media/star-bottom.7253800d.svg)
Unlock your academic potential
Copyright © 2020–2025 A2Z Services. All Rights Reserved. Developed and managed by ZUCOL.