Regression Analysis: Student Advocacy and Institutional Factors
VerifiedAdded on 2019/09/30
|21
|3567
|531
Report
AI Summary
The article discusses the regression analysis conducted to examine the factors influencing student advocacy in higher education institutions. The study found that social integration, reputation, satisfaction, customer orientation, and loyalty are significant predictors of student advocacy. A residual plot was used to test the equality of variances for residuals, which showed no evidence of unequal variance. The regression equation is: Student Advocacy = -0.8756 + 0.1013*social integration + 0.274*reputation + 0.575*satisfaction – 0.95*customer orientation + 0.299*loyalty. The model explained 70.3% of the variation in student advocacy, and all assumptions of regression analysis were satisfied.
Contribute Materials
Your contribution can guide someone’s learning journey. Share your
documents today.
Table of Contents
Introduction......................................................................................................................................2
Literature Review............................................................................................................................2
Discussion........................................................................................................................................2
Analysis........................................................................................................................................2
Assumptions.................................................................................................................................5
Conclusion.....................................................................................................................................10
Bibliography..................................................................................................................................11
Appendix........................................................................................................................................11
Secure Best Marks with AI Grader
Need help grading? Try our AI Grader for instant feedback on your assignments.
Introduction
Student Advocacy is predicted on the basis of Social Integration, Reputation, Satisfaction,
Customer Orientation, and Affective Loyalty. The statistical technique of Regression Analysis is
used to build a regression model. The four assumptions of regression analysis are tested for the
validity of the model. The four assumptions of regression analysis include no multi-co-linearity,
no autocorrelation, the normality of residuals, and homogeneity of error variance.
Literature Review
The researchers have been conducted in the past in order to test the student loyalty with the
behavioral factors. In our existing research, we are researching the relationship between student
advocacy and the other variables which are customer orientation, social integration, reputation,
satisfaction and effective loyalty.
One of such research is conducted by De Macedo Bergamo, F. V., Giuliani, A. C., Zambaldi, F.,
& Ponchio, M. C and research has been published in Brazilian Business Review. The research
done by De Macedo Bergamo, F. V., Giuliani, A. C., Zambaldi, F., & Ponchio, M. C was to
analyse relationship which exists between the ability of the students towards the education
institution with other variables. The key take away from the research was that the relationship
marketing was a critical factor in the creation and maintenance of relationships between the
students and educational institutions. Once the education institution is able to develop the
relationship marketing does educational institution were more likely to achieve the attention and
the loyalty of the students. The research also found that the customers which are students, in this
case, are loyal to the educational institutions based on the perceived quality of the Institutions,
emotional behavior of the Institutions and the trust and responsibility of educational institutions.
Results for the research
The key result which was identified from the research was that these students short the tendency
of being loyal towards their educational institutions. The multiple linear regressions was
conducted in the research and the following results were obtained. Importance of loyalty towards
higher education was analyzed through the research and its questionnaire. II result which was
obtained by the research was the student loyalty was dependent on several factors and perception
of these factors by the student is critical in shaping the student loyalty towards their educational
institutions. The third result which was obtained from the research was that the adjusted R
square of the multiple regression models was. 46 this shows that 46% of the variation in the
students' loyalty towards their educational institute can be explained through the variables like
satisfaction, emotional commitment, perceived quality and trust. From the result, it was
concluded in the research that the students are inclined towards the loyalty status if there is
situation act on several constructs which are presented as the predecessors.
IV result which was obtained from the research was that the perceived quality was the most
important factor which saves the students loyalty towards its educational institution. The variable
perceived quality did not only have an effect on the loyalty of the students towards the
educational institution but it also has a reasonable influence over other loyalty variables like
emotional commitment and trust. v result which was obtained through the research conducted
by de Macedo Bergamo, F. V., Giuliani, A. C., Zambaldi, F., & Ponchio, M. C was that the
quality of the services provided by the educational institutions cannot be determined only by
reference and Standards it is also determined by the perception of the students about the
importance of the quality. Therefore the educational institutions must try to increase the
perceived quality of their students by taking into account both intangible and tangible aspects.
Vi result of the research conducted by de Macedo Bergamo, F. V., Giuliani, A. C., Zambaldi, F.,
& Ponchio, M. C showed that II most critical variable which affects the student loyalty is
satisfaction. It has been identified that satisfaction has a significant effect on the student loyalty
Paraphrase This Document
Need a fresh take? Get an instant paraphrase of this document with our AI Paraphraser
and is extremely important for maintaining the relationship. VII result indicates that the third
most powerful variable which has an effect on student loyalty is emotional commitment. It has
been observed that is emotional commitment is highly dependent on the integration of student
into the academic system and his personal activities into the social system. However, there was a
negative influence which was deducted why students commitment to the other activities.
Finally, it can be concluded from the research that students which are customers for the
educational institution are loyal to their educational institutions based on the independent
variables like perceived quality, satisfaction emotional commitment and the trust.
II research is conducted by Brown, R. M., & Mazzarol, T. W, in order to identify drivers of the
student satisfaction and his loyalty towards higher education. In the research conducted
by Brown, R. M., & Mazzarol, T. W. Sample was taken from the soil in universities of four
different categories. The findings of the research suggested that the loyalty of the student
towards the university is dependent on student satisfaction and student satisfaction is dependent
on the perceived image of the host educational institution. The perceived image of the
educational institution is dependent on the perceived hardware which is in the education
Institution and perceived human resources which support the educational institution. Therefore
the perceived quality of the educational institution was majorly dependent on the infrastructure
and tangible intangible elements provided by the educational institutions. Although the perceived
image of the educational institution is dependent on the perceived hardware and perceived
human resource but the relationship is weak and indeterminate. The partial least square method
was used by Brown, R. M., & Mazzarol, T. W in their research.
Third research is conducted by Helen, W. S. M., this research identifies applicability of the
existing relationship marketing concept in this self-financed educational industry. The research
investigated the relationship between student loyalty and relationship commitment and the key
parameters which affect the relationship commitments. It was observed from the research that the
relationship commitment was the most significant factors which affect the student loyalty. Other
factors which have a positive significant impact on the student loyalty work relationship benefits
from shared values and relationship termination cost. However, the trust factor did not have a
significant impact on the relationship commitment in self-financed educational industry.
As a part of our literature review we have analyzed three researchers the common outcome
which has been obtained from all these three researchers is that the perceived quality plays an
important role in determining the student loyalty towards the Educational Institutes.
Discussion
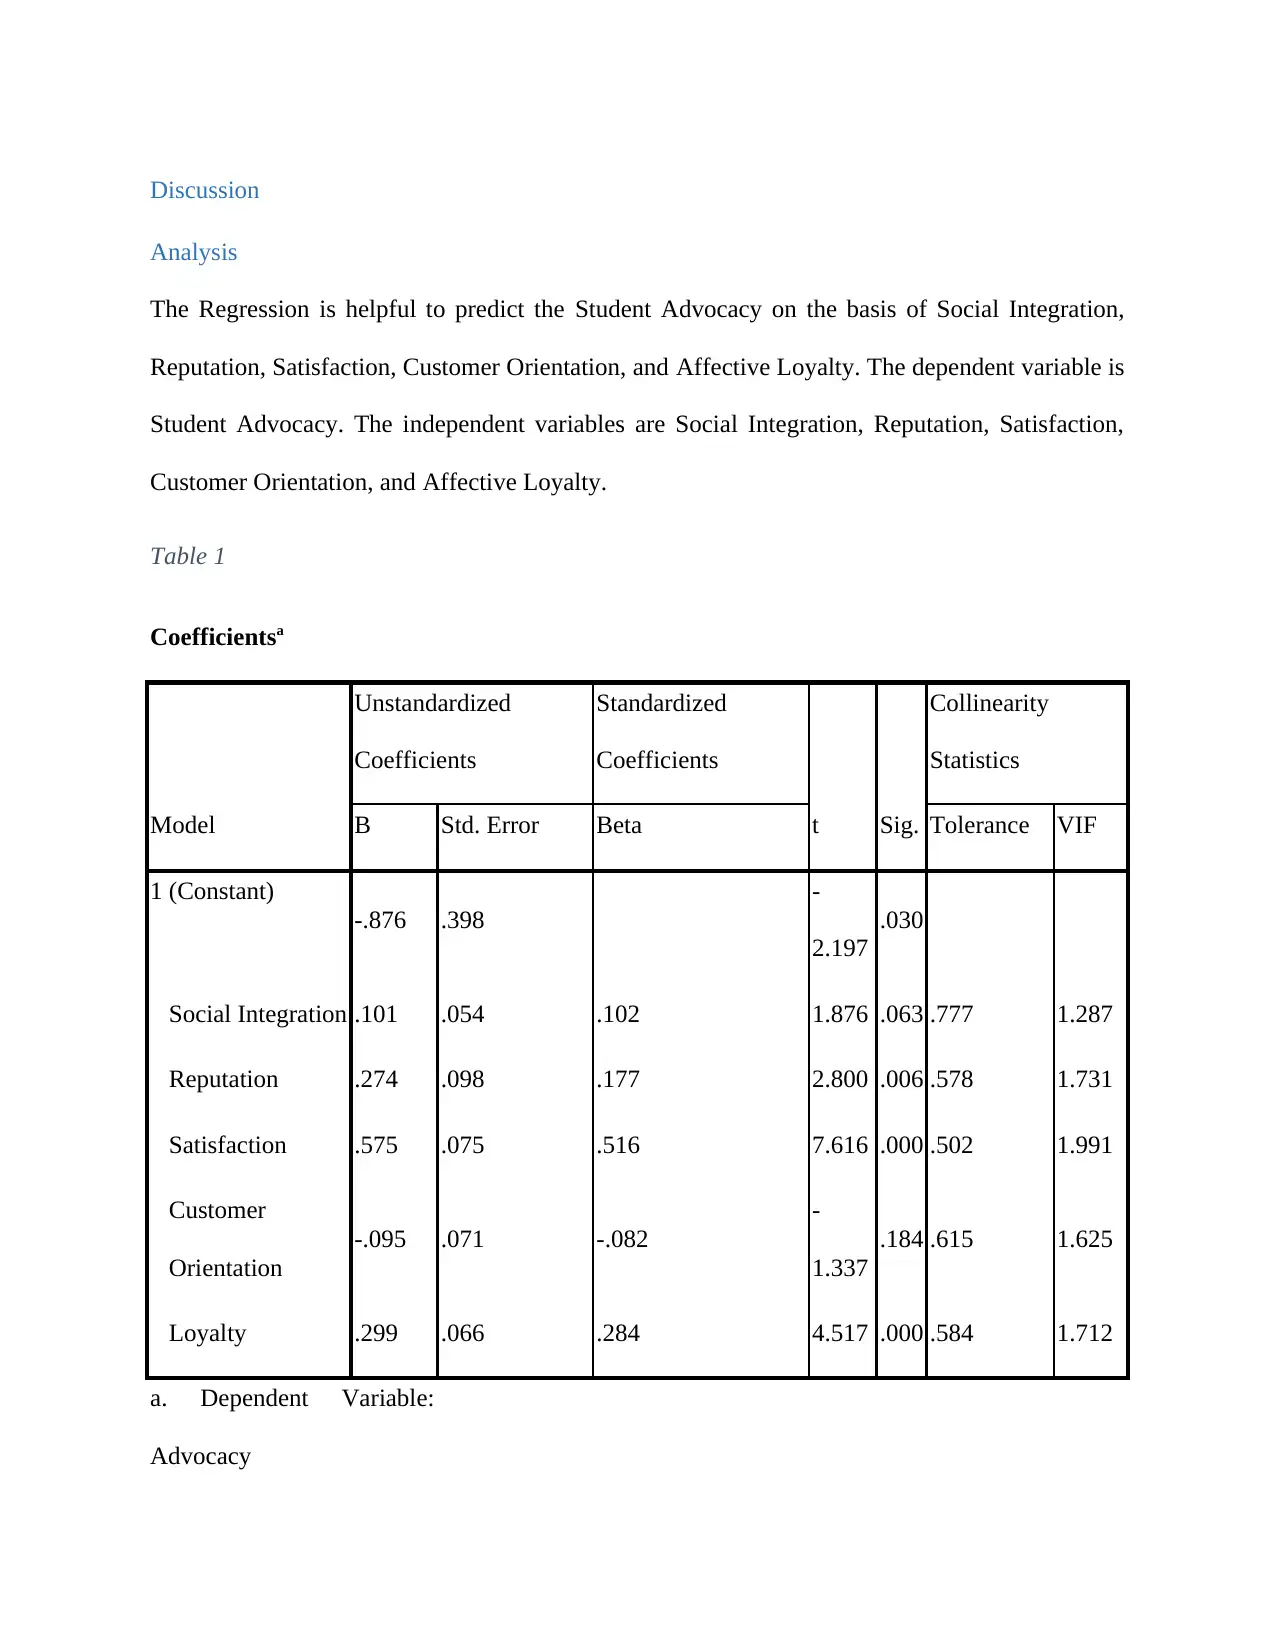
Analysis
The Regression is helpful to predict the Student Advocacy on the basis of Social Integration,
Reputation, Satisfaction, Customer Orientation, and Affective Loyalty. The dependent variable is
Student Advocacy. The independent variables are Social Integration, Reputation, Satisfaction,
Customer Orientation, and Affective Loyalty.
Table 1
Coefficientsa
Model
Unstandardized
Coefficients
Standardized
Coefficients
t Sig.
Collinearity
Statistics
B Std. Error Beta Tolerance VIF
1 (Constant)
-.876 .398
-
2.197
.030
Social Integration .101 .054 .102 1.876 .063 .777 1.287
Reputation .274 .098 .177 2.800 .006 .578 1.731
Satisfaction .575 .075 .516 7.616 .000 .502 1.991
Customer
Orientation
-.095 .071 -.082
-
1.337
.184 .615 1.625
Loyalty .299 .066 .284 4.517 .000 .584 1.712
a. Dependent Variable:
Advocacy
Secure Best Marks with AI Grader
Need help grading? Try our AI Grader for instant feedback on your assignments.
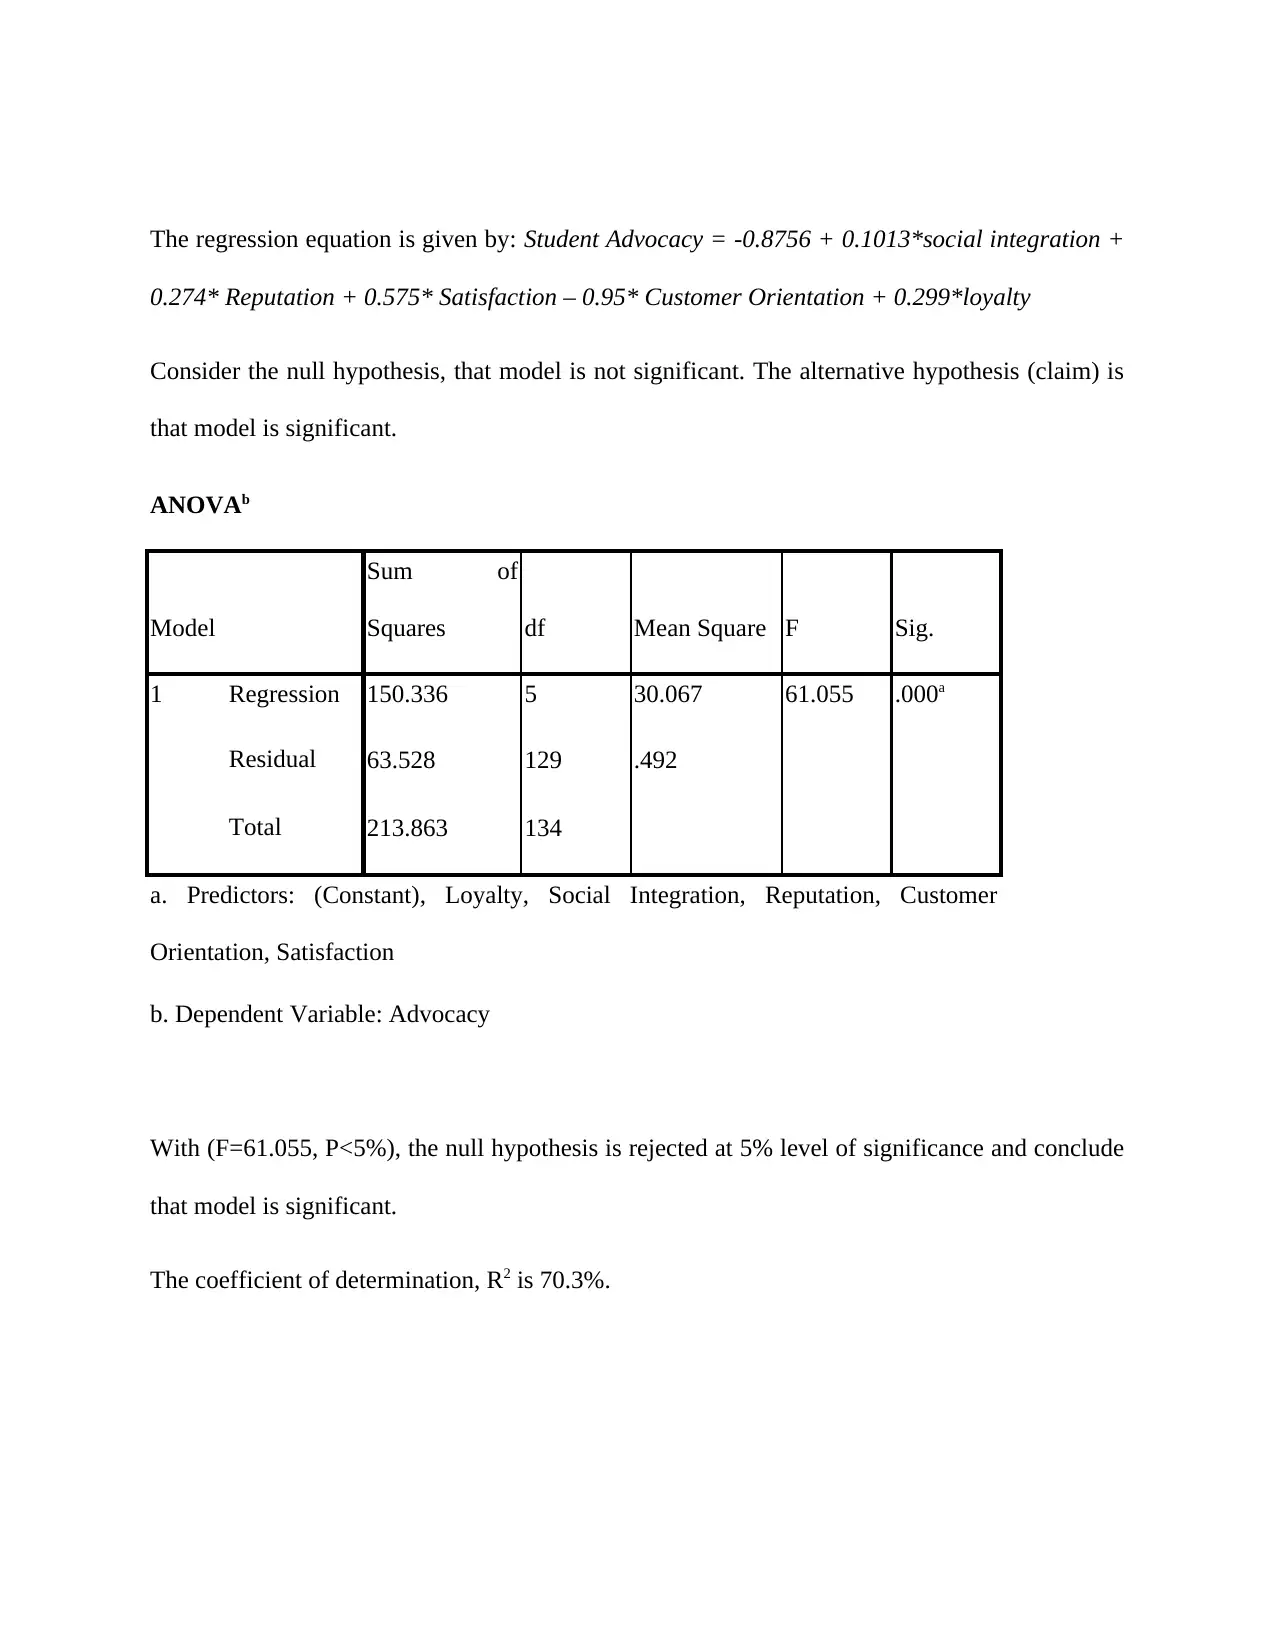
The regression equation is given by: Student Advocacy = -0.8756 + 0.1013*social integration +
0.274* Reputation + 0.575* Satisfaction – 0.95* Customer Orientation + 0.299*loyalty
Consider the null hypothesis, that model is not significant. The alternative hypothesis (claim) is
that model is significant.
ANOVAb
Model
Sum of
Squares df Mean Square F Sig.
1 Regression 150.336 5 30.067 61.055 .000a
Residual 63.528 129 .492
Total 213.863 134
a. Predictors: (Constant), Loyalty, Social Integration, Reputation, Customer
Orientation, Satisfaction
b. Dependent Variable: Advocacy
With (F=61.055, P<5%), the null hypothesis is rejected at 5% level of significance and conclude
that model is significant.
The coefficient of determination, R2 is 70.3%.
Model Summaryb
Model R R Square
Adjusted R
Square
Std. Error of
the Estimate
Durbin-
Watson
1 .838a .703 .691 .70176 2.029
a. Predictors: (Constant), Loyalty, Social Integration, Reputation, Customer
Orientation, Satisfaction
b. Dependent Variable: Advocacy
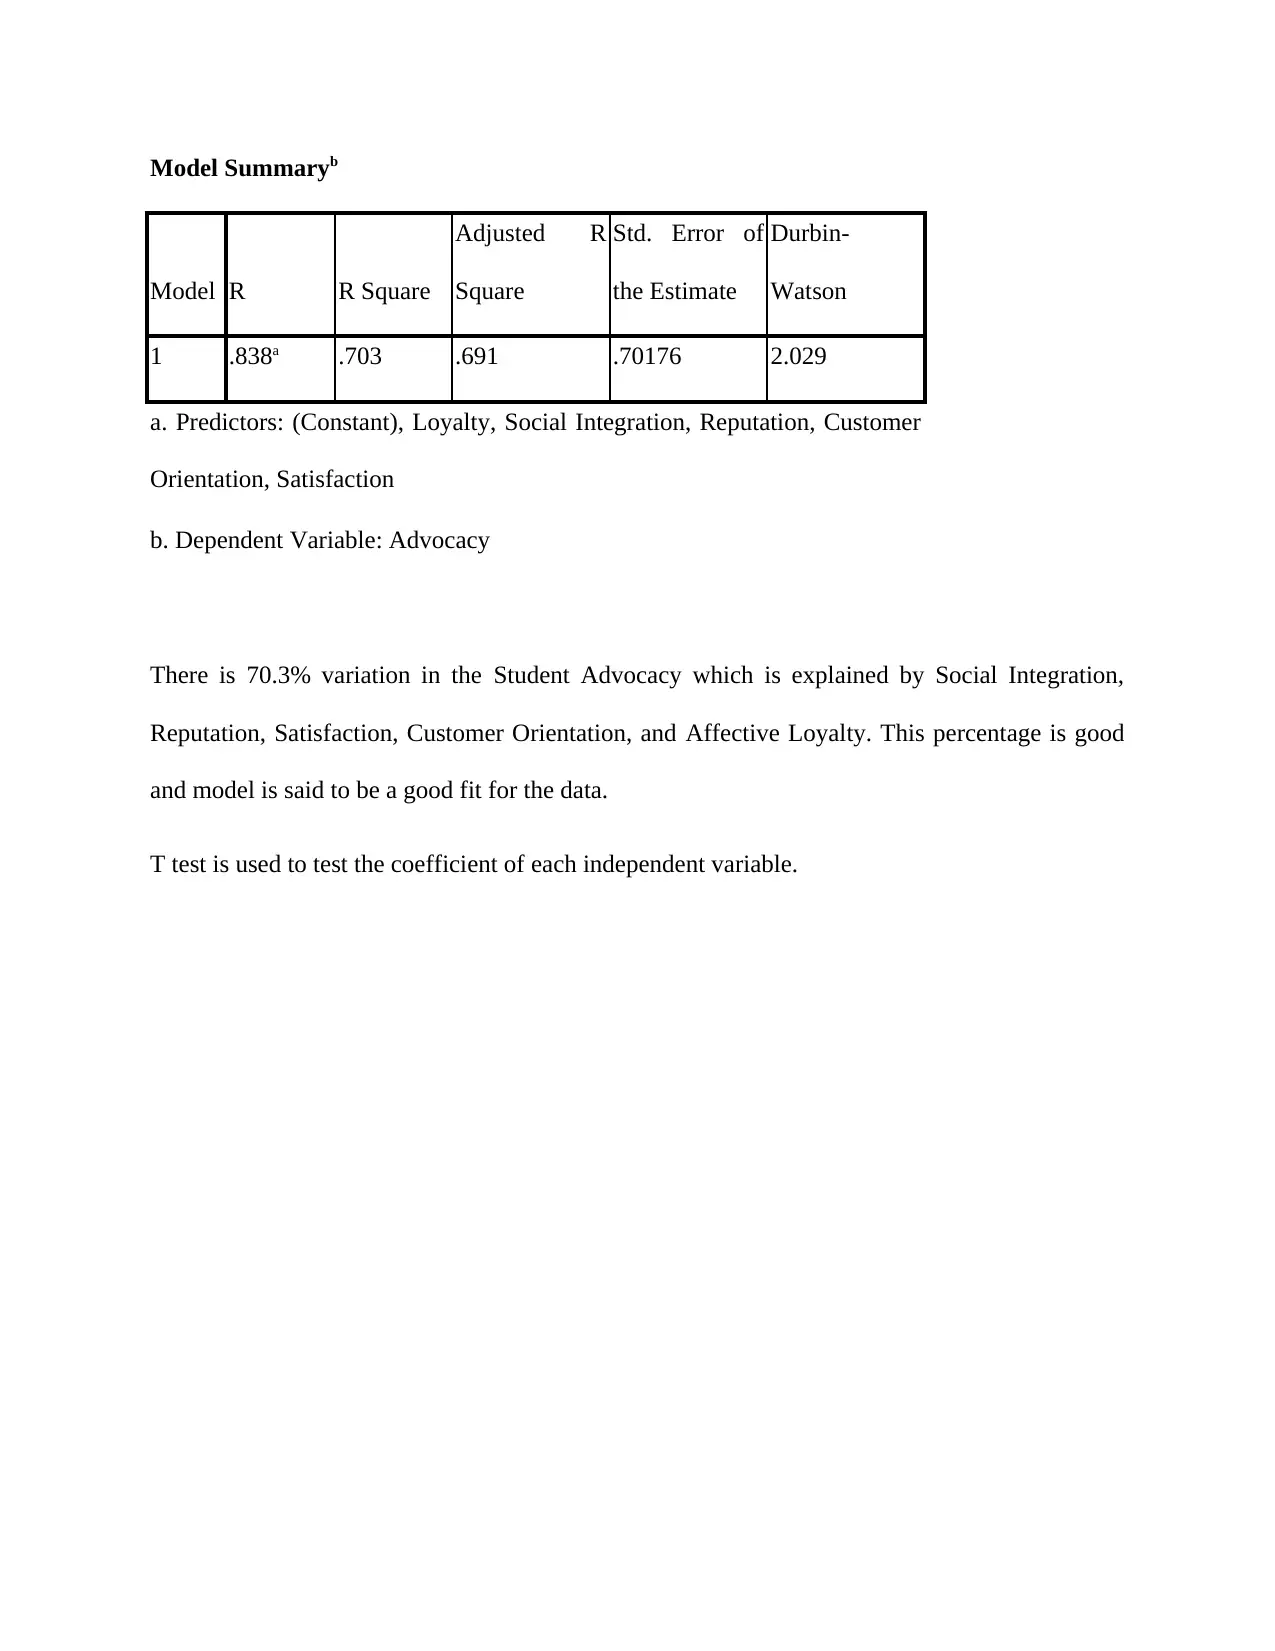
There is 70.3% variation in the Student Advocacy which is explained by Social Integration,
Reputation, Satisfaction, Customer Orientation, and Affective Loyalty. This percentage is good
and model is said to be a good fit for the data.
T test is used to test the coefficient of each independent variable.
Model R R Square
Adjusted R
Square
Std. Error of
the Estimate
Durbin-
Watson
1 .838a .703 .691 .70176 2.029
a. Predictors: (Constant), Loyalty, Social Integration, Reputation, Customer
Orientation, Satisfaction
b. Dependent Variable: Advocacy
There is 70.3% variation in the Student Advocacy which is explained by Social Integration,
Reputation, Satisfaction, Customer Orientation, and Affective Loyalty. This percentage is good
and model is said to be a good fit for the data.
T test is used to test the coefficient of each independent variable.
Coefficientsa
Model
Unstandardized
Coefficients
Standardized
Coefficients
t Sig.
Collinearity
Statistics
B Std. Error Beta Tolerance VIF
1 (Constant)
-.876 .398
-
2.197
.030
Social Integration .101 .054 .102 1.876 .063 .777 1.287
Reputation .274 .098 .177 2.800 .006 .578 1.731
Satisfaction .575 .075 .516 7.616 .000 .502 1.991
Customer
Orientation
-.095 .071 -.082
-
1.337
.184 .615 1.625
Loyalty .299 .066 .284 4.517 .000 .584 1.712
a. Dependent Variable:
Advocacy
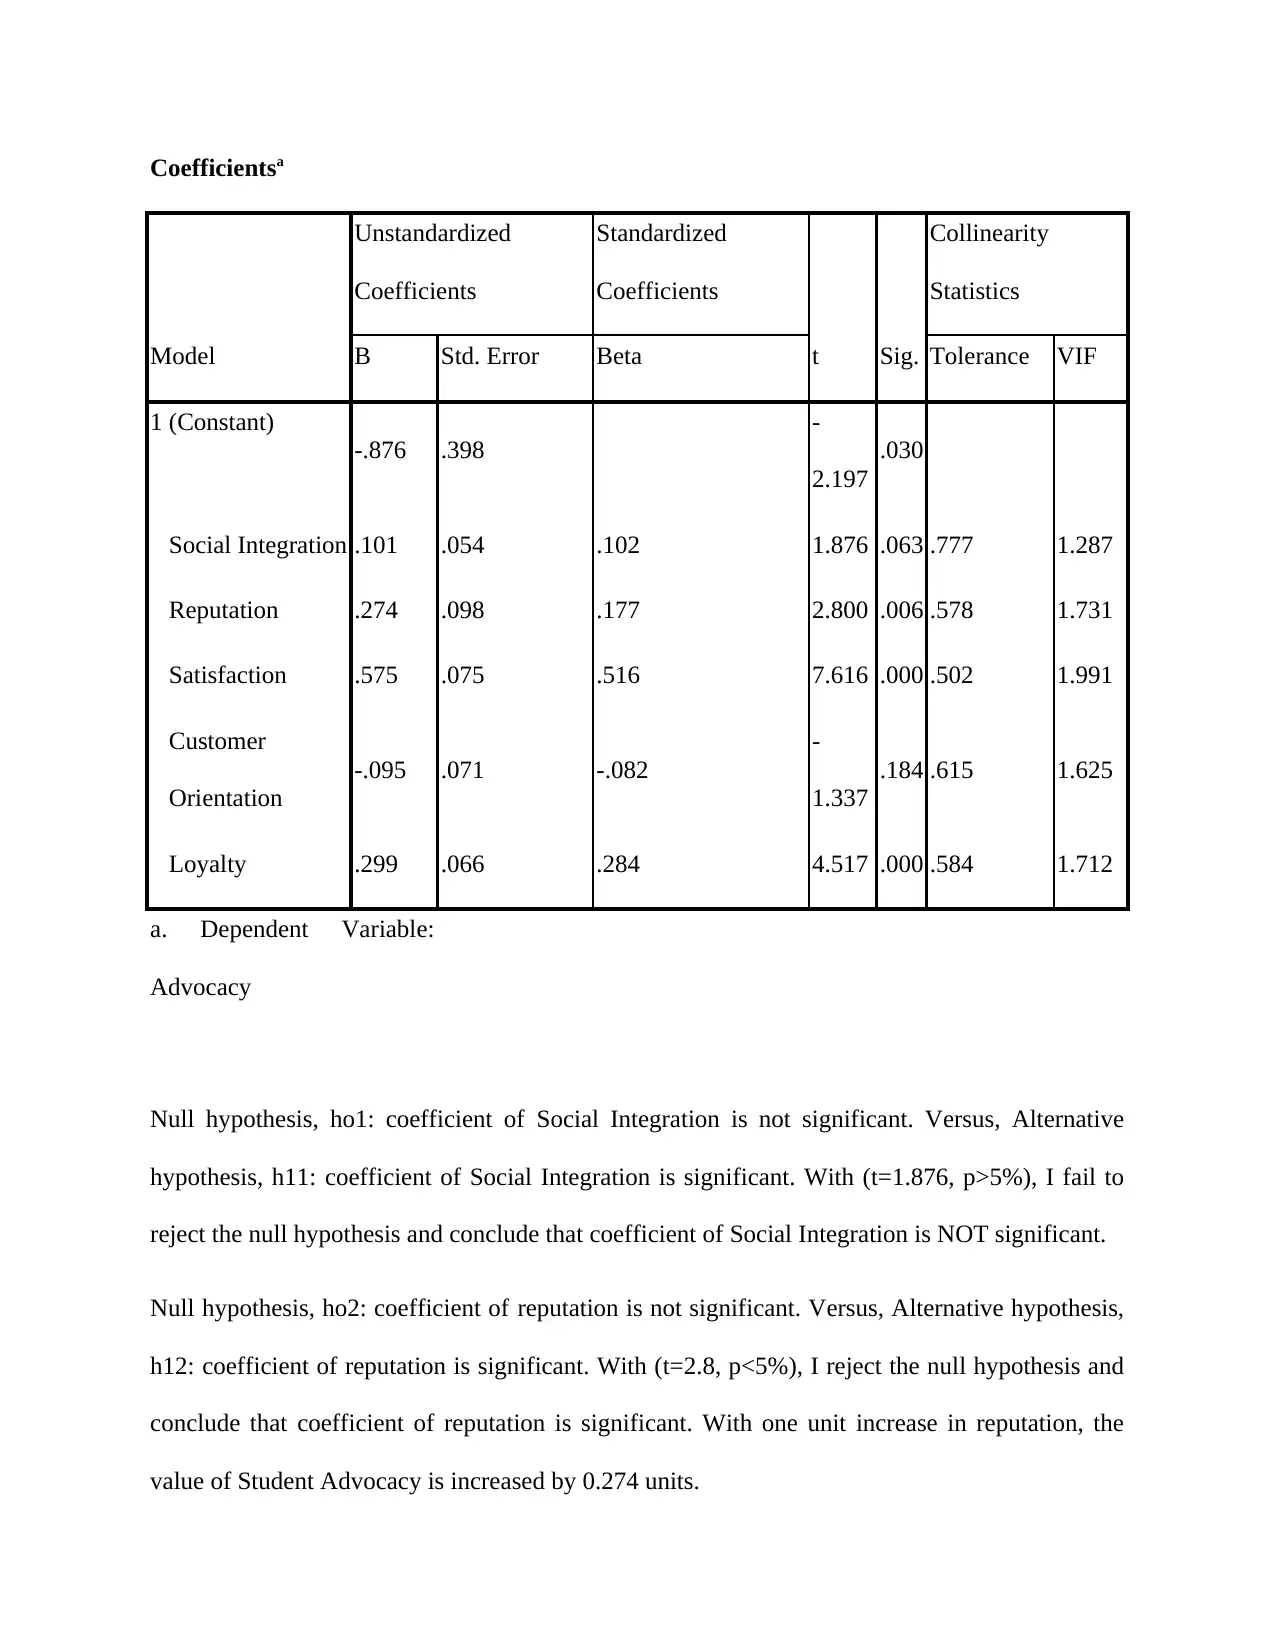
Null hypothesis, ho1: coefficient of Social Integration is not significant. Versus, Alternative
hypothesis, h11: coefficient of Social Integration is significant. With (t=1.876, p>5%), I fail to
reject the null hypothesis and conclude that coefficient of Social Integration is NOT significant.
Null hypothesis, ho2: coefficient of reputation is not significant. Versus, Alternative hypothesis,
h12: coefficient of reputation is significant. With (t=2.8, p<5%), I reject the null hypothesis and
conclude that coefficient of reputation is significant. With one unit increase in reputation, the
value of Student Advocacy is increased by 0.274 units.
Model
Unstandardized
Coefficients
Standardized
Coefficients
t Sig.
Collinearity
Statistics
B Std. Error Beta Tolerance VIF
1 (Constant)
-.876 .398
-
2.197
.030
Social Integration .101 .054 .102 1.876 .063 .777 1.287
Reputation .274 .098 .177 2.800 .006 .578 1.731
Satisfaction .575 .075 .516 7.616 .000 .502 1.991
Customer
Orientation
-.095 .071 -.082
-
1.337
.184 .615 1.625
Loyalty .299 .066 .284 4.517 .000 .584 1.712
a. Dependent Variable:
Advocacy
Null hypothesis, ho1: coefficient of Social Integration is not significant. Versus, Alternative
hypothesis, h11: coefficient of Social Integration is significant. With (t=1.876, p>5%), I fail to
reject the null hypothesis and conclude that coefficient of Social Integration is NOT significant.
Null hypothesis, ho2: coefficient of reputation is not significant. Versus, Alternative hypothesis,
h12: coefficient of reputation is significant. With (t=2.8, p<5%), I reject the null hypothesis and
conclude that coefficient of reputation is significant. With one unit increase in reputation, the
value of Student Advocacy is increased by 0.274 units.
Paraphrase This Document
Need a fresh take? Get an instant paraphrase of this document with our AI Paraphraser
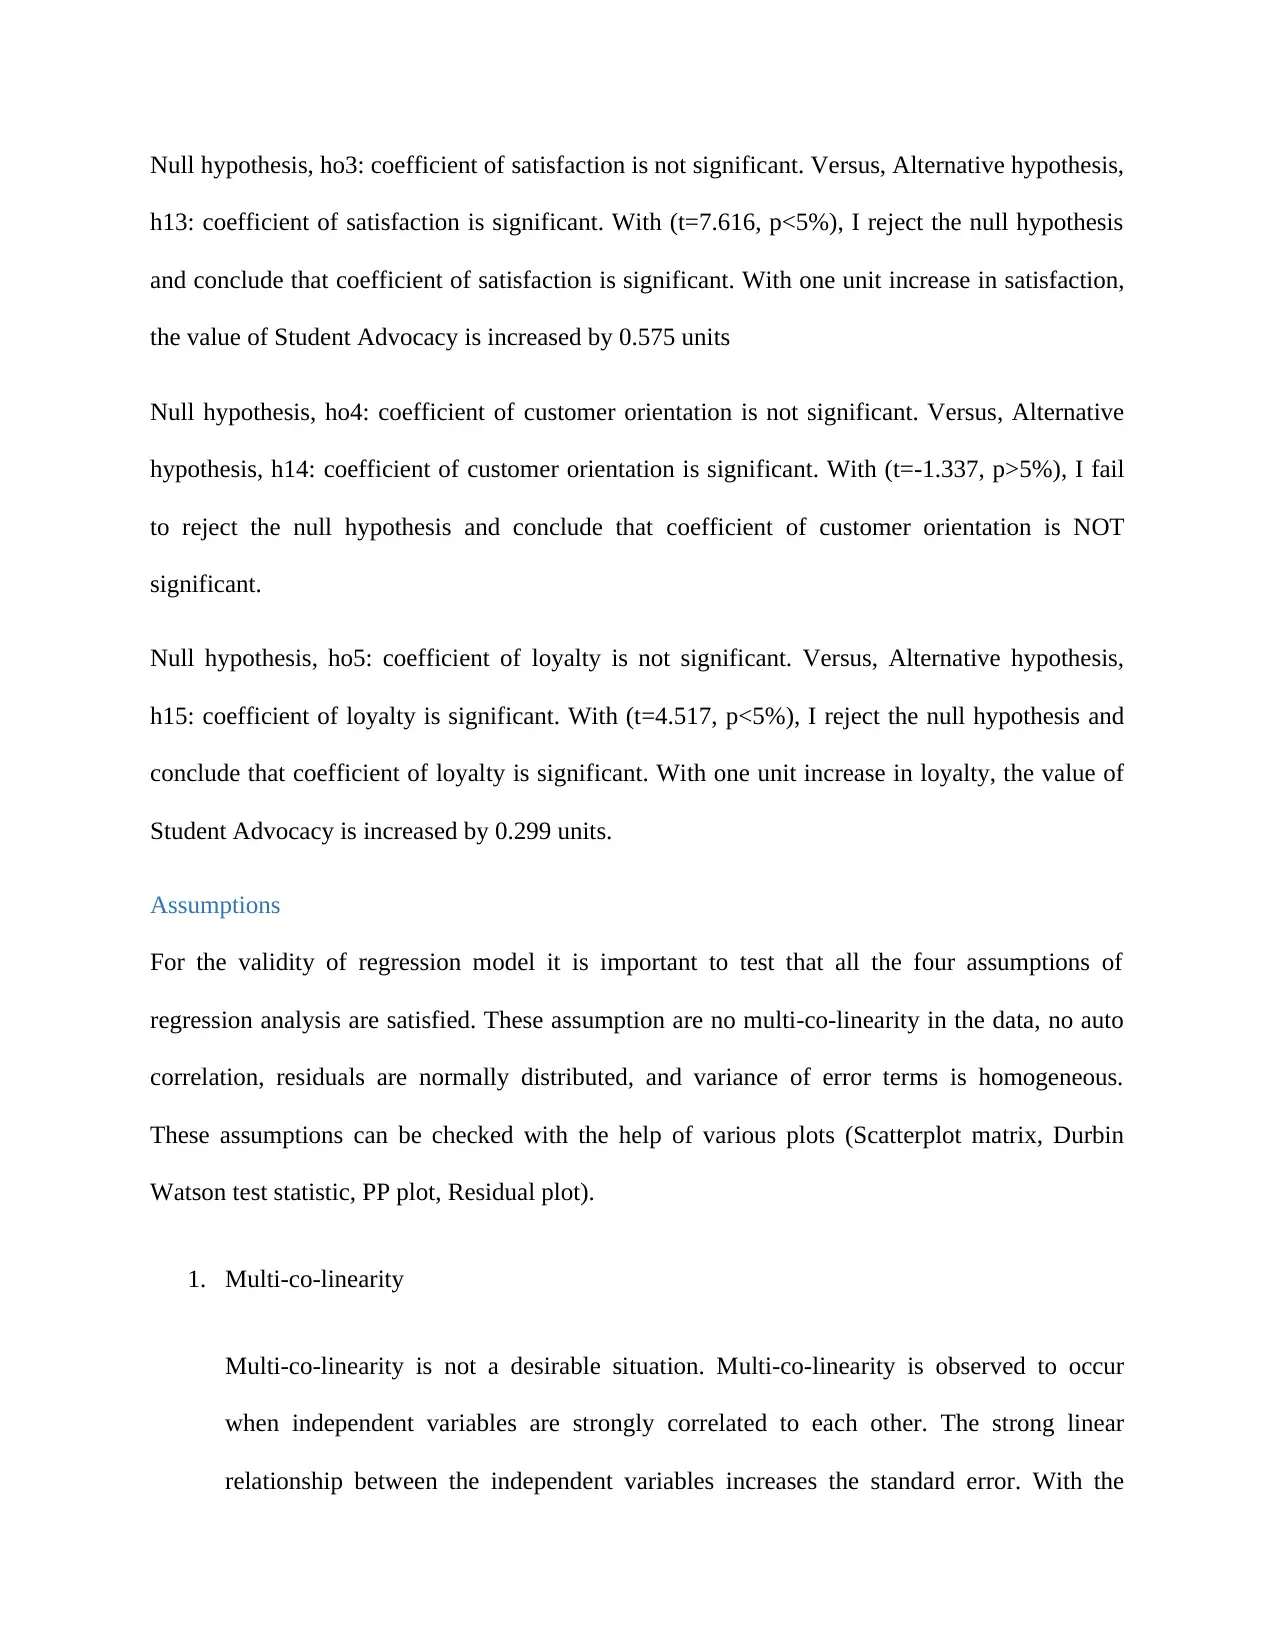
Null hypothesis, ho3: coefficient of satisfaction is not significant. Versus, Alternative hypothesis,
h13: coefficient of satisfaction is significant. With (t=7.616, p<5%), I reject the null hypothesis
and conclude that coefficient of satisfaction is significant. With one unit increase in satisfaction,
the value of Student Advocacy is increased by 0.575 units
Null hypothesis, ho4: coefficient of customer orientation is not significant. Versus, Alternative
hypothesis, h14: coefficient of customer orientation is significant. With (t=-1.337, p>5%), I fail
to reject the null hypothesis and conclude that coefficient of customer orientation is NOT
significant.
Null hypothesis, ho5: coefficient of loyalty is not significant. Versus, Alternative hypothesis,
h15: coefficient of loyalty is significant. With (t=4.517, p<5%), I reject the null hypothesis and
conclude that coefficient of loyalty is significant. With one unit increase in loyalty, the value of
Student Advocacy is increased by 0.299 units.
Assumptions
For the validity of regression model it is important to test that all the four assumptions of
regression analysis are satisfied. These assumption are no multi-co-linearity in the data, no auto
correlation, residuals are normally distributed, and variance of error terms is homogeneous.
These assumptions can be checked with the help of various plots (Scatterplot matrix, Durbin
Watson test statistic, PP plot, Residual plot).
1. Multi-co-linearity
Multi-co-linearity is not a desirable situation. Multi-co-linearity is observed to occur
when independent variables are strongly correlated to each other. The strong linear
relationship between the independent variables increases the standard error. With the
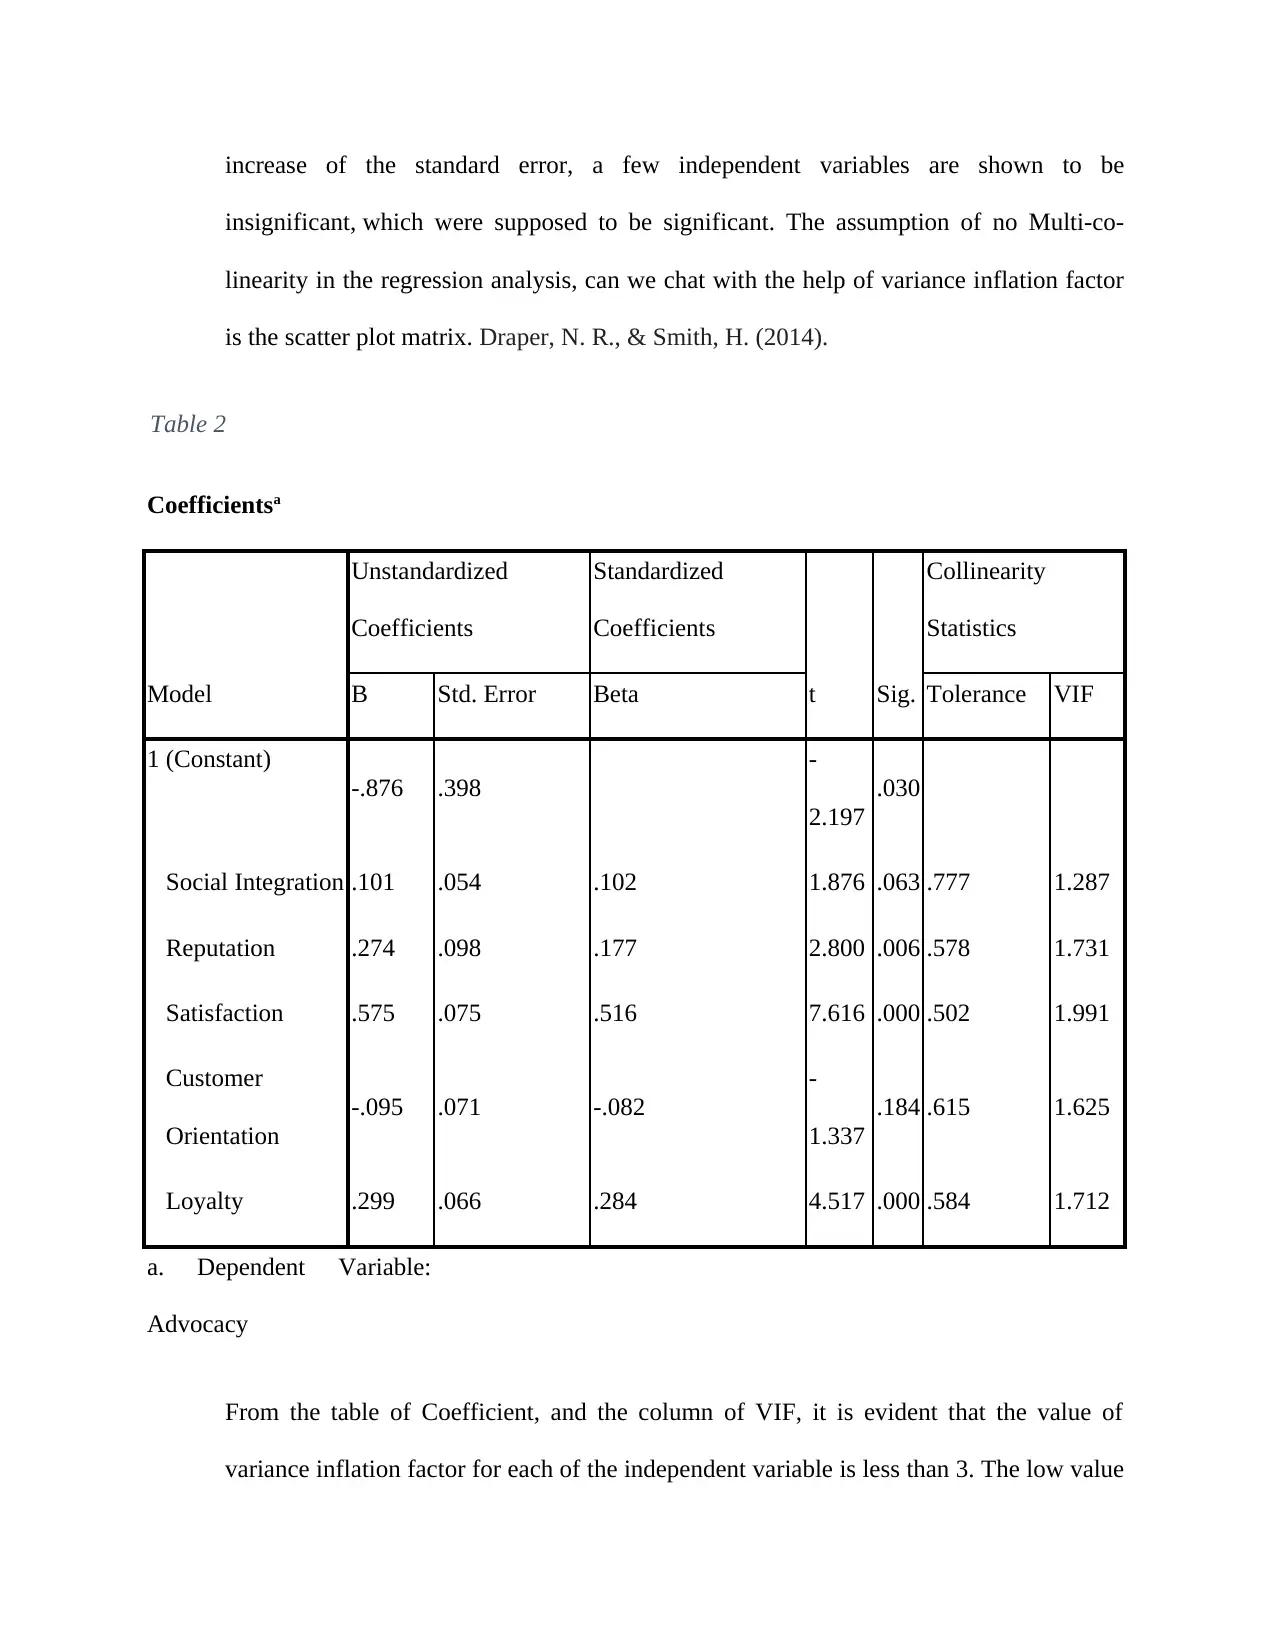
increase of the standard error, a few independent variables are shown to be
insignificant, which were supposed to be significant. The assumption of no Multi-co-
linearity in the regression analysis, can we chat with the help of variance inflation factor
is the scatter plot matrix. Draper, N. R., & Smith, H. (2014).
Table 2
Coefficientsa
Model
Unstandardized
Coefficients
Standardized
Coefficients
t Sig.
Collinearity
Statistics
B Std. Error Beta Tolerance VIF
1 (Constant)
-.876 .398
-
2.197
.030
Social Integration .101 .054 .102 1.876 .063 .777 1.287
Reputation .274 .098 .177 2.800 .006 .578 1.731
Satisfaction .575 .075 .516 7.616 .000 .502 1.991
Customer
Orientation
-.095 .071 -.082
-
1.337
.184 .615 1.625
Loyalty .299 .066 .284 4.517 .000 .584 1.712
a. Dependent Variable:
Advocacy
From the table of Coefficient, and the column of VIF, it is evident that the value of
variance inflation factor for each of the independent variable is less than 3. The low value
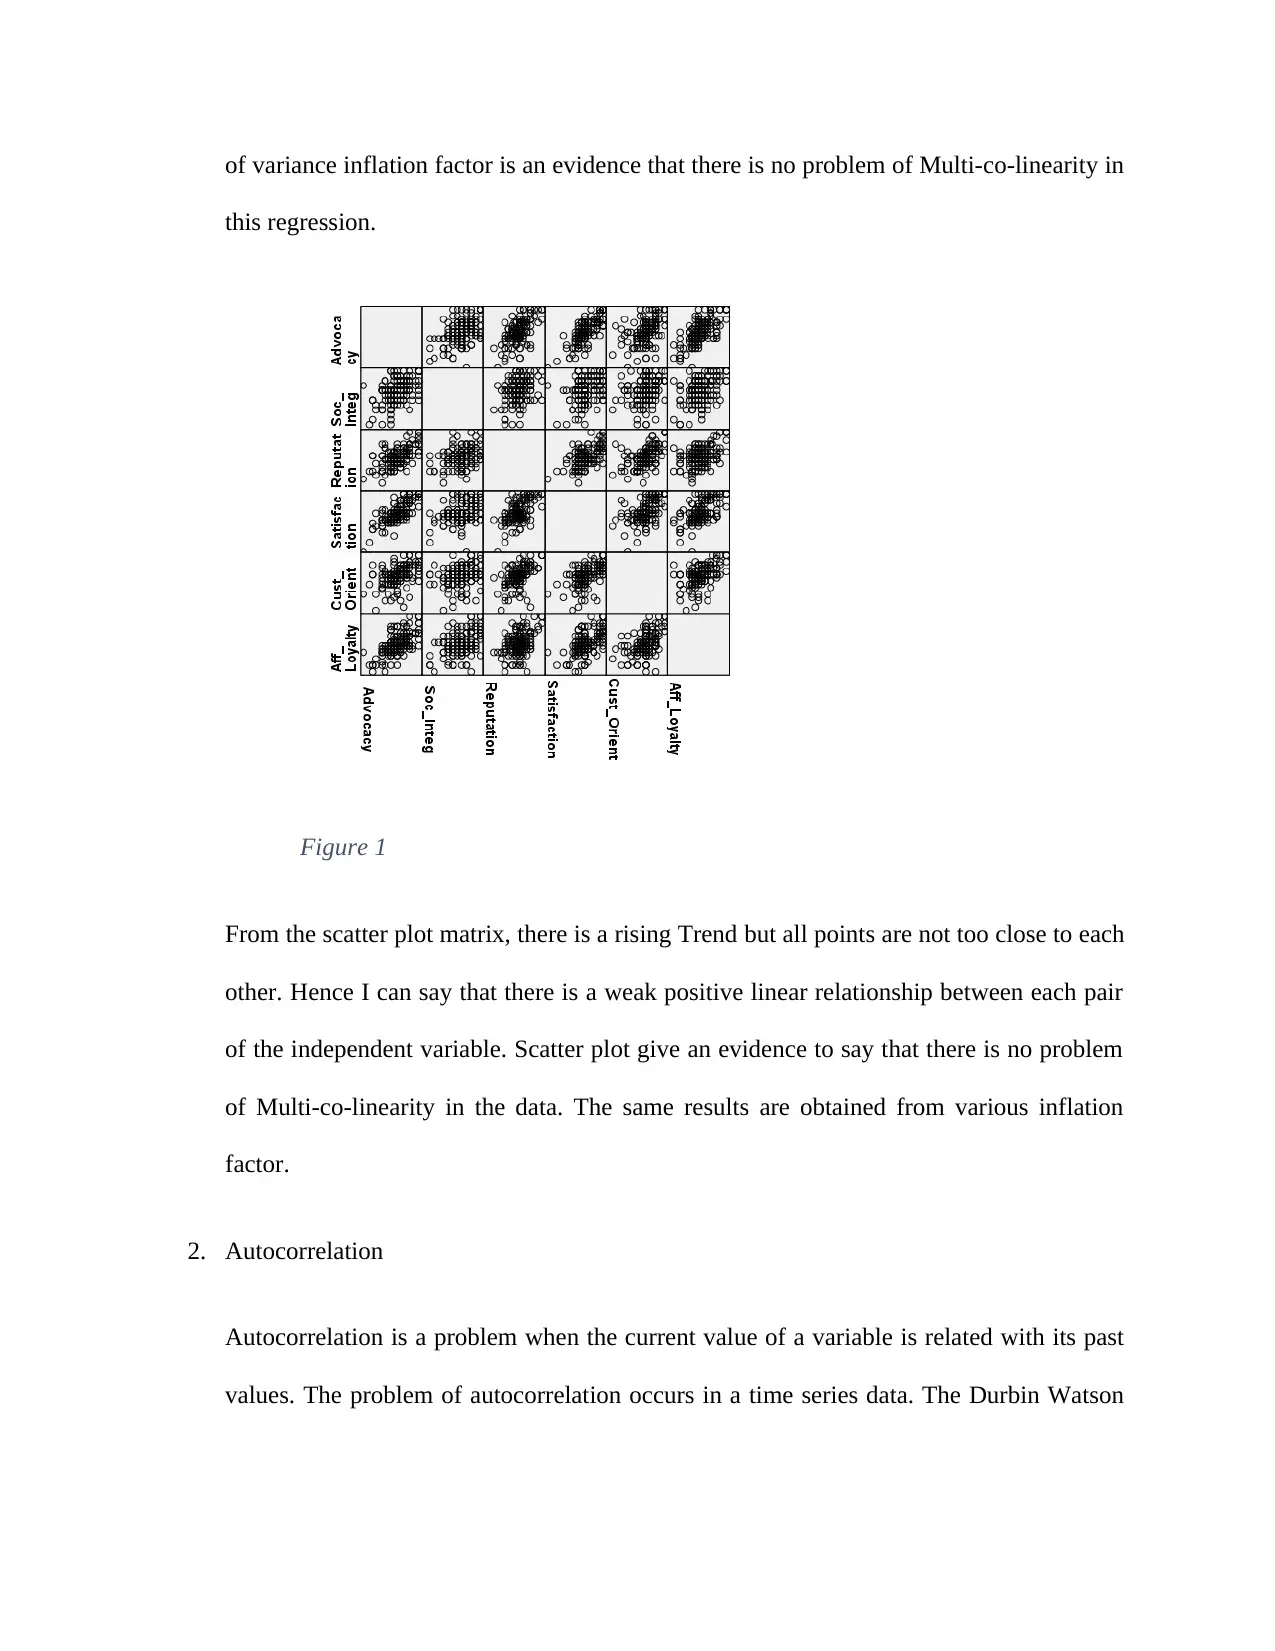
of variance inflation factor is an evidence that there is no problem of Multi-co-linearity in
this regression.
Figure 1
From the scatter plot matrix, there is a rising Trend but all points are not too close to each
other. Hence I can say that there is a weak positive linear relationship between each pair
of the independent variable. Scatter plot give an evidence to say that there is no problem
of Multi-co-linearity in the data. The same results are obtained from various inflation
factor.
2. Autocorrelation
Autocorrelation is a problem when the current value of a variable is related with its past
values. The problem of autocorrelation occurs in a time series data. The Durbin Watson
Secure Best Marks with AI Grader
Need help grading? Try our AI Grader for instant feedback on your assignments.
test statistic is used to test the problem of autocorrelation in the data. Darlington, R. B., &
Hayes, A. F. (2016).
The null hypothesis, there is no problem of autocorrelation in the data. Versus an
alternative hypothesis, there is an autocorrelation in the data.
Table 3
Model Summaryb
Model R R Square
Adjusted R
Square
Std. Error of
the Estimate
Durbin-
Watson
1 .838a .703 .691 .70176 2.029
a. Predictors: (Constant), Loyalty, Social Integration, Reputation, Customer
Orientation, Satisfaction
b. Dependent Variable: Advocacy
The Durbin Watson test statistic, W = 2.029
Critical value, dL = 1.651 and dU = 1.817.
The decision rule is to reject the null hypothesis if d <dL. However if If d >dU, the null
hypothesis is not rejected. The test is said to be inconclusive if dL< d <dU.
Since W >dU, the null hypothesis is not rejected. It is sufficient to stay statistically that
there is no problem of autocorrelation in the data. And the second assumption of the
regression analysis of no autocorrelation is also satisfied.
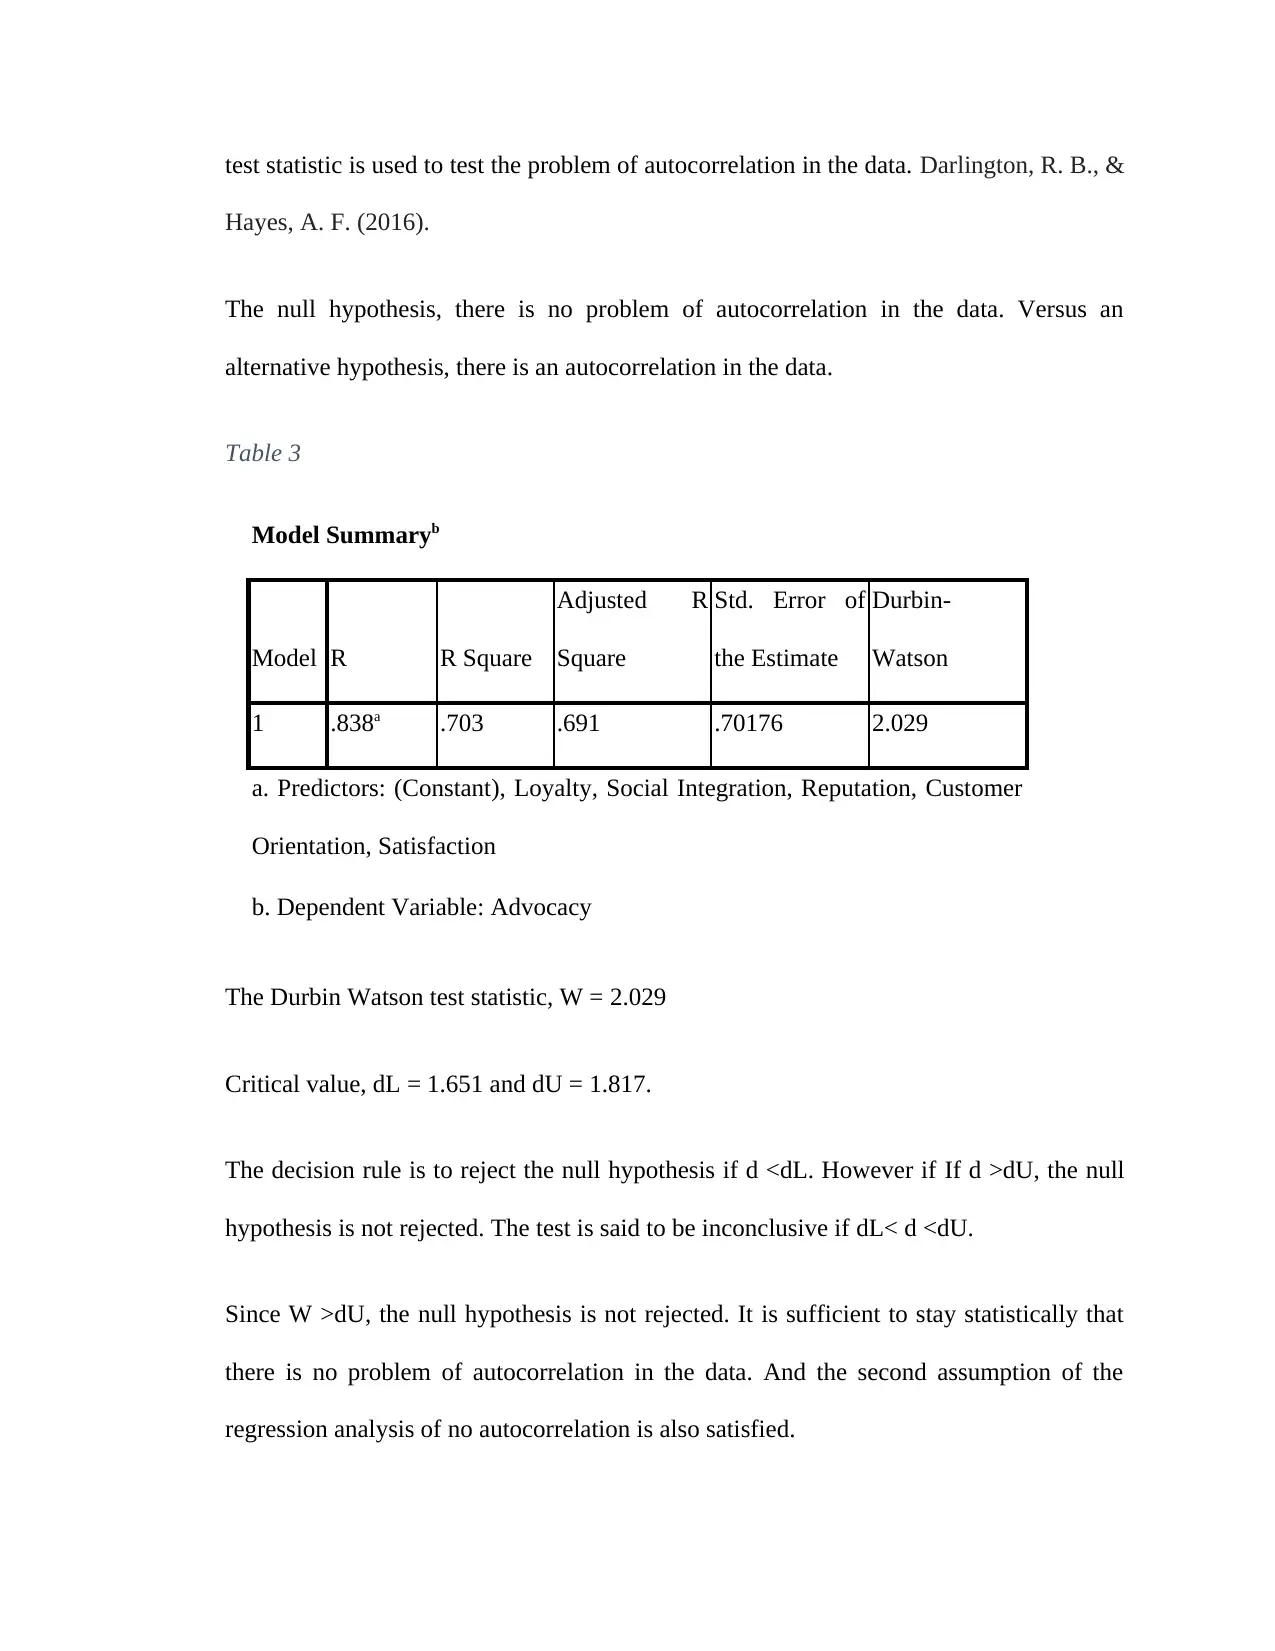
3. Residuals are normally distributed
Residuals are the error terms in regression analysis. The residual is the difference
between the predicted and the actual value. The PP plot is helpful to check the normal
distribution for any variable. To check the assumption of normality of residuals in
regression analysis, PP plot is generally used. Schroeder, L. D., Sjoquist, D. L., &
Stephan, P. E. (2016).
Figure 2
An S-shape is formed in the PP plot indicating that the underline distribution of the
variable is normal. Hence I can say that the residuals are normally distributed. Thus the
third assumption of normal distribution of residuals for this regression analysis is also
satisfied.
4. The variance of error terms is homogeneous
Residuals are the error terms in regression analysis. The residual is the difference
between the predicted and the actual value. The PP plot is helpful to check the normal
distribution for any variable. To check the assumption of normality of residuals in
regression analysis, PP plot is generally used. Schroeder, L. D., Sjoquist, D. L., &
Stephan, P. E. (2016).
Figure 2
An S-shape is formed in the PP plot indicating that the underline distribution of the
variable is normal. Hence I can say that the residuals are normally distributed. Thus the
third assumption of normal distribution of residuals for this regression analysis is also
satisfied.
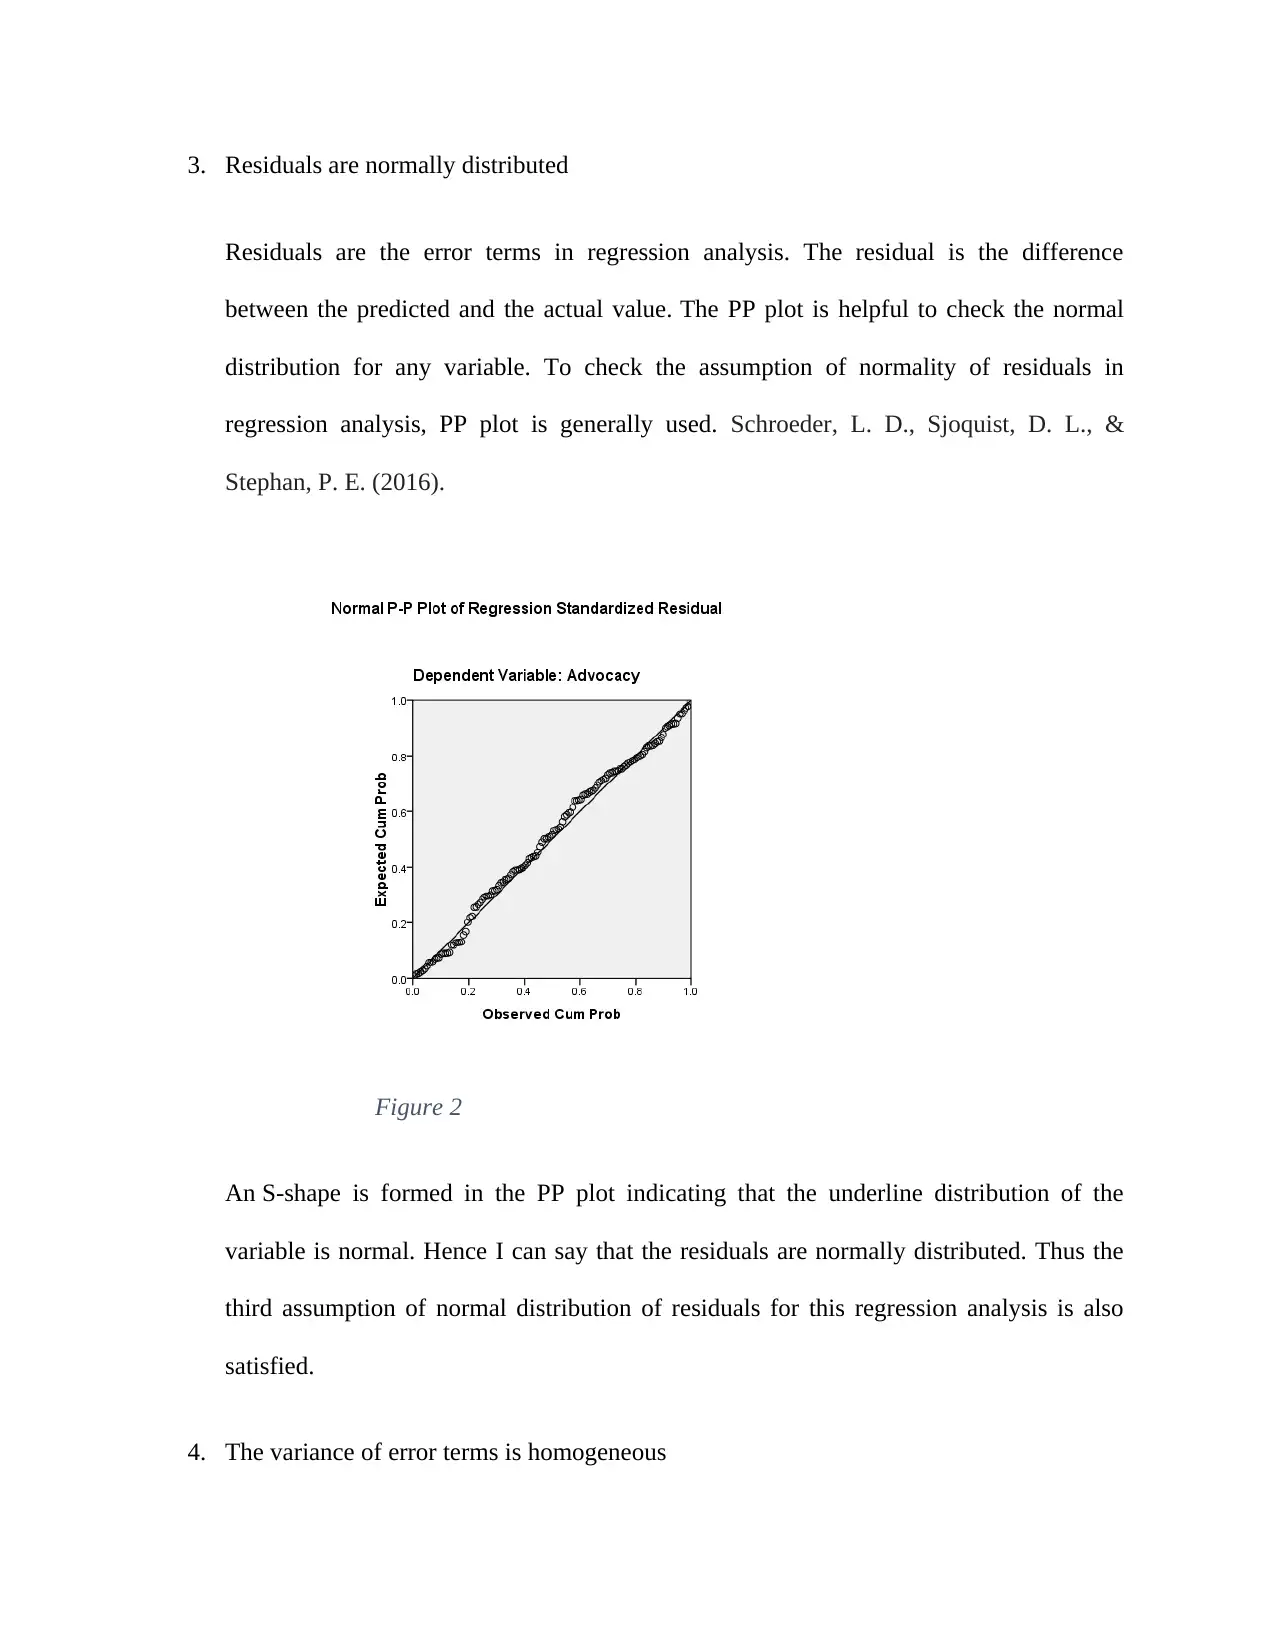
4. The variance of error terms is homogeneous
The last assumption is that the residuals of the regression analysis should be
homogeneous. This is equivalent to test the equality of variances for residuals. This
assumption is checked with the help of the residual plot. A residual plot is a plot with
standardized predicted value on the x-axis versus the standardized residuals values on the
y-axis. Chatterjee, S., &Hadi, A. S. (2015).
Figure 3
The points are randomly scattered in the residual plot. Hence the variance of residuals
can be considered constant. Thus the fourth assumption of regression analysis regarding
the homogeneity of residuals is also satisfied.
Paraphrase This Document
Need a fresh take? Get an instant paraphrase of this document with our AI Paraphraser
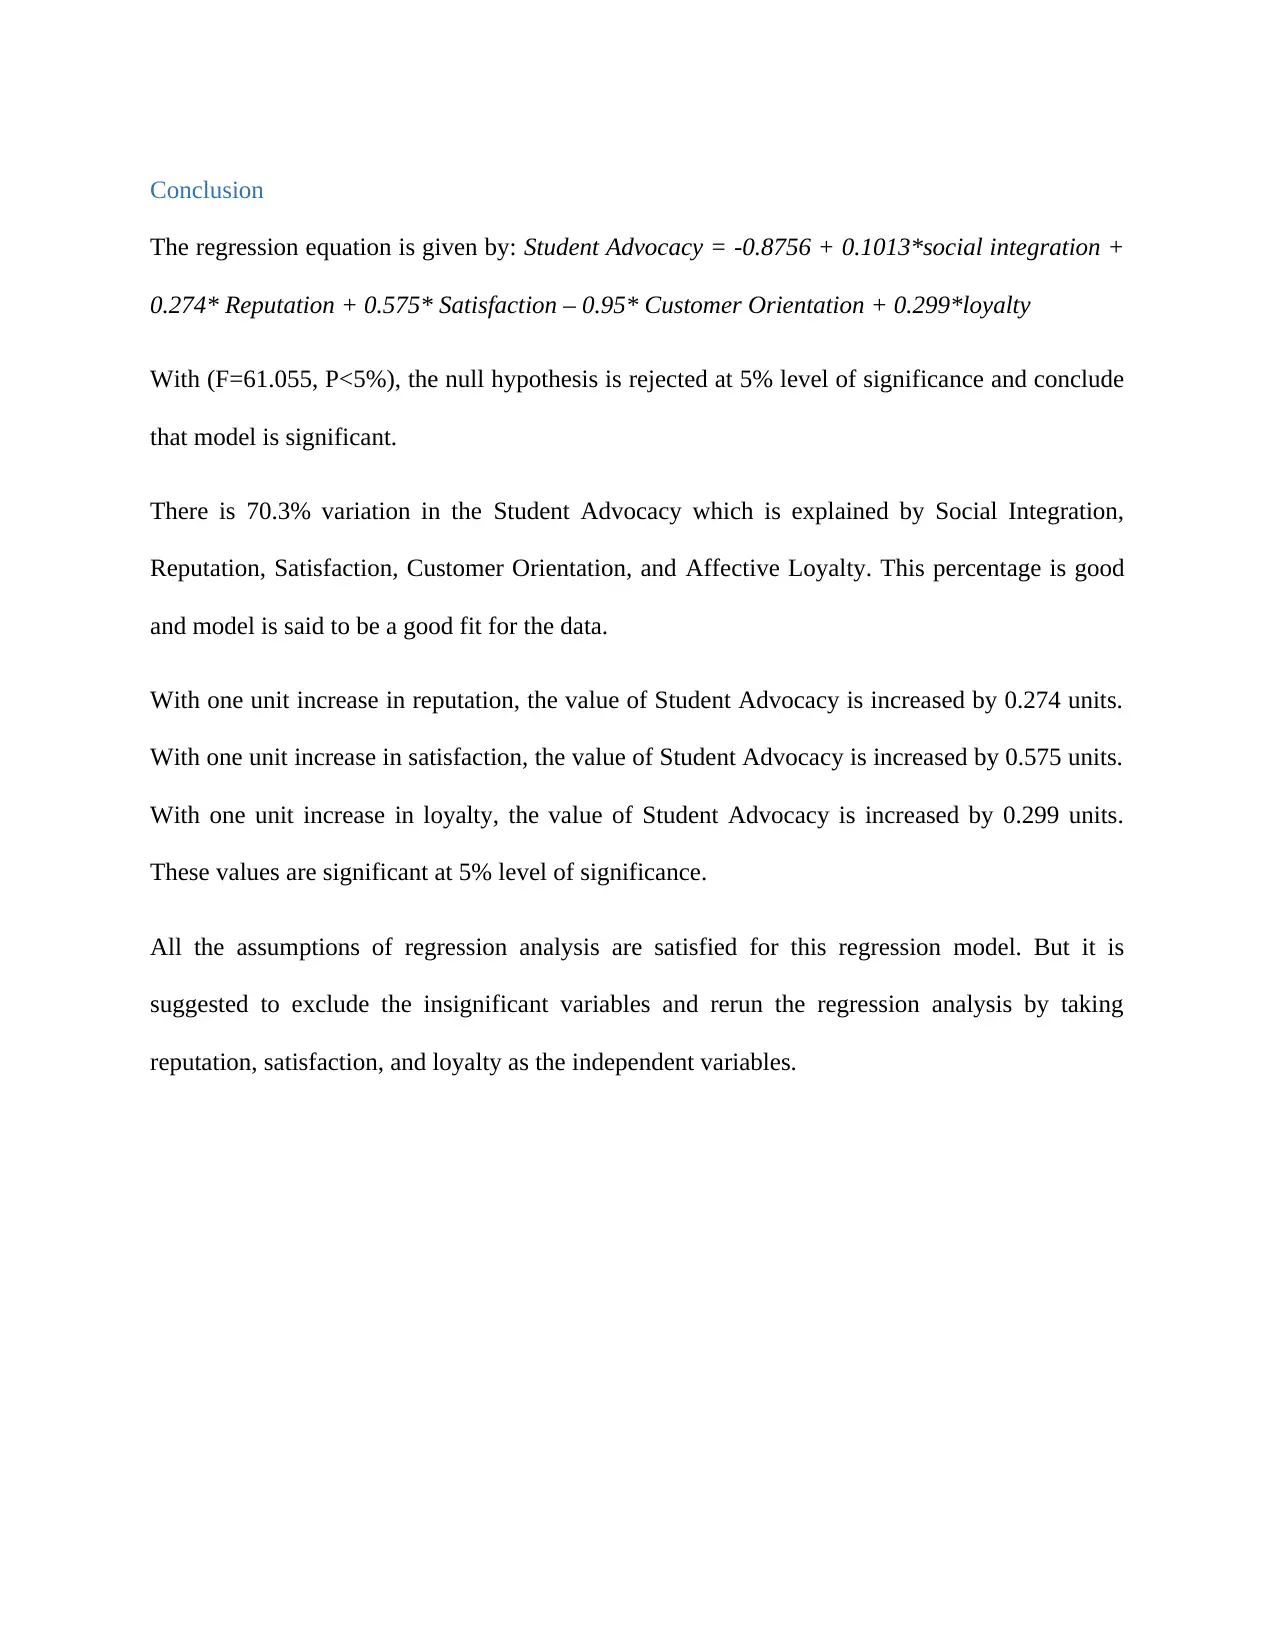
Conclusion
The regression equation is given by: Student Advocacy = -0.8756 + 0.1013*social integration +
0.274* Reputation + 0.575* Satisfaction – 0.95* Customer Orientation + 0.299*loyalty
With (F=61.055, P<5%), the null hypothesis is rejected at 5% level of significance and conclude
that model is significant.
There is 70.3% variation in the Student Advocacy which is explained by Social Integration,
Reputation, Satisfaction, Customer Orientation, and Affective Loyalty. This percentage is good
and model is said to be a good fit for the data.
With one unit increase in reputation, the value of Student Advocacy is increased by 0.274 units.
With one unit increase in satisfaction, the value of Student Advocacy is increased by 0.575 units.
With one unit increase in loyalty, the value of Student Advocacy is increased by 0.299 units.
These values are significant at 5% level of significance.
All the assumptions of regression analysis are satisfied for this regression model. But it is
suggested to exclude the insignificant variables and rerun the regression analysis by taking
reputation, satisfaction, and loyalty as the independent variables.
Bibliography
Chatterjee, S., &Hadi, A. S. (2015). Regression analysis by example. John Wiley & Sons.
Draper, N. R., & Smith, H. (2014). Applied regression analysis(Vol. 326). John Wiley & Sons.
Darlington, R. B., & Hayes, A. F. (2016). Regression analysis and linear models: Concepts,
applications, and implementation. Guilford Publications.
Schroeder, L. D., Sjoquist, D. L., & Stephan, P. E. (2016). Understanding regression analysis:
An introductory guide (Vol. 57). Sage Publications.
de Macedo Bergamo, F. V., Giuliani, A. C., Zambaldi, F., & Ponchio, M. C. (2012). Student
loyalty based on relationship quality: An analysis on higher education institutions. Brazilian
Business Review, 9(2), 26-46.
Brown, R. M., & Mazzarol, T. W. (2009). The importance of institutional image to student
satisfaction and loyalty within higher education. Higher Education, 58(1), 81-95.
Helen, W. S. M. (2011). Building relationship between education institutions and students:
Student loyalty in self-financed tertiary education. IBIMA Business Review.
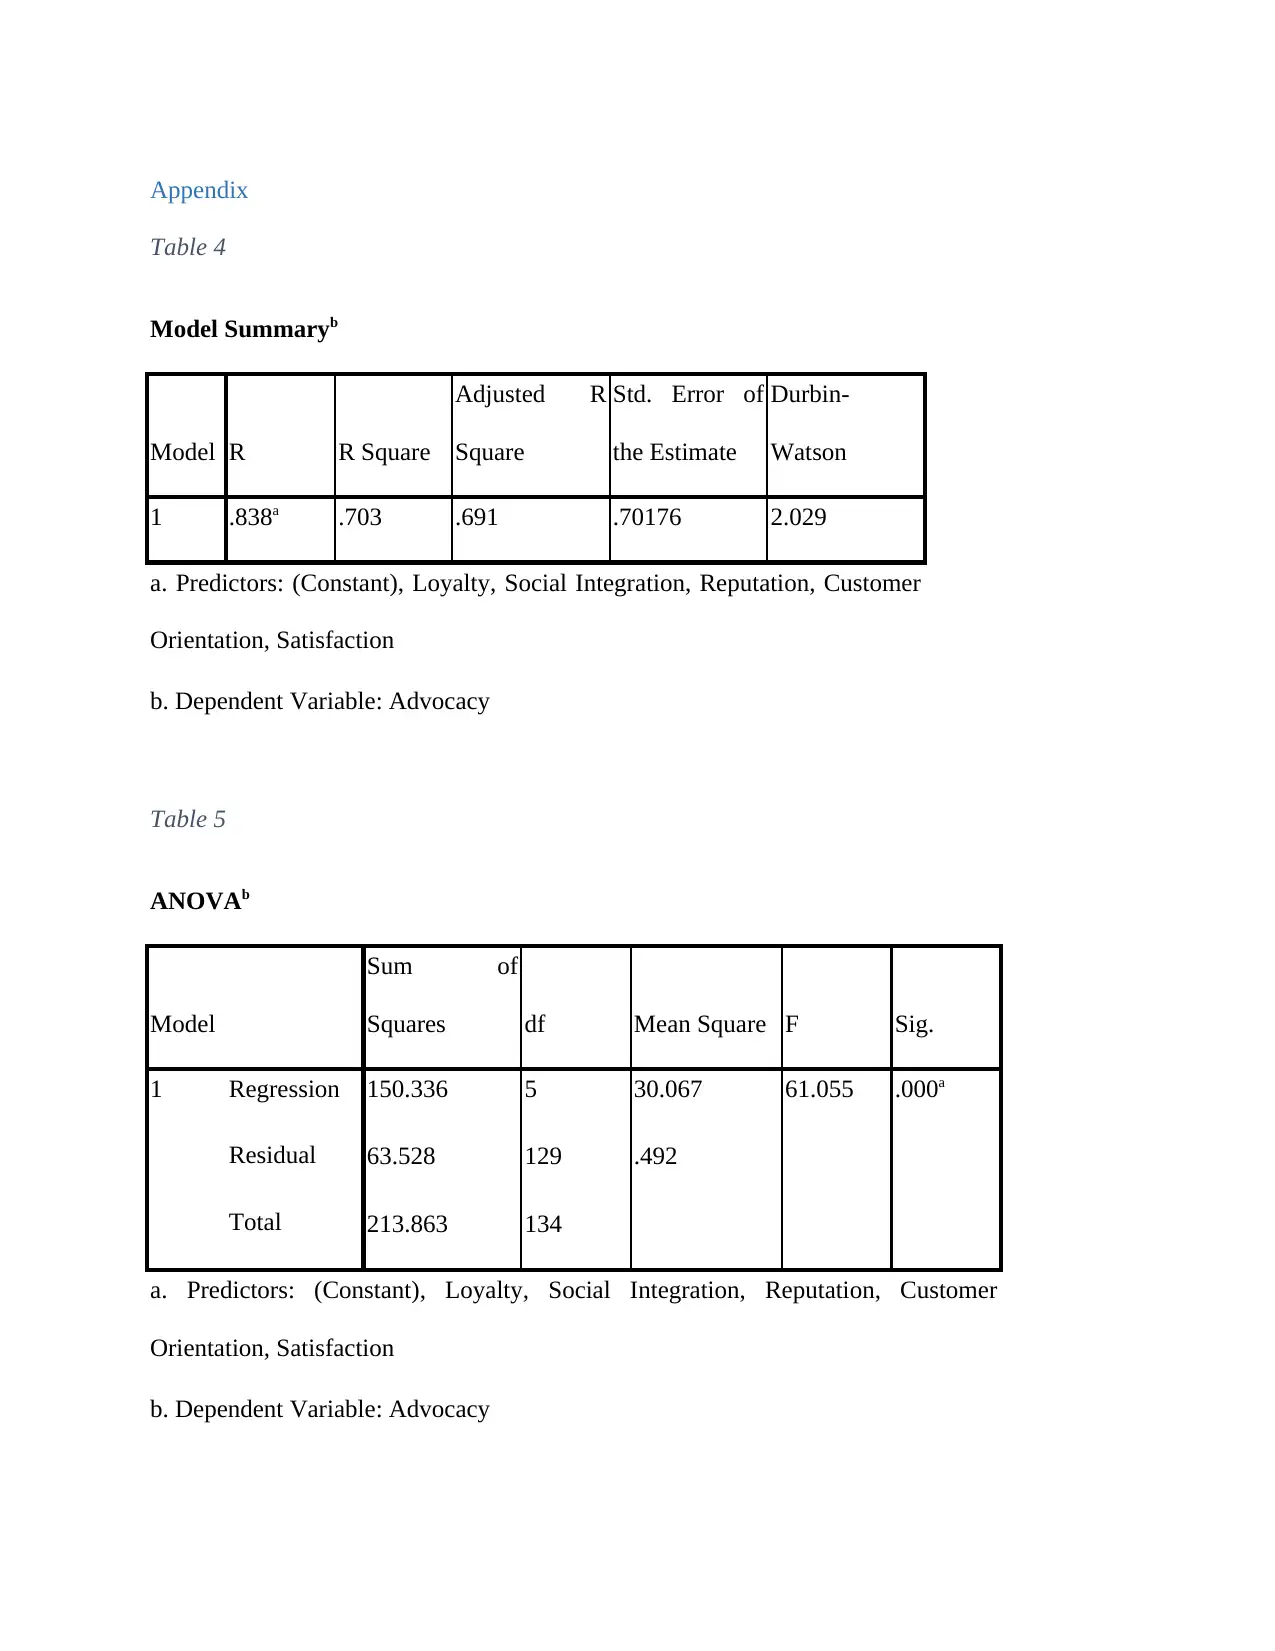
Appendix
Table 4
Model Summaryb
Model R R Square
Adjusted R
Square
Std. Error of
the Estimate
Durbin-
Watson
1 .838a .703 .691 .70176 2.029
a. Predictors: (Constant), Loyalty, Social Integration, Reputation, Customer
Orientation, Satisfaction
b. Dependent Variable: Advocacy
Table 5
ANOVAb
Model
Sum of
Squares df Mean Square F Sig.
1 Regression 150.336 5 30.067 61.055 .000a
Residual 63.528 129 .492
Total 213.863 134
a. Predictors: (Constant), Loyalty, Social Integration, Reputation, Customer
Orientation, Satisfaction
b. Dependent Variable: Advocacy
Secure Best Marks with AI Grader
Need help grading? Try our AI Grader for instant feedback on your assignments.
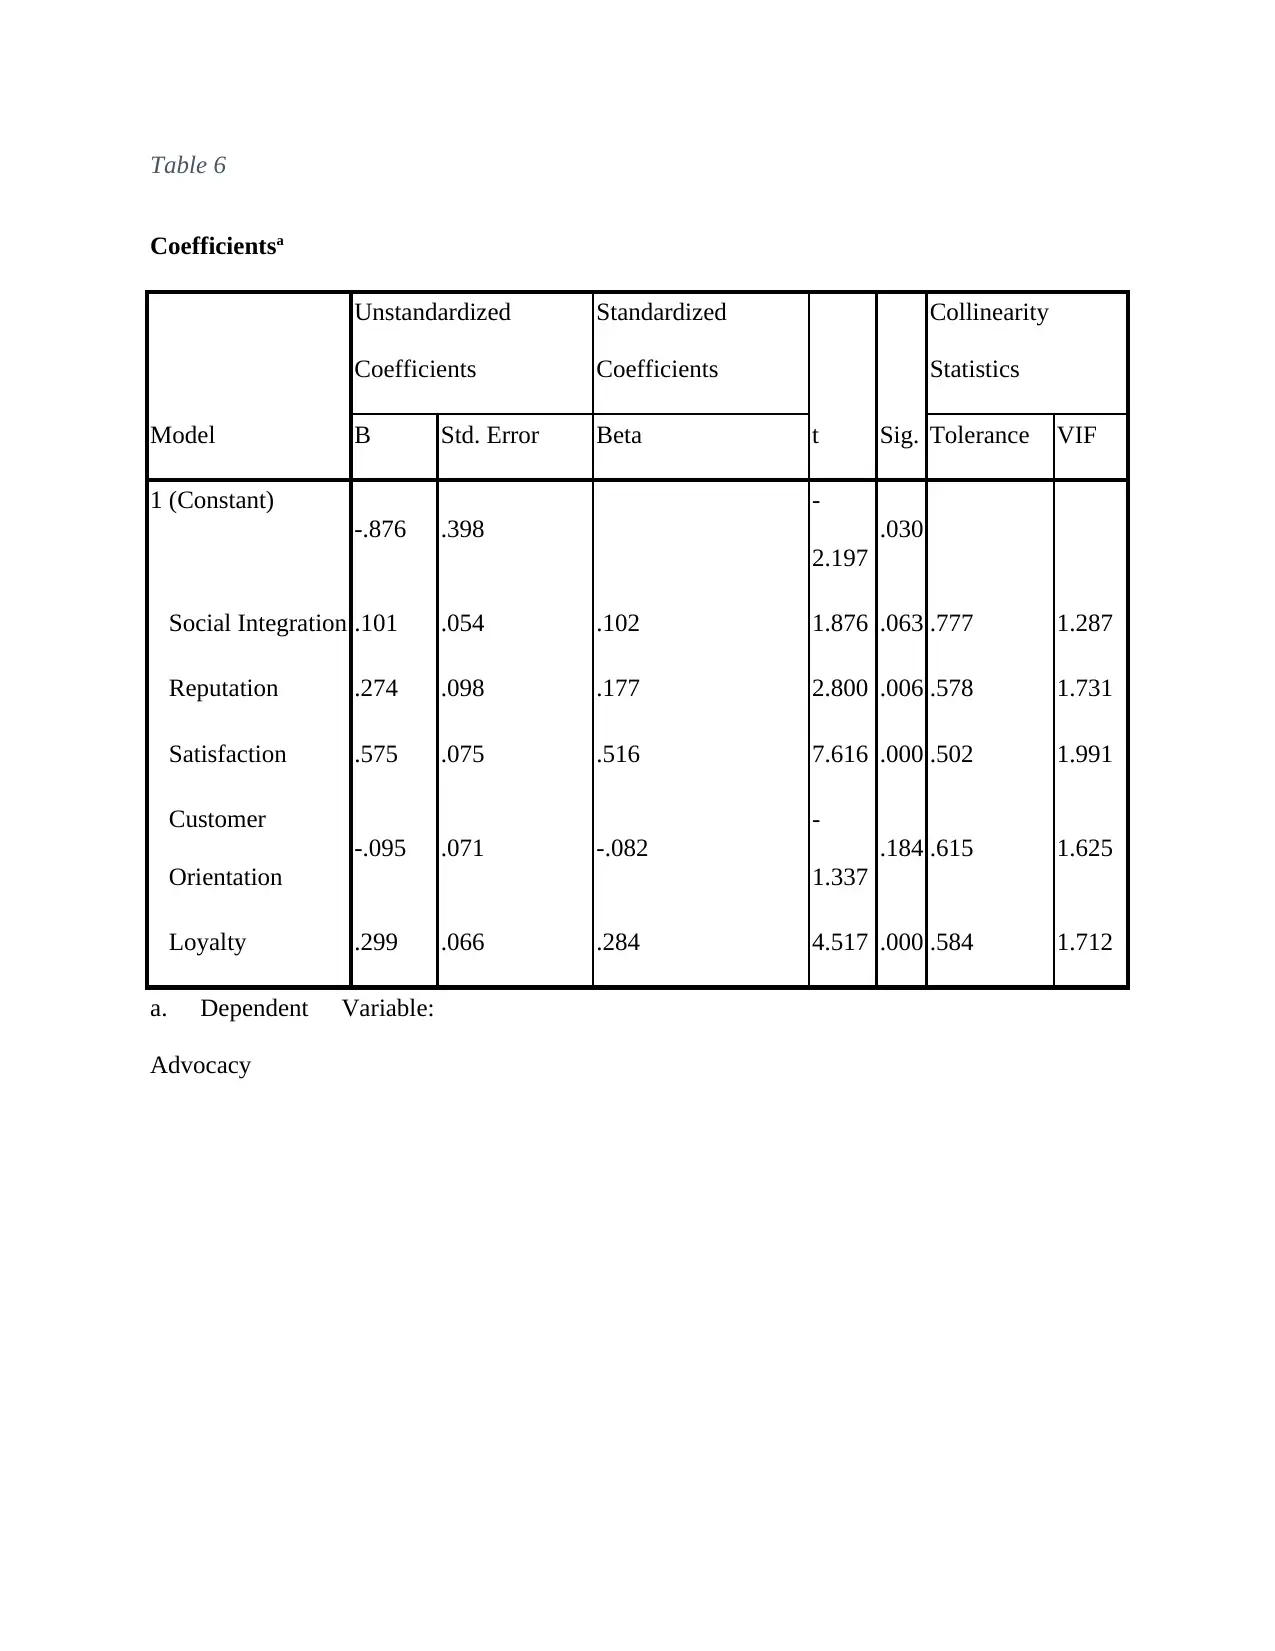
Table 6
Coefficientsa
Model
Unstandardized
Coefficients
Standardized
Coefficients
t Sig.
Collinearity
Statistics
B Std. Error Beta Tolerance VIF
1 (Constant)
-.876 .398
-
2.197
.030
Social Integration .101 .054 .102 1.876 .063 .777 1.287
Reputation .274 .098 .177 2.800 .006 .578 1.731
Satisfaction .575 .075 .516 7.616 .000 .502 1.991
Customer
Orientation
-.095 .071 -.082
-
1.337
.184 .615 1.625
Loyalty .299 .066 .284 4.517 .000 .584 1.712
a. Dependent Variable:
Advocacy
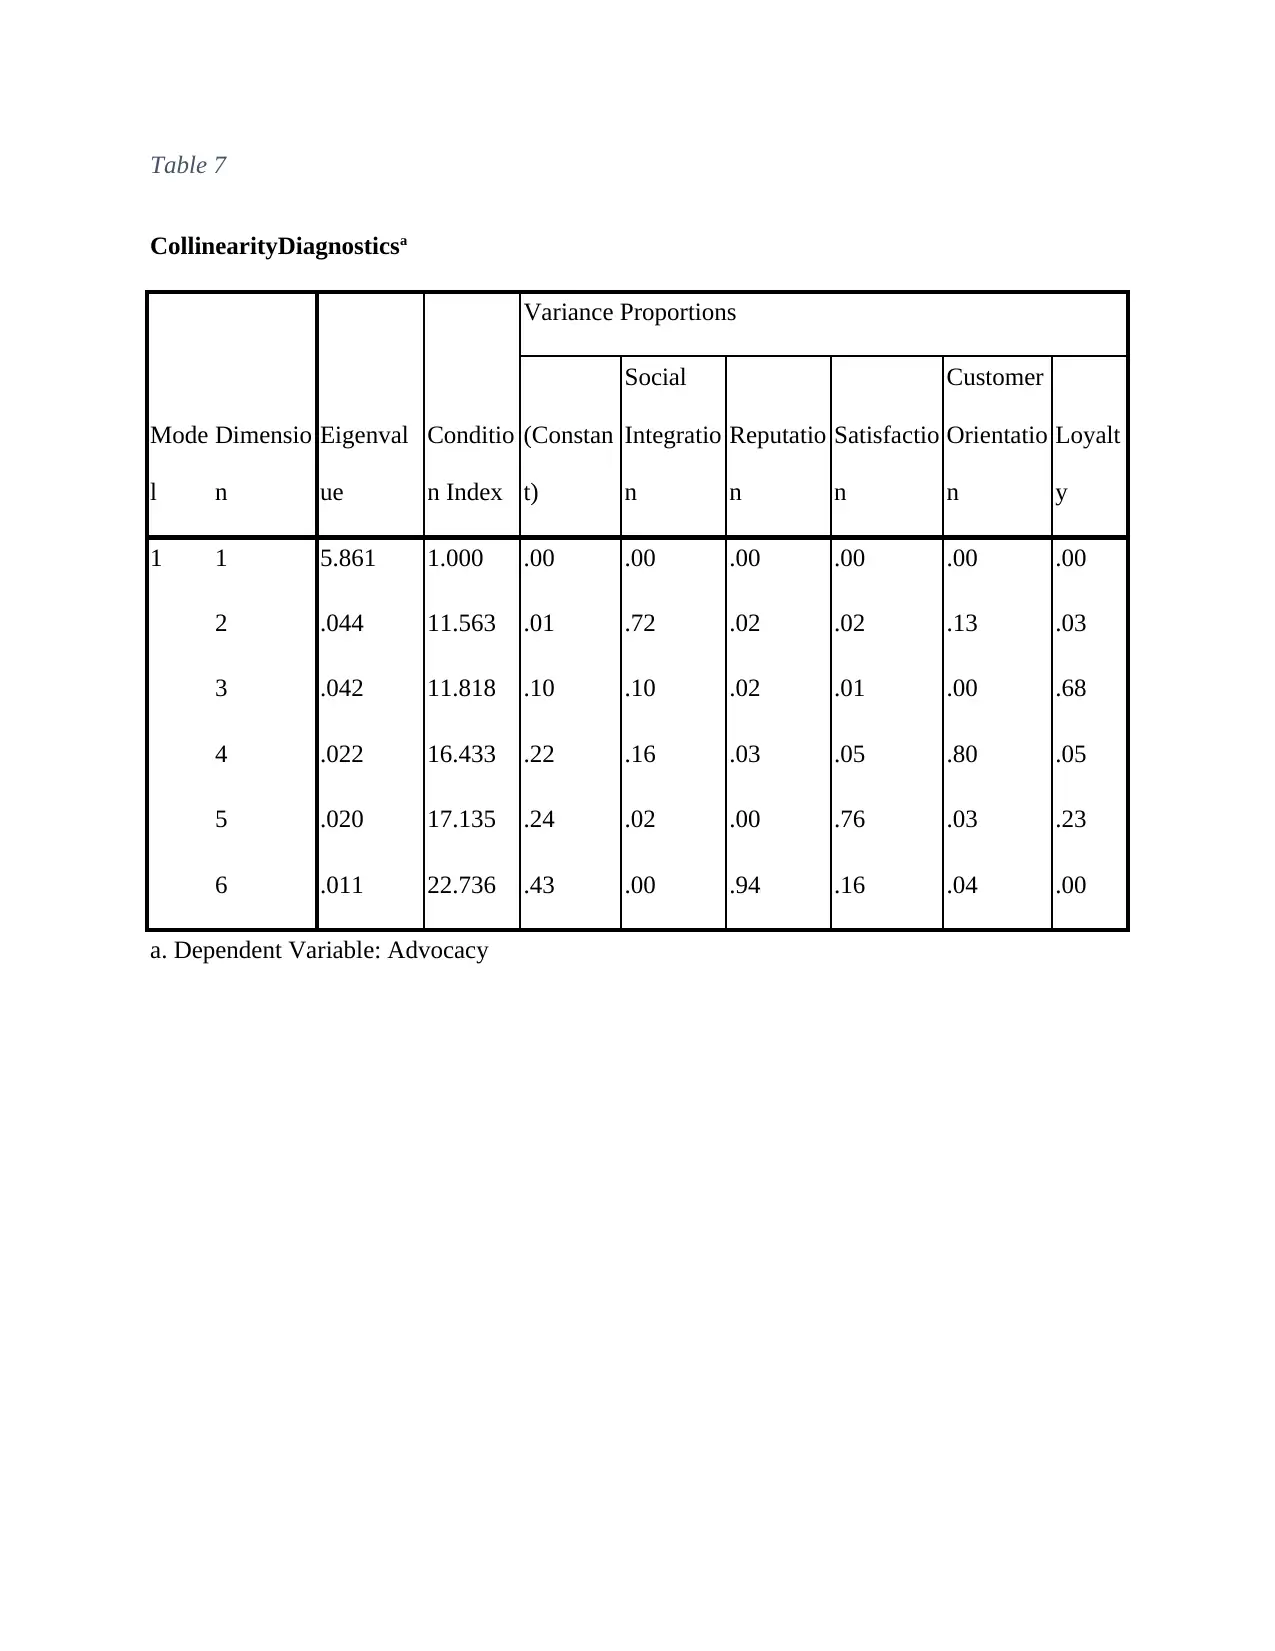
Table 7
CollinearityDiagnosticsa
Mode
l
Dimensio
n
Eigenval
ue
Conditio
n Index
Variance Proportions
(Constan
t)
Social
Integratio
n
Reputatio
n
Satisfactio
n
Customer
Orientatio
n
Loyalt
y
1 1 5.861 1.000 .00 .00 .00 .00 .00 .00
2 .044 11.563 .01 .72 .02 .02 .13 .03
3 .042 11.818 .10 .10 .02 .01 .00 .68
4 .022 16.433 .22 .16 .03 .05 .80 .05
5 .020 17.135 .24 .02 .00 .76 .03 .23
6 .011 22.736 .43 .00 .94 .16 .04 .00
a. Dependent Variable: Advocacy
1 out of 21
Related Documents


Your All-in-One AI-Powered Toolkit for Academic Success.
+13062052269
info@desklib.com
Available 24*7 on WhatsApp / Email
![[object Object]](/_next/static/media/star-bottom.7253800d.svg)
Unlock your academic potential
© 2024 | Zucol Services PVT LTD | All rights reserved.