Data Presentation, Analysis and Discussion
This chapter presents analyses and discusses the data collected from the empirical study from a sample of educators from the six schools under the Mahatma Gandhi Institute network.
55 Pages7560 Words463 Views
Added on 2023-04-21
About This Document
This chapter presents analyses and discusses the data collected from the empirical study from a sample of educators from the six schools under the Mahatma Gandhi Institute network. The findings were analysed, processed and discussed as per the objective of the research questions for the study.
Data Presentation, Analysis and Discussion
This chapter presents analyses and discusses the data collected from the empirical study from a sample of educators from the six schools under the Mahatma Gandhi Institute network.
Added on 2023-04-21
ShareRelated Documents
Table of Contents
CHAPTER FOUR................................................................................................................................2
DATA PRESENTATION, ANALYSIS AND DISCUSSION............................................................2
4.1 INTRODUCTION......................................................................................................................2
4.2 RESPONSE RATE.....................................................................................................................2
4.3 BACKGROUND INFORMATION...........................................................................................3
4.3.1 Gender..................................................................................................................................3
4.3.2 Age.......................................................................................................................................4
4.3.3 Academic qualifications.......................................................................................................5
4.3.4 Teaching experience............................................................................................................6
4.4 CONTEXTUAL DESCRIPTIONS OF RESEARCH FINDINGS.......................................7
4.4.1 Research Question 1: What are the leadership styles commonly practiced by the rectors? 7
4.4.1.1 The commonly used leadership style by rectors in the secondary schools...................7
4.4.1.2 Does the leadership style applied by the rector affect the teaching and learning
process in your school?.............................................................................................................8
4.4.1.3 Factors influencing the leadership style of the rector..............................................9
4.4.1.4 Student’s academic performance trends for Cambridge SC and HSC examinations for
the past five years....................................................................................................................10
4.4.1.5 Student’s academic performance at Cambridge SC and HSC examinations is
dependent on the leadership style used by the school rector...................................................12
1
CHAPTER FOUR
DATA PRESENTATION, ANALYSIS AND DISCUSSION
4.1 INTRODUCTION
This chapter presents analyses and discusses the data collected from the empirical study from a
sample of educators from the six schools under the Mahatma Gandhi Institute network. The
findings were analysed, processed and discussed as per the objective of the research questions for
the study. Analysis was made easier by use of Statistical Package for Social Sciences (SPSS). In
addition, the findings were presented systematically in tables and charts in brief, starting with
background information of the respondents as obtained from questionnaires while other important
findings were arranged in accordance with the research questions that focused on the rector’s
2
leadership styles and their effects on teaching and learning process and the students’ academic
performances in the schools under scrutiny. The research findings also focused on leadership style
commonly practised by the heads of schools.
4.2 RESPONSE RATE
A total of 100 questionnaires were distributed to school educators of the Mahatma Gandhi Institute
network, comprising of 6 schools located in various regions of the country. All questionnaires were
duly filled and returned. This represented a 100 percent response rate from educators. This was
made possible because confidentiality was observed and the information gathered was meant for
academic purposes only. This made the respondents give a high response rate which was considered
suitable enough to give a true reflection of the issues under study.
4.3 BACKGROUND INFORMATION
The background information involved the issues such as category of respondents by gender, age
teaching experience, and level of education of educators who participated in answering
questionnaires. The essence of using the background characteristics of the various respondents who
3
participated in the survey was to enable researcher to describe the characteristics of the target
population and to gather aspects of the six schools under the MGI network which would be seen as
helpful to elaborate the findings. Their characteristics have a strong bearing on the study’s findings
relating to the hypotheses. Questionnaires among educators were administered because they were
the direct focus of the study and due to their unique role in student’s academic performance. This
helped to grasp essential information on the influence of the leadership styles of rectors on student’s
academic performance. Data gathered were arranged based on the gender, age, teaching experience
and the level of education obtained.
4.3.1 Gender
Figure 4.1 below indicates the percentage of respondents based on gender characteristics.
Male
38%
Femal
e
62%
Gender
Figure 4.1: The category of educators in Rabindranath Tagore and Mahatma Gandhi
secondary schools of Mauritius
4
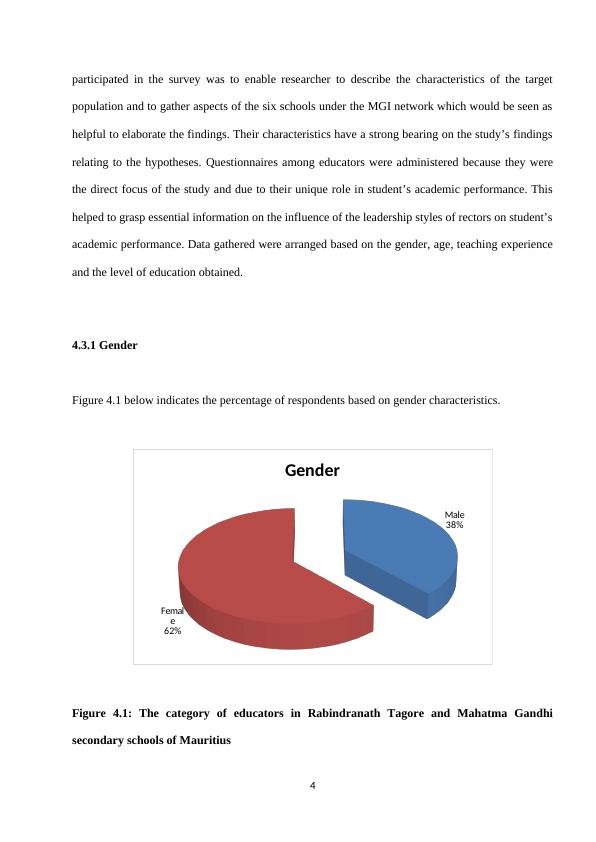
The pie chart above shows the percentage of educators based on gender characteristics involved in
responding to the questionnaires. It indicates that most educators in the studied area are female
(62%) than female (38%). This shows that the six schools of the Mahatma Gandhi Institute
including the Rabindranath Tagore secondary school are dominated more by female than male. The
imbalance in gender raises doubt as to whether the leadership styles applied in these secondary
schools is gender sensitive. The nature of leadership imposed by leaders in these schools favours
female more than male and hence giving a different working environment to male educators.
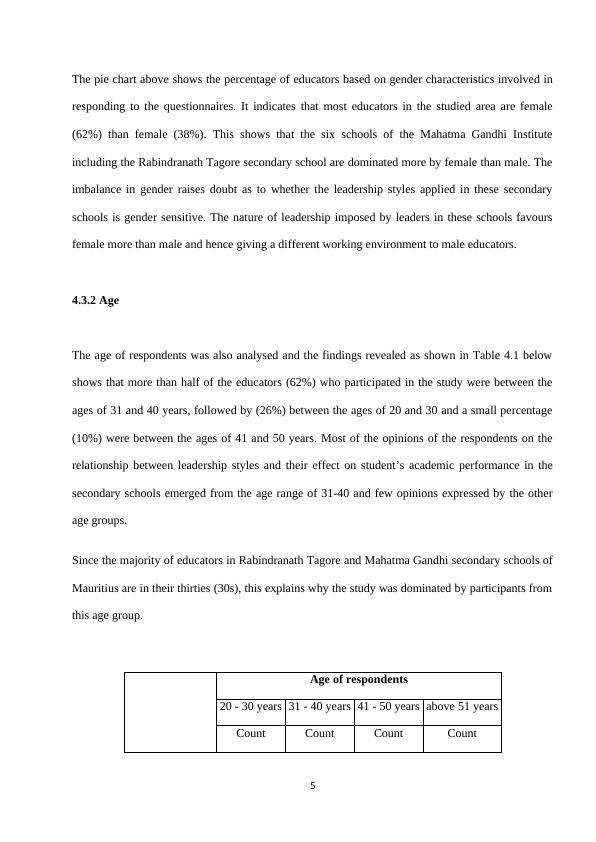
4.3.2 Age
The age of respondents was also analysed and the findings revealed as shown in Table 4.1 below
shows that more than half of the educators (62%) who participated in the study were between the
ages of 31 and 40 years, followed by (26%) between the ages of 20 and 30 and a small percentage
(10%) were between the ages of 41 and 50 years. Most of the opinions of the respondents on the
relationship between leadership styles and their effect on student’s academic performance in the
secondary schools emerged from the age range of 31-40 and few opinions expressed by the other
age groups.
Since the majority of educators in Rabindranath Tagore and Mahatma Gandhi secondary schools of
Mauritius are in their thirties (30s), this explains why the study was dominated by participants from
this age group.
Age of respondents
20 - 30 years 31 - 40 years 41 - 50 years above 51 years
Count Count Count Count
5
responding to the questionnaires. It indicates that most educators in the studied area are female
(62%) than female (38%). This shows that the six schools of the Mahatma Gandhi Institute
including the Rabindranath Tagore secondary school are dominated more by female than male. The
imbalance in gender raises doubt as to whether the leadership styles applied in these secondary
schools is gender sensitive. The nature of leadership imposed by leaders in these schools favours
female more than male and hence giving a different working environment to male educators.
4.3.2 Age
The age of respondents was also analysed and the findings revealed as shown in Table 4.1 below
shows that more than half of the educators (62%) who participated in the study were between the
ages of 31 and 40 years, followed by (26%) between the ages of 20 and 30 and a small percentage
(10%) were between the ages of 41 and 50 years. Most of the opinions of the respondents on the
relationship between leadership styles and their effect on student’s academic performance in the
secondary schools emerged from the age range of 31-40 and few opinions expressed by the other
age groups.
Since the majority of educators in Rabindranath Tagore and Mahatma Gandhi secondary schools of
Mauritius are in their thirties (30s), this explains why the study was dominated by participants from
this age group.
Age of respondents
20 - 30 years 31 - 40 years 41 - 50 years above 51 years
Count Count Count Count
5
Gender Male 12 20 4 2
Female 14 42 6 0
Table 4.1: Age of Respondents
4.3.3 Academic qualifications
The researcher also wanted to know the characteristics of respondents based on their level of
education. Table 4.2 below indicates the level of education of educators in Rabindranath Tagore
and Mahatma Gandhi secondary schools of Mauritius.
Level of Education Frequency (f) Percentage (%)
Diploma 1 1.0
Degree 31 31.0
Masters 58 58.0
PhD 2 2.0
Other 8 8.0
Total 100 100.0
Table 4.2: Frequencies and percentages of responses on the highest academic qualifications of
educators
Table 4.2 indicates the number of educators and their highest education levels in the six schools
under the Mahatma Gandhi Institute network. The study indicates that most of the educators in the
secondary schools under scrutiny in Mauritius hold a postgraduate qualification. They count for
6
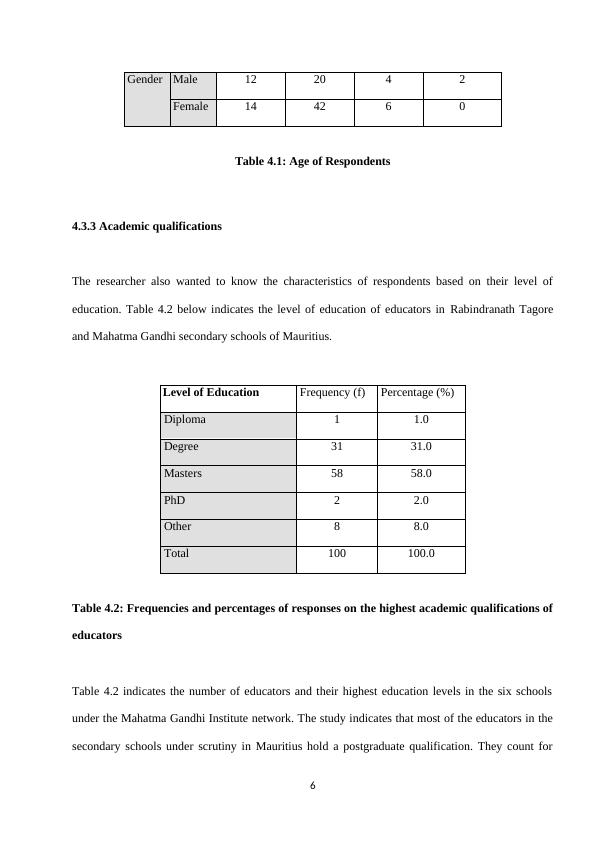
58%, followed by 31% for degree holders, 8% for other qualifications such LLB and PGCE, 2% for
PHD and 1% for diploma holder. This shows that the facts provided by educators on the leadership
styles are factual and living one as the majority of the respondents were of the postgraduate level of
education.
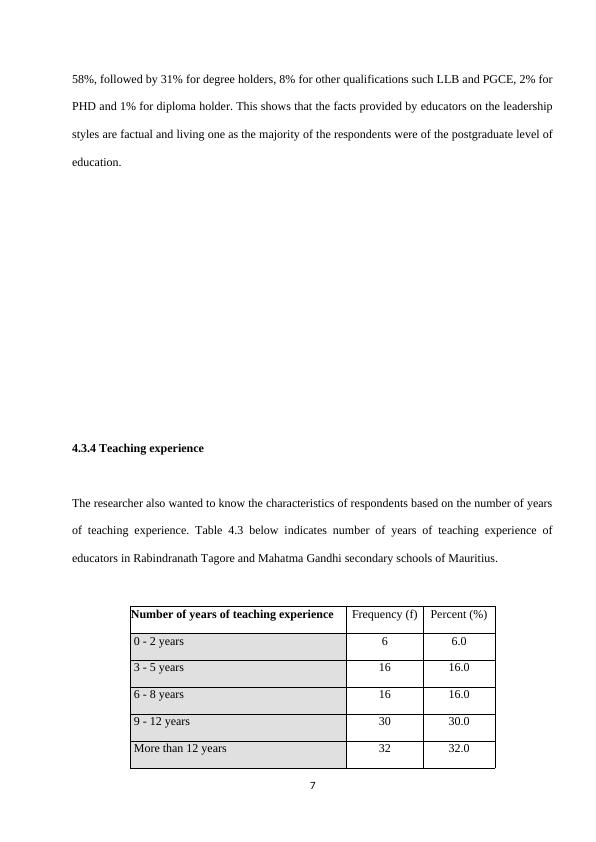
4.3.4 Teaching experience
The researcher also wanted to know the characteristics of respondents based on the number of years
of teaching experience. Table 4.3 below indicates number of years of teaching experience of
educators in Rabindranath Tagore and Mahatma Gandhi secondary schools of Mauritius.
Number of years of teaching experience Frequency (f) Percent (%)
0 - 2 years 6 6.0
3 - 5 years 16 16.0
6 - 8 years 16 16.0
9 - 12 years 30 30.0
More than 12 years 32 32.0
7
PHD and 1% for diploma holder. This shows that the facts provided by educators on the leadership
styles are factual and living one as the majority of the respondents were of the postgraduate level of
education.
4.3.4 Teaching experience
The researcher also wanted to know the characteristics of respondents based on the number of years
of teaching experience. Table 4.3 below indicates number of years of teaching experience of
educators in Rabindranath Tagore and Mahatma Gandhi secondary schools of Mauritius.
Number of years of teaching experience Frequency (f) Percent (%)
0 - 2 years 6 6.0
3 - 5 years 16 16.0
6 - 8 years 16 16.0
9 - 12 years 30 30.0
More than 12 years 32 32.0
7
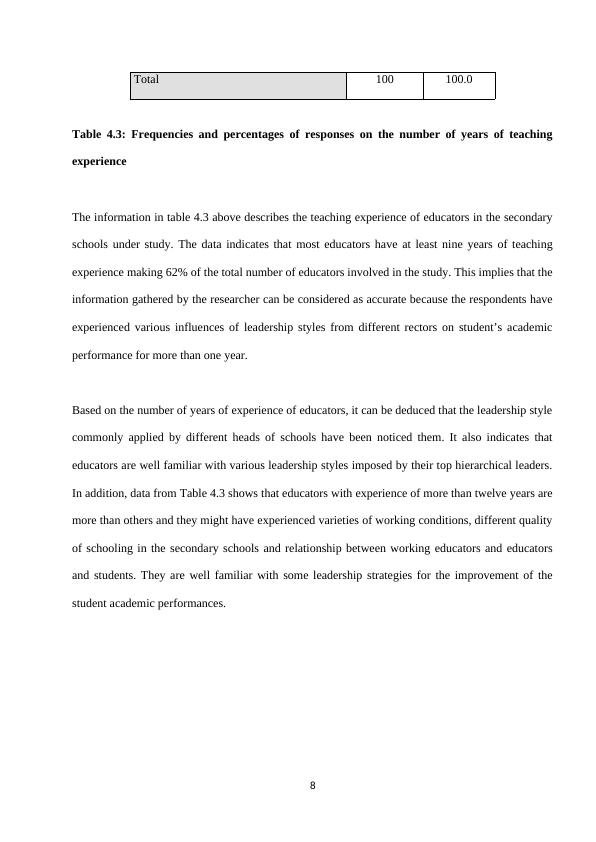
Total 100 100.0
Table 4.3: Frequencies and percentages of responses on the number of years of teaching
experience
The information in table 4.3 above describes the teaching experience of educators in the secondary
schools under study. The data indicates that most educators have at least nine years of teaching
experience making 62% of the total number of educators involved in the study. This implies that the
information gathered by the researcher can be considered as accurate because the respondents have
experienced various influences of leadership styles from different rectors on student’s academic
performance for more than one year.
Based on the number of years of experience of educators, it can be deduced that the leadership style
commonly applied by different heads of schools have been noticed them. It also indicates that
educators are well familiar with various leadership styles imposed by their top hierarchical leaders.
In addition, data from Table 4.3 shows that educators with experience of more than twelve years are
more than others and they might have experienced varieties of working conditions, different quality
of schooling in the secondary schools and relationship between working educators and educators
and students. They are well familiar with some leadership strategies for the improvement of the
student academic performances.
8
End of preview
Want to access all the pages? Upload your documents or become a member.
Related Documents
1. EFFECT OF MARKET SEGMENTATION, TARGETING AND POSITIOlg...
|56
|13300
|121
Personality Traits and Negotiation Style: Impact on Cultural Contextlg...
|5
|1109
|427