Data Analysis and Solution for FluffyGroCo's Business Challenge
VerifiedAdded on 2022/10/10
|18
|4235
|450
Report
AI Summary
This report presents an analysis of FluffyGroCo's business, focusing on the impact of Crackety Crickling infestation on Truffula tree plantations. The investigation utilizes exploratory data analysis (EDA) and chi-test techniques to examine nominal data, validate deterministic rules, and identify patterns related to infestation across different fields, rainy weather conditions, and temperatures. The analysis includes data cleaning, manipulation, and the generation of plots and summary statistics to understand the relationship between variables. The report also assesses the validity of a deterministic rule across different plantations (Nextafoo, Uptagoo, and Rondadoo) and explores potential solutions, such as the optimal planting month. Ethical and security considerations related to big data, including privacy and potential misuse of data, are also discussed. The findings suggest that September is the most suitable month for planting across all three fields, and organic larvae solutions could be beneficial. The report concludes with a discussion of ethical and security concerns related to big data practices.
Table of Contents
Assessment of FluffyGroCo’s business.....................................................................................2
Overview of investigation..........................................................................................................3
Analysis and results...................................................................................................................4
Nominal data analysis.......................................................................................................................4
Deterministic rule..............................................................................................................................7
Validating rule..................................................................................................................................9
Nextafoo...........................................................................................................................................9
Uptagoo...........................................................................................................................................10
Rondadoo........................................................................................................................................11
Ethical and security considerations..........................................................................................12
Potential solutions....................................................................................................................13
Technology Stack - Processing and Storage....................................................................................14
References................................................................................................................................16
Appendix..................................................................................................................................17
Statistics and methodology..............................................................................................................17
1
Paraphrase This Document
Need a fresh take? Get an instant paraphrase of this document with our AI Paraphraser
Assessment of FluffyGroCo’s business
FluffyGroCo has boosted green economy business by bringing Truffula trees back into
plantation. It harvests Truffula tree leaves to be used in organic textile industry. However, the
business has been impacted by the Crackety Crickling insect infestation which hardens
Truffula leaves and makes them inappropriate for textile production. FluffyGroCo has been
looking for organic solutions to the problem in order to avoid imbalance in the nature.
Among the alternate solutions, fostering bacteria production was a prominent option but it
has few critical issues. First, the timing of treatment is very crucial. A slight change in the
timing may lead to significant adverse effect on the leaves. Secondly, the cost of treatment is
very expensive and lastly, an excessive use of bacteria may threaten the survival of Lazy
Lossy Bears who feed off them. In order to come up with the best optimal solution with
minimum cost, the company has employed a team of biologists, geologists and chemists to
study the impact of different environment conditions which can lead to stunting of Crackety
Crickling larvae. They studied different parameters and concluded that risk of stunting can be
calculated with the help of deterministic rules i.e. if then else scenarios. Along with this,
company has also collected data on different environmental conditions. This data contains
date on which data is collected, field, infestation, rainy and temperature. To validate data, it is
matched with the data supplied by the volunteer farmers. Validation of data is the base of
data science. The collected data has 5479 entries which can be considered to infer
conclusions for the given the case and fulfil the critical aims. The dataset provides following
insights of the data:
Parameter “rainy” depicts that rain plays an important role determining the humidity
level which can foster or de-foster the larvae growth.
Parameter “temperature” shows that at which value along with rain can result in
infestation.
Parameter “field” shows depicts which type of Truffula tree gets affected when
temperature and rainy parameter have the favourable values.
Parameter “date” depicts the date on which data is collected (Pierson and Porway,
2017).
Data science plays an important role in studying the data from statistical point of view. It is a
new and full of capabilities acting as a frontier to allow users to make prediction-based
decisions faster and accurately. It extends and enhances the human perception and
comprehension. It will help in predicting the key factors responsible for infestation and
2
potential solutions which can be implemented without affecting the natural balance of the
field.
It can be observed that data has a date column which is an important field in data science
field. It can predict which month, day or year has maximum infestation with corresponding
value of rain and temperature. The investigation shall include data cleaning, data
manipulating, application of exploratory data analysis techniques to explore the data,
validating the given deterministic rule, validating the rule for Nextafoo and Uptagoo and
finally framing potential solutions. EDA application shall include studying relationship
between variables, generating plots using bar chart or pivot tables. It will also include
generating summary statistics. The dataset has three nominal values columns i.e. field, rainy
and infestation. To study relationship among them and other columns chi test and correlation
techniques shall be used.
Overview of investigation
The investigation was conducted using EDA (Exploratory Data Analysis) and chi-test
techniques. The main step of data science is to first clean data i.e. to search whether the data
is in correct format, remove duplicates, replacing NaN format data, etc. The given dataset
was first of all analysed to check whether entire is in appropriate format such as date column
had few entries which were not in DATE format. Then “rainy” and “infestation” columns
were checked whether they have integer values in 0 or 1 only. “Field” column was checked
whether it has any blank entry or any data other than the three names of the plantations.
Second step was to explore the data to find out trends or patterns in the data. Firstly, an
observation was made about nominal data. All three columns – FIELD, RAINY and
INFESTATON contain nominal data. The deterministic rule in the scenario was framed only
for Rondadoo plantation. In order to find out whether there is any relationship among these
nominal data columns, chi test could only be used. Hence, firstly chi test “p” parameter was
calculated in which the null hypothesis got rejected because the value of “p” came out to be
more than the 0.05. Then, relationship with TEMPERATURE value was to be found out as
per the deterministic rule. Since Temperature column does not contain any nominal data, chi
test could not be conducted for it. Hence, correlation method was used to find out relationship
between the infestation of plantation. The value came out to be +0.7 which established that
there is a strong uphill linear relationship between these two values. Next step was to figure
out level of infestation in different months of the year to find out which months witness high
infestation with or without rainy weather. Along with this, it was crucial analyse plantation
3
⊘ This is a preview!⊘
Do you want full access?
Subscribe today to unlock all pages.
Trusted by 1+ million students worldwide
growth in extreme condition months i.e. with very high temperature or very low temperature.
Such months shall not be favourable for plantation of any type.
Analysis and results
The investigation started with preparation of data. Firstly, check for duplicates was carried
but there was duplicates. Format of date seems to be same in all the entries i.e. in dd/mm/yy.
However, there are some dates which are in ‘General’ format. They are first processed using
‘Text-to-column’ option under ‘Data’ tab of excel and then the format is kept as DD-MMM-
YY.
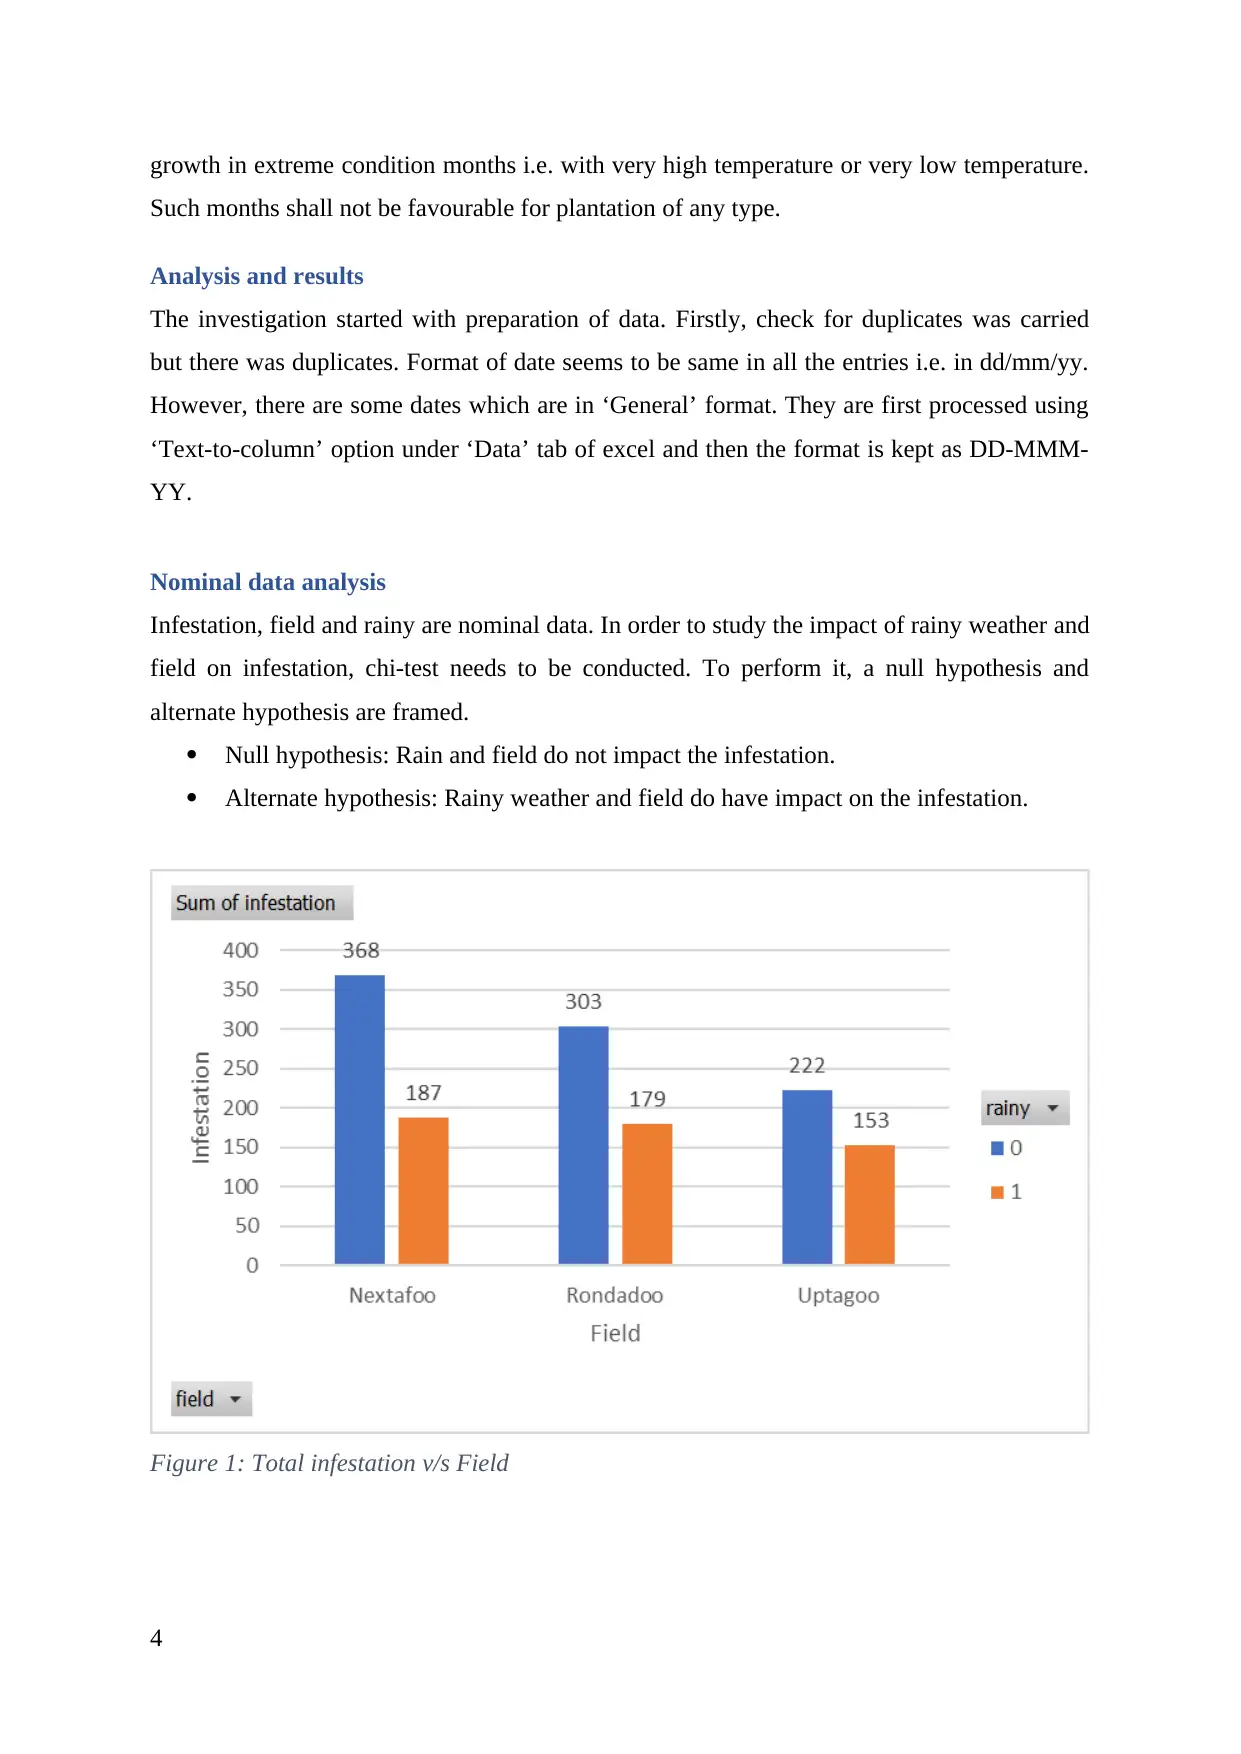
Nominal data analysis
Infestation, field and rainy are nominal data. In order to study the impact of rainy weather and
field on infestation, chi-test needs to be conducted. To perform it, a null hypothesis and
alternate hypothesis are framed.
Null hypothesis: Rain and field do not impact the infestation.
Alternate hypothesis: Rainy weather and field do have impact on the infestation.
Figure 1: Total infestation v/s Field
4
Such months shall not be favourable for plantation of any type.
Analysis and results
The investigation started with preparation of data. Firstly, check for duplicates was carried
but there was duplicates. Format of date seems to be same in all the entries i.e. in dd/mm/yy.
However, there are some dates which are in ‘General’ format. They are first processed using
‘Text-to-column’ option under ‘Data’ tab of excel and then the format is kept as DD-MMM-
YY.
Nominal data analysis
Infestation, field and rainy are nominal data. In order to study the impact of rainy weather and
field on infestation, chi-test needs to be conducted. To perform it, a null hypothesis and
alternate hypothesis are framed.
Null hypothesis: Rain and field do not impact the infestation.
Alternate hypothesis: Rainy weather and field do have impact on the infestation.
Figure 1: Total infestation v/s Field
4
Paraphrase This Document
Need a fresh take? Get an instant paraphrase of this document with our AI Paraphraser
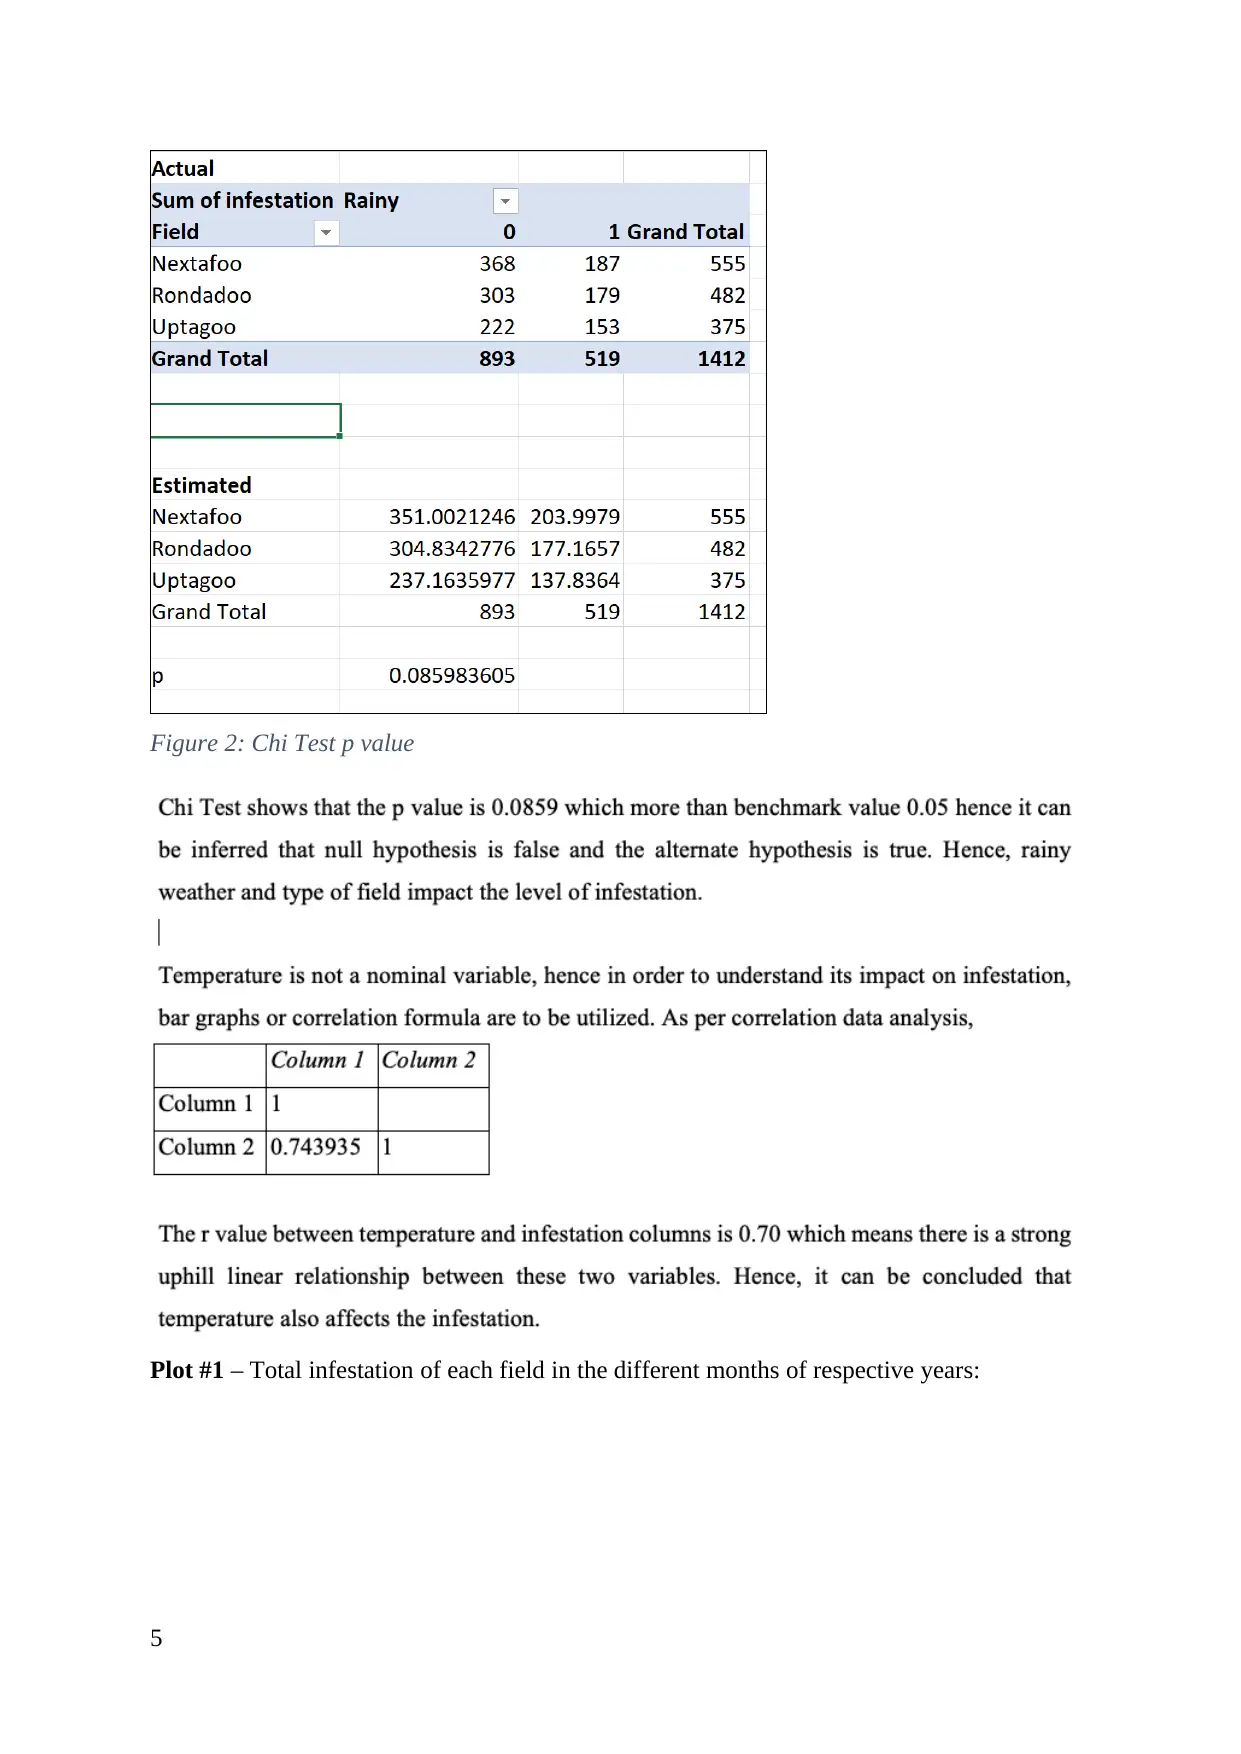
Figure 2: Chi Test p value
Plot #1 – Total infestation of each field in the different months of respective years:
5
Plot #1 – Total infestation of each field in the different months of respective years:
5
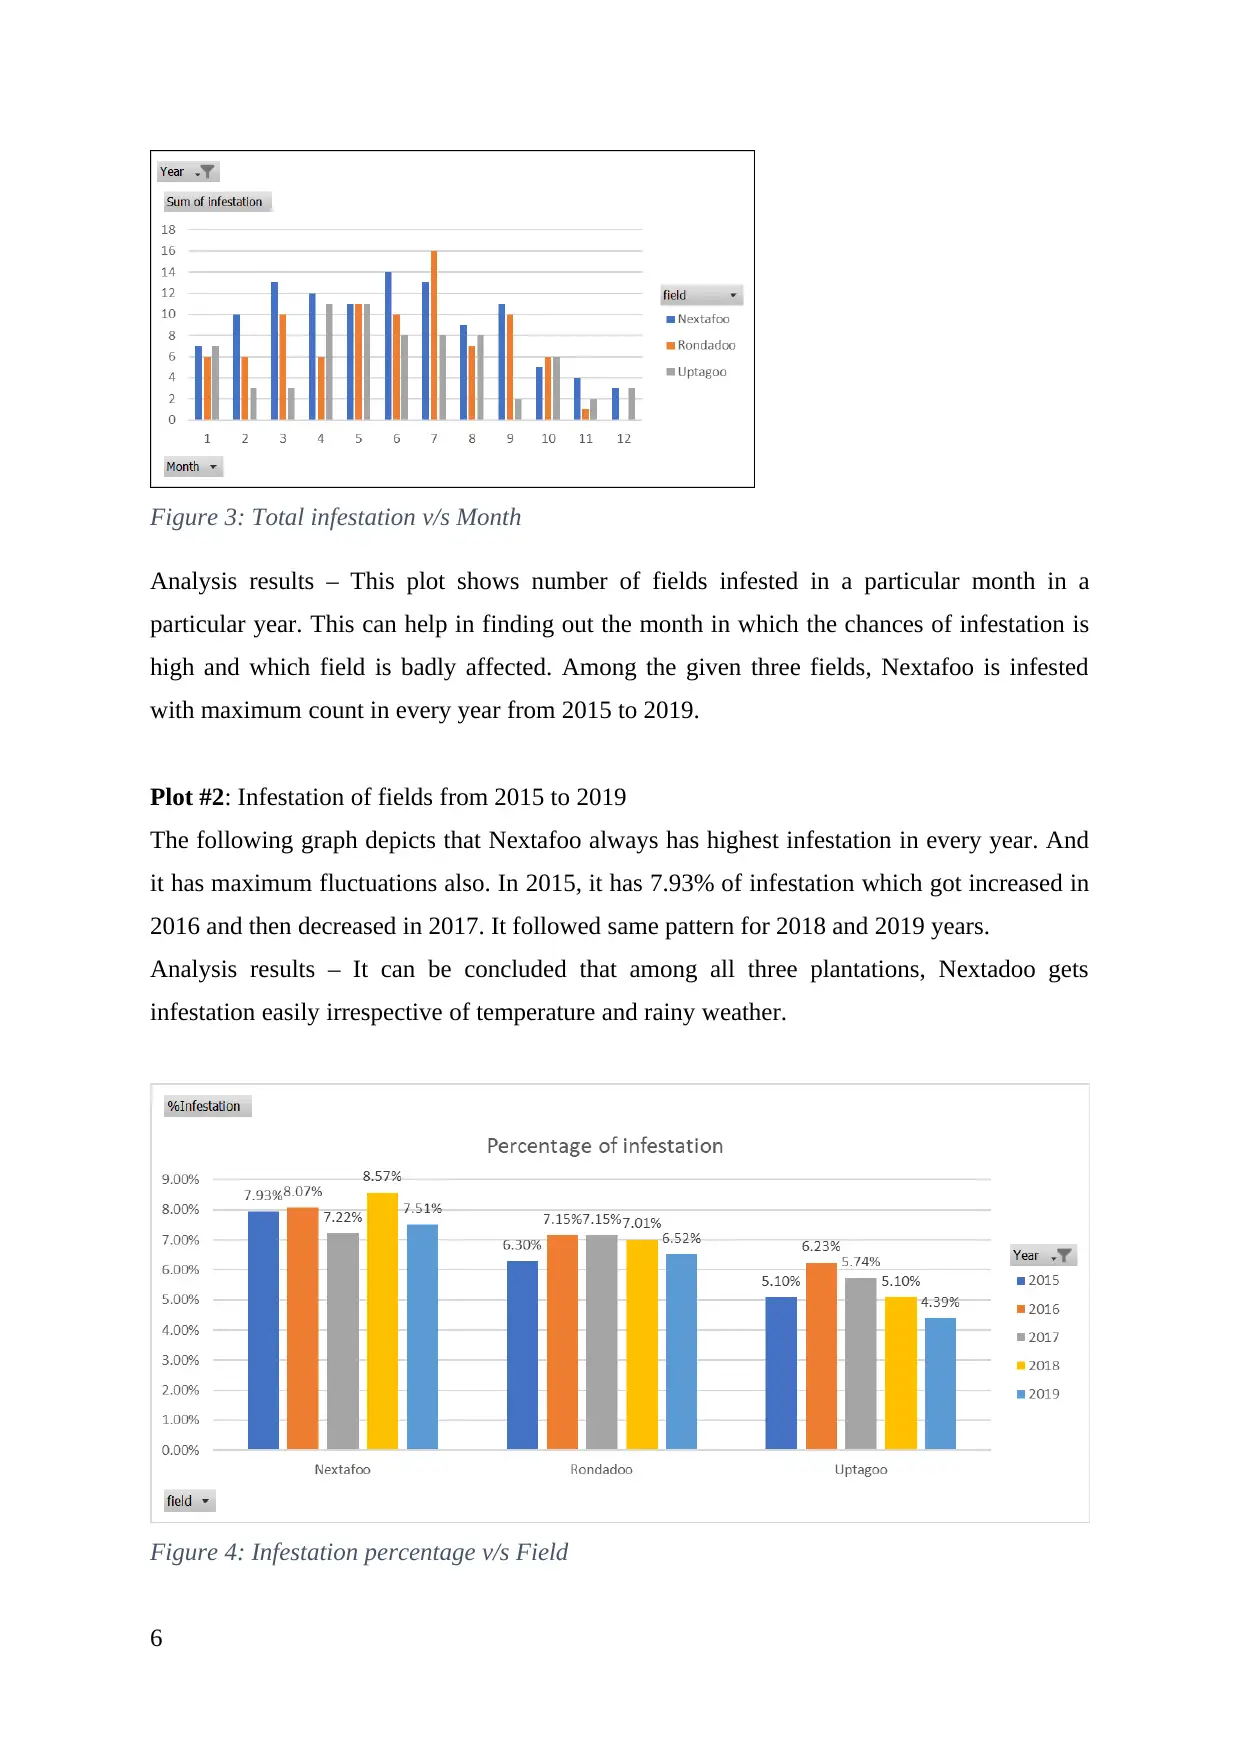
Figure 3: Total infestation v/s Month
Analysis results – This plot shows number of fields infested in a particular month in a
particular year. This can help in finding out the month in which the chances of infestation is
high and which field is badly affected. Among the given three fields, Nextafoo is infested
with maximum count in every year from 2015 to 2019.
Plot #2: Infestation of fields from 2015 to 2019
The following graph depicts that Nextafoo always has highest infestation in every year. And
it has maximum fluctuations also. In 2015, it has 7.93% of infestation which got increased in
2016 and then decreased in 2017. It followed same pattern for 2018 and 2019 years.
Analysis results – It can be concluded that among all three plantations, Nextadoo gets
infestation easily irrespective of temperature and rainy weather.
Figure 4: Infestation percentage v/s Field
6
⊘ This is a preview!⊘
Do you want full access?
Subscribe today to unlock all pages.
Trusted by 1+ million students worldwide
Deterministic rule
7
7
Paraphrase This Document
Need a fresh take? Get an instant paraphrase of this document with our AI Paraphraser
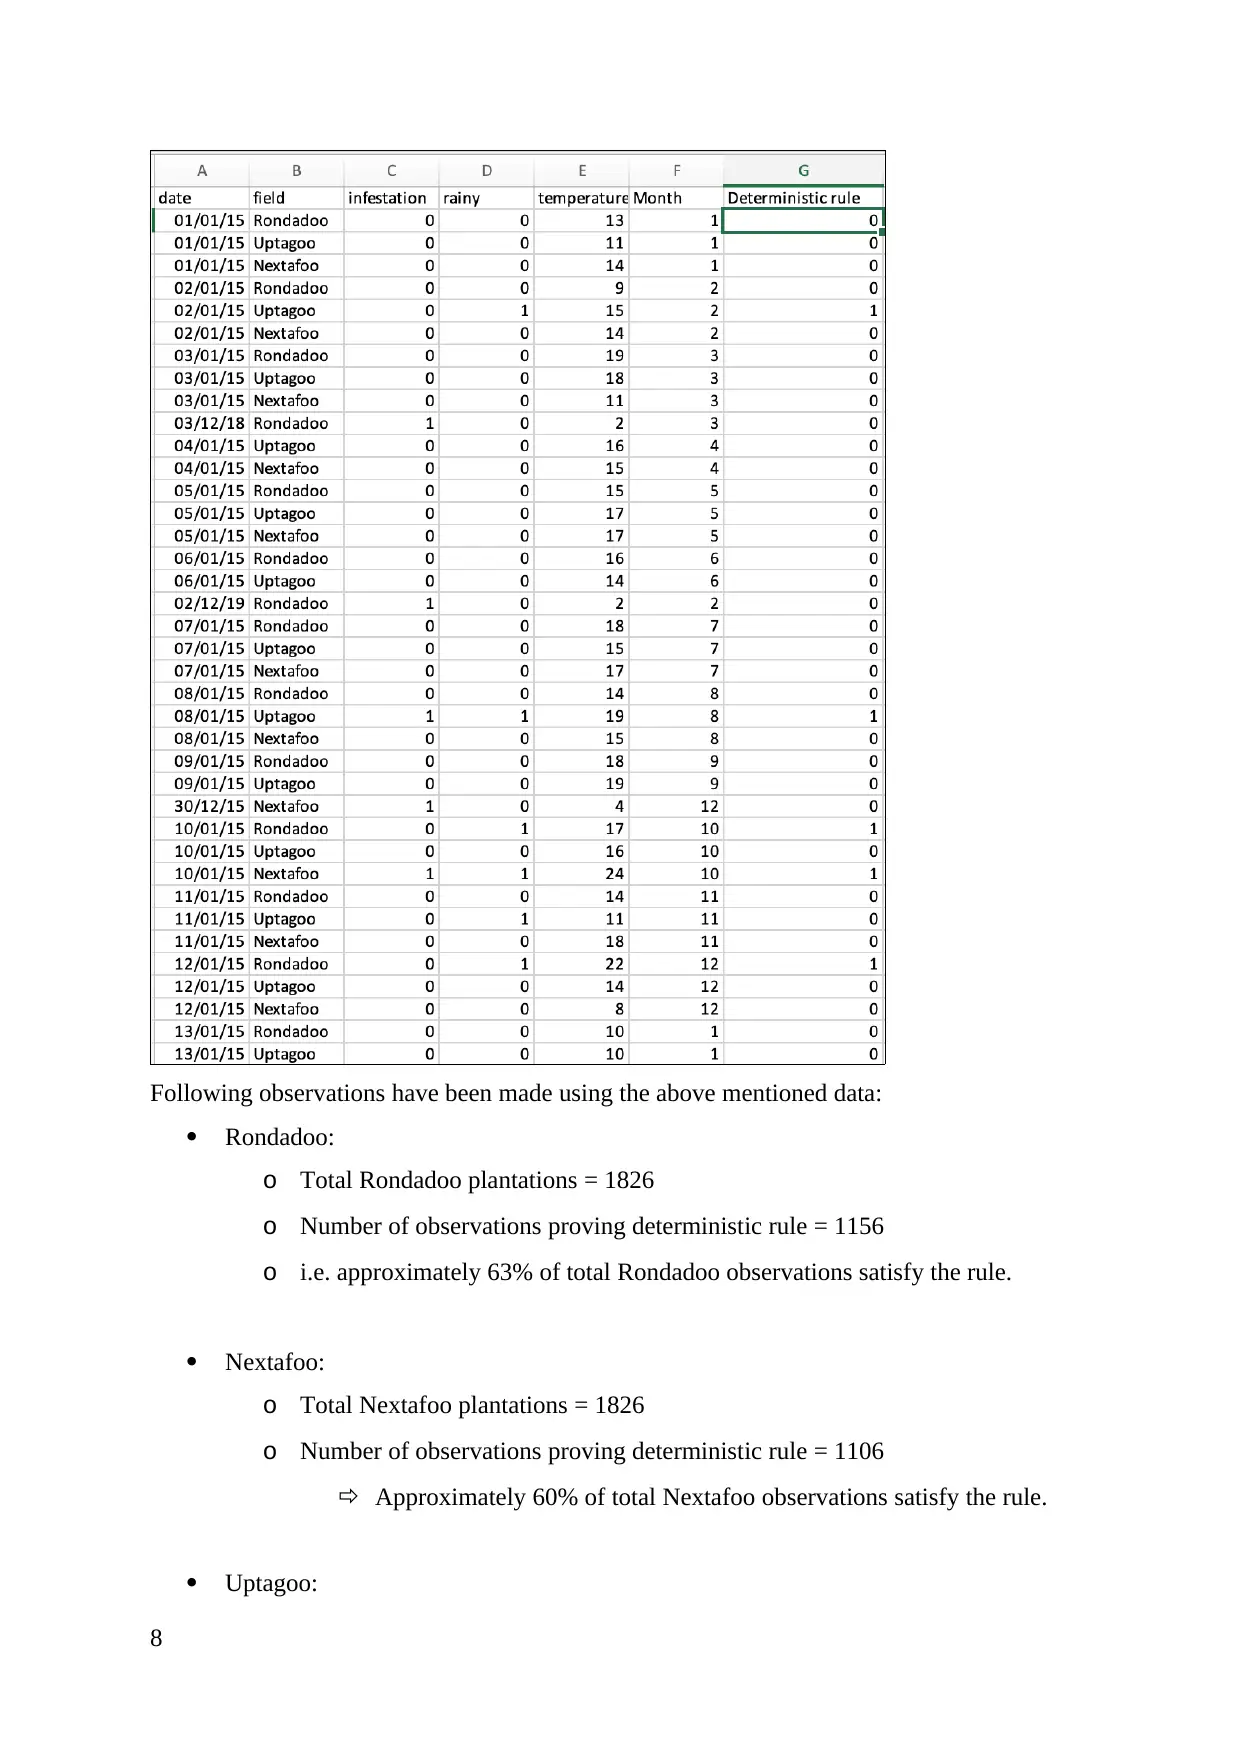
Following observations have been made using the above mentioned data:
Rondadoo:
o Total Rondadoo plantations = 1826
o Number of observations proving deterministic rule = 1156
o i.e. approximately 63% of total Rondadoo observations satisfy the rule.
Nextafoo:
o Total Nextafoo plantations = 1826
o Number of observations proving deterministic rule = 1106
Approximately 60% of total Nextafoo observations satisfy the rule.
Uptagoo:
8
o Total Uptagoo plantations = 1826
o Number of observations proving deterministic rule = 980
o i.e. approximately 53% of total Uptagoo observations satisfy the rule.
It can be inferred that deterministic rule can be applied to rest of the plantations but on
average this rule proves to be valid for 50% of Nextafoo and Uptagoo.
Validating rule
Nextafoo
It becomes essential to study the pattern for those observations where the rule does not give
valid results. It was observed that whether the weather is rainy or not, there is no infestation
in May month of any year.
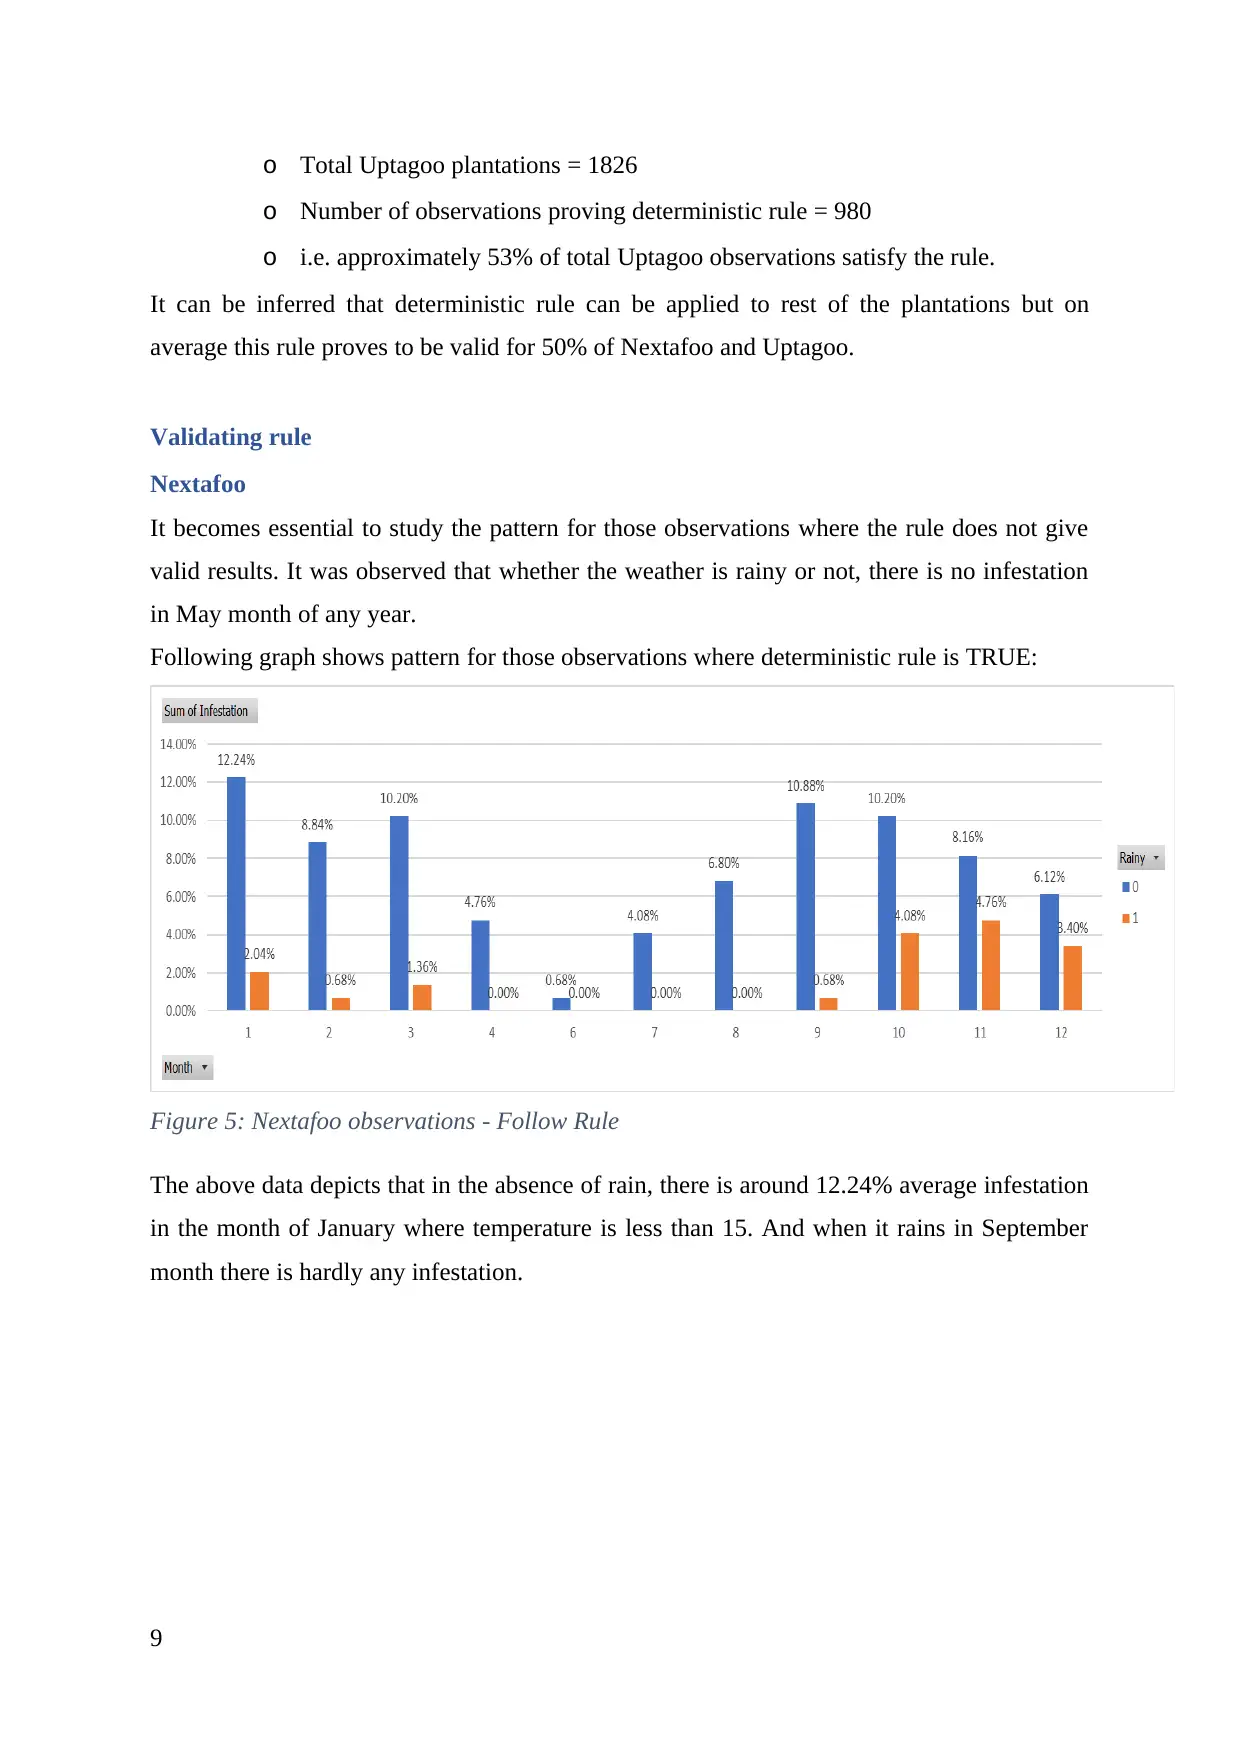
Following graph shows pattern for those observations where deterministic rule is TRUE:
Figure 5: Nextafoo observations - Follow Rule
The above data depicts that in the absence of rain, there is around 12.24% average infestation
in the month of January where temperature is less than 15. And when it rains in September
month there is hardly any infestation.
9
o Number of observations proving deterministic rule = 980
o i.e. approximately 53% of total Uptagoo observations satisfy the rule.
It can be inferred that deterministic rule can be applied to rest of the plantations but on
average this rule proves to be valid for 50% of Nextafoo and Uptagoo.
Validating rule
Nextafoo
It becomes essential to study the pattern for those observations where the rule does not give
valid results. It was observed that whether the weather is rainy or not, there is no infestation
in May month of any year.
Following graph shows pattern for those observations where deterministic rule is TRUE:
Figure 5: Nextafoo observations - Follow Rule
The above data depicts that in the absence of rain, there is around 12.24% average infestation
in the month of January where temperature is less than 15. And when it rains in September
month there is hardly any infestation.
9
⊘ This is a preview!⊘
Do you want full access?
Subscribe today to unlock all pages.
Trusted by 1+ million students worldwide
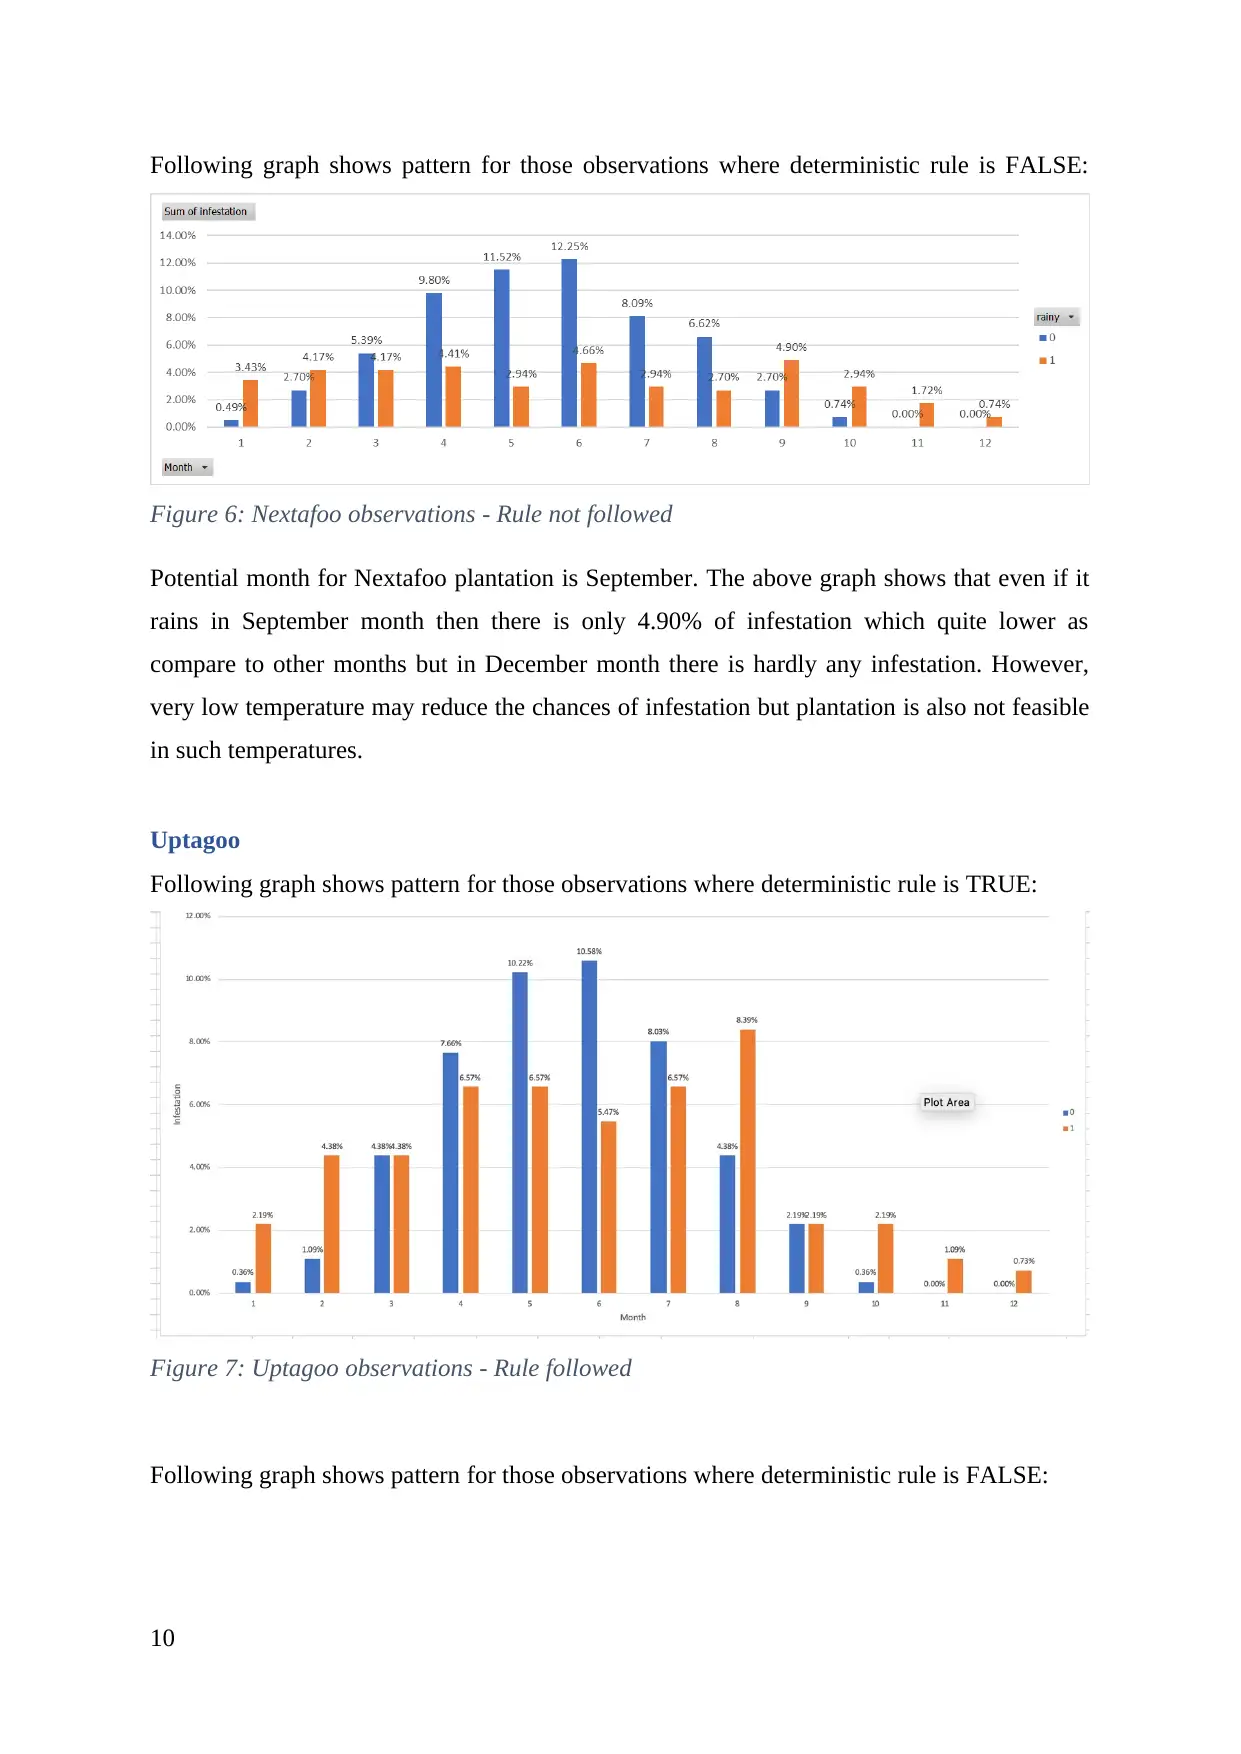
Following graph shows pattern for those observations where deterministic rule is FALSE:
Figure 6: Nextafoo observations - Rule not followed
Potential month for Nextafoo plantation is September. The above graph shows that even if it
rains in September month then there is only 4.90% of infestation which quite lower as
compare to other months but in December month there is hardly any infestation. However,
very low temperature may reduce the chances of infestation but plantation is also not feasible
in such temperatures.
Uptagoo
Following graph shows pattern for those observations where deterministic rule is TRUE:
Figure 7: Uptagoo observations - Rule followed
Following graph shows pattern for those observations where deterministic rule is FALSE:
10
Paraphrase This Document
Need a fresh take? Get an instant paraphrase of this document with our AI Paraphraser
1 2 3 4 7 8 9 10 11 12
0.00%
2.00%
4.00%
6.00%
8.00%
10.00%
12.00%
14.00%
16.00% 13.86%
7.92% 8.91%
3.96%
0.99%
7.92%
11.88%
13.86%
8.91% 7.92%
0.99% 0.99% 0.00% 0.00% 0.00% 0.00% 0.00%
4.95%
1.98%
4.95%
0
1
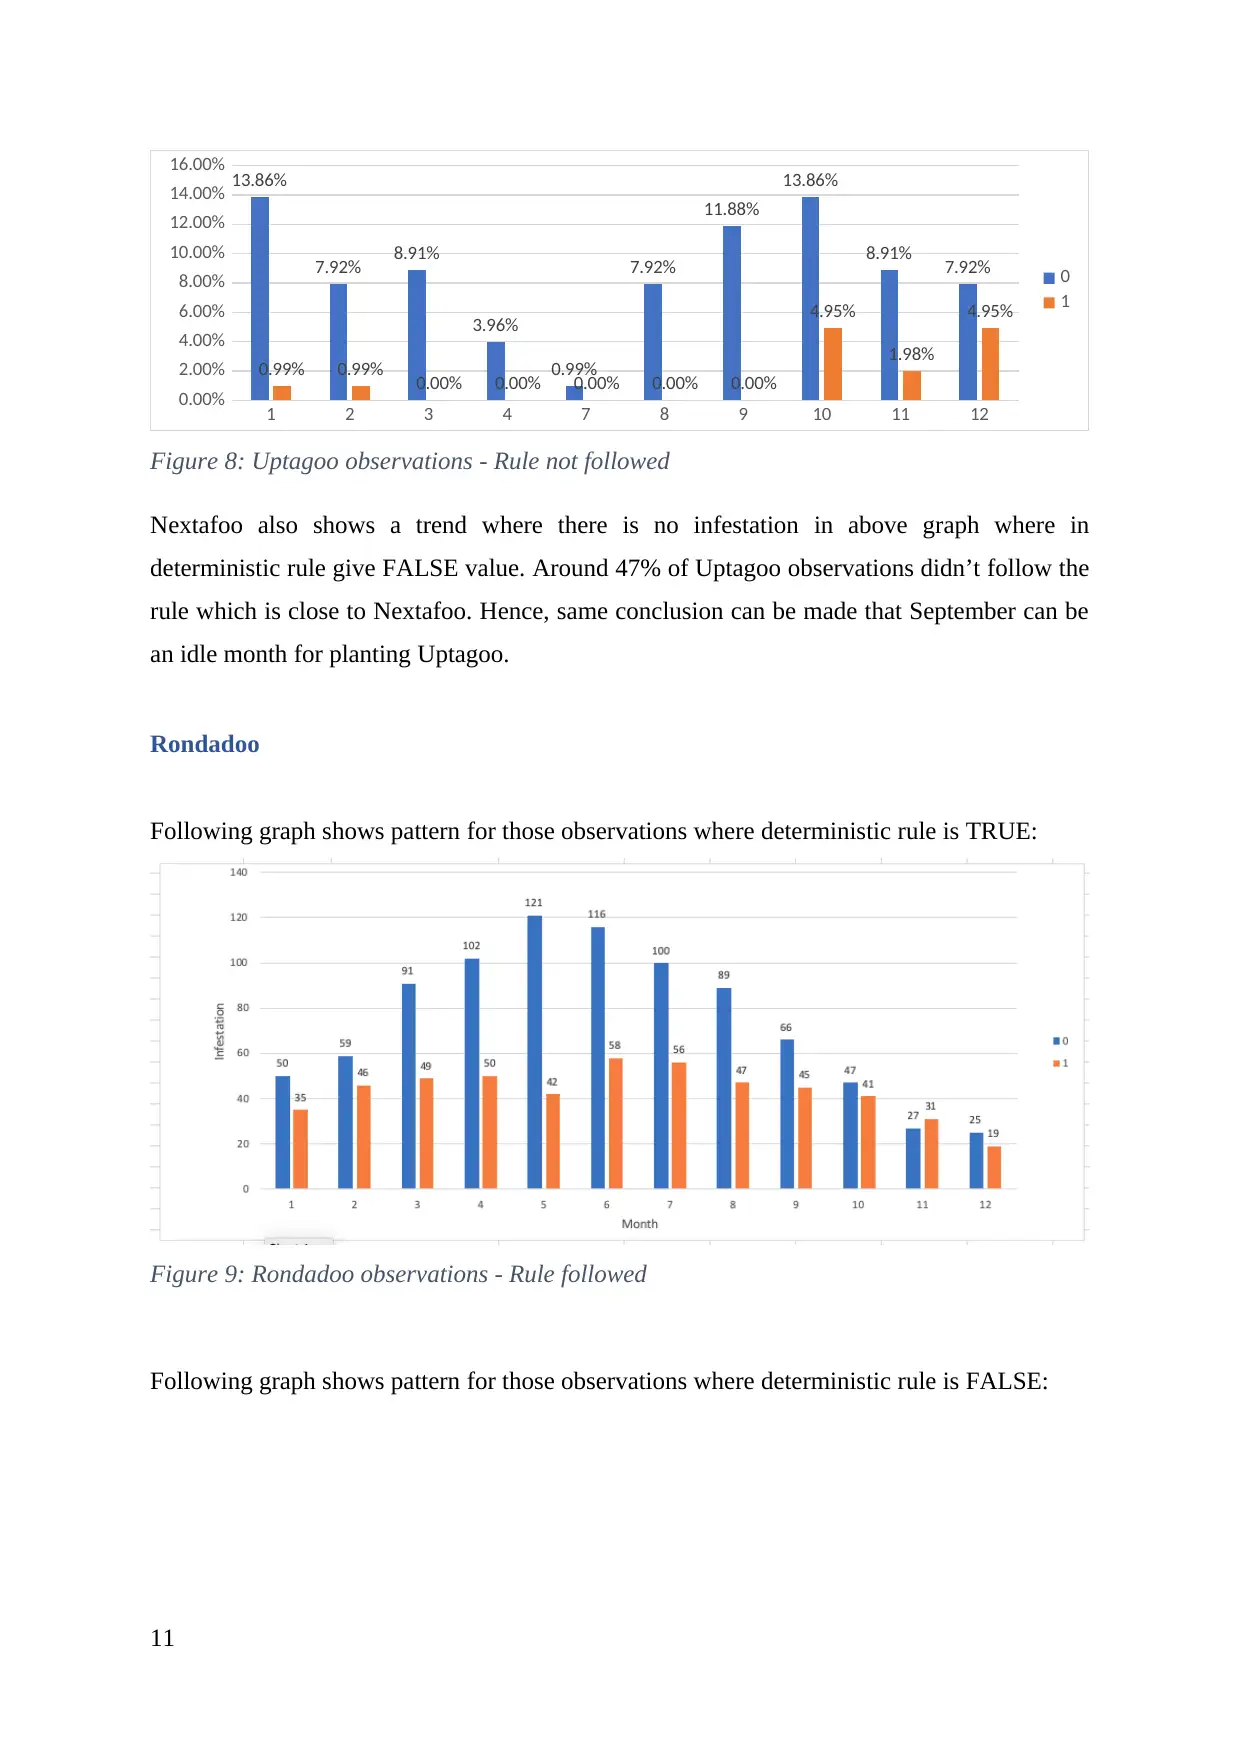
Figure 8: Uptagoo observations - Rule not followed
Nextafoo also shows a trend where there is no infestation in above graph where in
deterministic rule give FALSE value. Around 47% of Uptagoo observations didn’t follow the
rule which is close to Nextafoo. Hence, same conclusion can be made that September can be
an idle month for planting Uptagoo.
Rondadoo
Following graph shows pattern for those observations where deterministic rule is TRUE:
Figure 9: Rondadoo observations - Rule followed
Following graph shows pattern for those observations where deterministic rule is FALSE:
11
0.00%
2.00%
4.00%
6.00%
8.00%
10.00%
12.00%
14.00%
16.00% 13.86%
7.92% 8.91%
3.96%
0.99%
7.92%
11.88%
13.86%
8.91% 7.92%
0.99% 0.99% 0.00% 0.00% 0.00% 0.00% 0.00%
4.95%
1.98%
4.95%
0
1
Figure 8: Uptagoo observations - Rule not followed
Nextafoo also shows a trend where there is no infestation in above graph where in
deterministic rule give FALSE value. Around 47% of Uptagoo observations didn’t follow the
rule which is close to Nextafoo. Hence, same conclusion can be made that September can be
an idle month for planting Uptagoo.
Rondadoo
Following graph shows pattern for those observations where deterministic rule is TRUE:
Figure 9: Rondadoo observations - Rule followed
Following graph shows pattern for those observations where deterministic rule is FALSE:
11
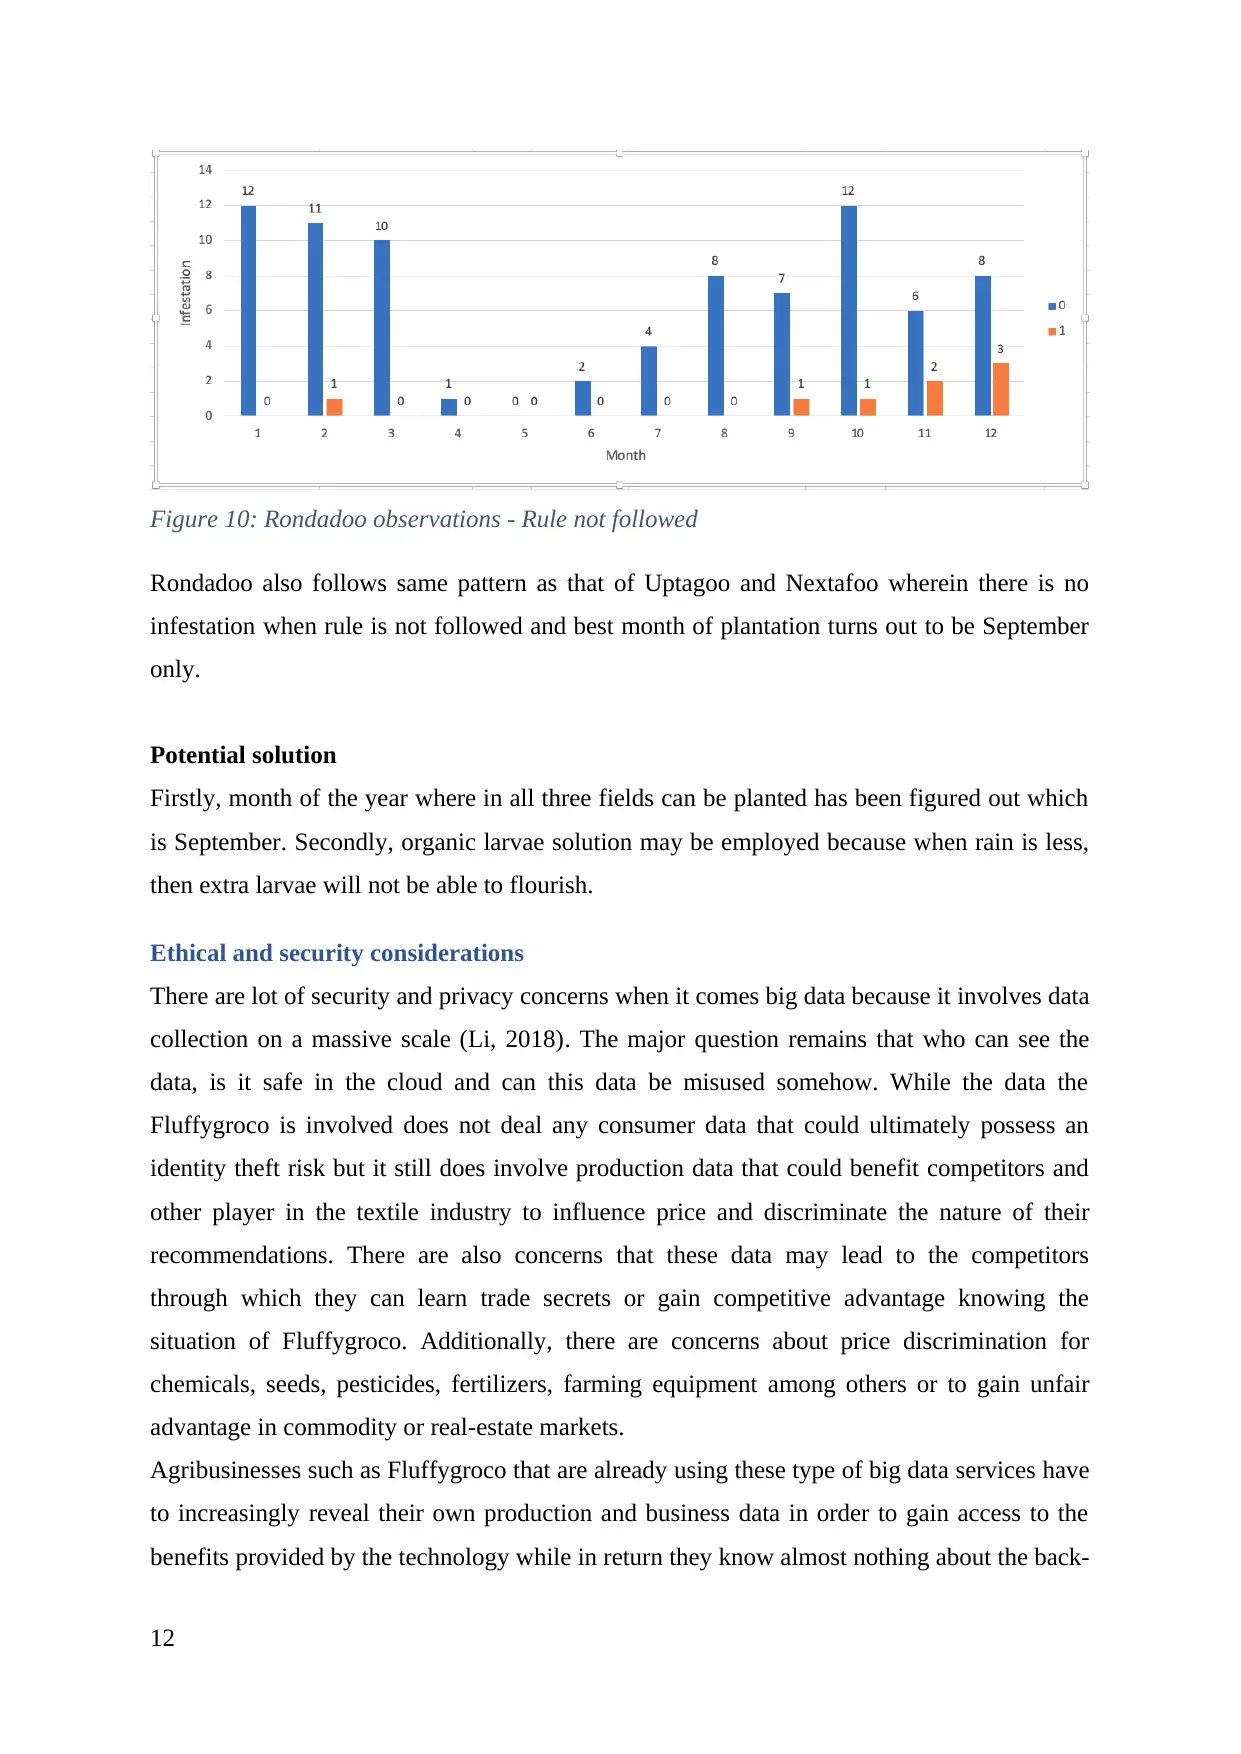
Figure 10: Rondadoo observations - Rule not followed
Rondadoo also follows same pattern as that of Uptagoo and Nextafoo wherein there is no
infestation when rule is not followed and best month of plantation turns out to be September
only.
Potential solution
Firstly, month of the year where in all three fields can be planted has been figured out which
is September. Secondly, organic larvae solution may be employed because when rain is less,
then extra larvae will not be able to flourish.
Ethical and security considerations
There are lot of security and privacy concerns when it comes big data because it involves data
collection on a massive scale (Li, 2018). The major question remains that who can see the
data, is it safe in the cloud and can this data be misused somehow. While the data the
Fluffygroco is involved does not deal any consumer data that could ultimately possess an
identity theft risk but it still does involve production data that could benefit competitors and
other player in the textile industry to influence price and discriminate the nature of their
recommendations. There are also concerns that these data may lead to the competitors
through which they can learn trade secrets or gain competitive advantage knowing the
situation of Fluffygroco. Additionally, there are concerns about price discrimination for
chemicals, seeds, pesticides, fertilizers, farming equipment among others or to gain unfair
advantage in commodity or real-estate markets.
Agribusinesses such as Fluffygroco that are already using these type of big data services have
to increasingly reveal their own production and business data in order to gain access to the
benefits provided by the technology while in return they know almost nothing about the back-
12
⊘ This is a preview!⊘
Do you want full access?
Subscribe today to unlock all pages.
Trusted by 1+ million students worldwide
1 out of 18
Related Documents


Your All-in-One AI-Powered Toolkit for Academic Success.
+13062052269
info@desklib.com
Available 24*7 on WhatsApp / Email
![[object Object]](/_next/static/media/star-bottom.7253800d.svg)
Unlock your academic potential
Copyright © 2020–2025 A2Z Services. All Rights Reserved. Developed and managed by ZUCOL.