Risk and Legal Issues Faced by Tata Motors: A Business Overview
VerifiedAdded on 2023/06/13
|11
|3268
|70
AI Summary
This article provides an overview of Tata Motors, including its years in business, employee strength, governance structure, business structure, market value, profitability, competition, and key stakeholders. It also discusses the major risk factors faced by the automotive industry and how Tata Motors is addressing them.
Contribute Materials
Your contribution can guide someone’s learning journey. Share your
documents today.
RISK AND LEGAL ISSUES
PART – 1: EXECUTIVE SUMMARY
Tata Group, founded in 1868, employs over 660,000 people and has revenue of
103billion rupees of which Tata Motors’ contribution is 24,000 manpower and turnover
exceeding 26billion rupees (Lala, 2007). Tata group is managed and owned by the
majority stakeholder (36%) Tata Sons Ltd. through a chain of Family Trusts. The other
big stakeholder is LIC of India (6%) and some private investing companies holding
nearly 10% stake in the group. The balance (48%) is owned by the general public
through equity shares (Casey, 2014).
Tata Motors has been experiencing difficult years as its investment potential was
curtailed because of heavy funds locked in the development of NANO, a dream car of
its Chairman Ratan Tata for the common man of India and a decline in profits due to
decline in global market demands (Casey, 2014). Risks faced by the company have been
majorly attributed to some legal battles which the company faced leading to closure or
shifting of a couple of manufacturing units (Bhat, 2013). The company also had to face
a management battle at the highest level of management, when its erstwhile Chairman
Cyrus Mistry was forced to step down for not steering the group back to normalcy after
a drop in sales and profits (Surekha & Krishnaiah, 2015).
PART – 2: COMPANY OVERVIEW
(a) Years in Business / Employee Strength
Tata Group was founded in 1868 and in 1874 it started its textile manufacturing unit and
steel manufacturing in 1907 (May (ed), 2012). On 1 September 1945, Tata
Sons Limited, the holding company of the group, started the automotive business (Tata
Engineering and Locomotive Co. Ltd. – TELCO) with manufacturing steam locomotive
boilers by purchasing the East Indian Railways from the then British Government of
India (Surekha & Krishnaiah, 2015). Presently, the group’s output is 103billion INR
through its 660,000 employees and Tata Motors Ltd., employing over 24,000 people,
Secure Best Marks with AI Grader
Need help grading? Try our AI Grader for instant feedback on your assignments.
is the number one vehicle manufacturer of India, being the first Engineering Sector
Company from India to be listed on the New York Stock Exchange (Casey, 2014).
(b) Governance Structure
Tata Group, controlled by Tata Sons Ltd., was founded in 1868 by Sir Jamsetji Tata and
managed by him till 1945 when the control were taken over his son J.R.D. Tata who
managed the group from 1945 to 1973 (Pandey, 2015). Sumand Moolgaokar remained
at the helm from 1973 to 1988 and successfully expanded the manufacturing of
automotive in India (Manna & Chakraborti, 2010). In 1991, Ratan Tata took the reins of
the Tata Group from his uncle and rook the group to new heights (Ashwathappa,
2010). The consolidation of the group by Ratan Tata made it the largest manufacturer
of Steel and Motors (Tulder et al (ed), 2016). Presently, Tata Motors manufactures light,
medium and heavy commercial vehicles, multi-utility vehicles and passenger cars
(Pandey, 2015).
(c) Business Structure
Tata Motors success has been based on its supply chain excellence. Tata Motors has
been committed to its excellent backend supply chain network and has been working
closely with the suppliers when arriving at the costing of its products, to the extent that
it completes the functional specifications of the products much before taking the
products to the markets (Manna & Chakraborti, 2010). Tata Motors have remained
focused on the local conditions and have been designing their cars keeping in view the
needs of its customers instead of imposing any advanced but useless engineering on
them (Goel, 2014).
(d) Business Operating Scope
Tata Motors uses Ariba, a software based platform which helps the management to
considerably reduce bottom line costs (Banerjee, 2017). Tata Motors remains a modest
company when it considers its spending targets as one of the primary objectives of the
Tata Group has been to achieve high operational efficiencies at lowest costs (Banerjee,
2017). Tata Motors extensively uses Information Technology including CAD, CAM,
SIEBEL and SAP for Customer Network Management and Supply Chain Management
under the compliance framework of ISO20000:2005 standards (Banerjee, 2017).
(e) Market Value and Profitability-Last 5 Years
Tata Motors is primarily a Business-to-Consumer Company (B2C). In the last five
years, the company has taken considerable investment risks by investing heavily in its
NANO Project (Brigham & Ehrhardt, 2016). This dream project of Ratan Tata of a low-
cost car for the common man of India was the second successful venture of the Tata
Group after the launch of its fully indigenous INDICA car (Das, 2013) (Nag, 2015).
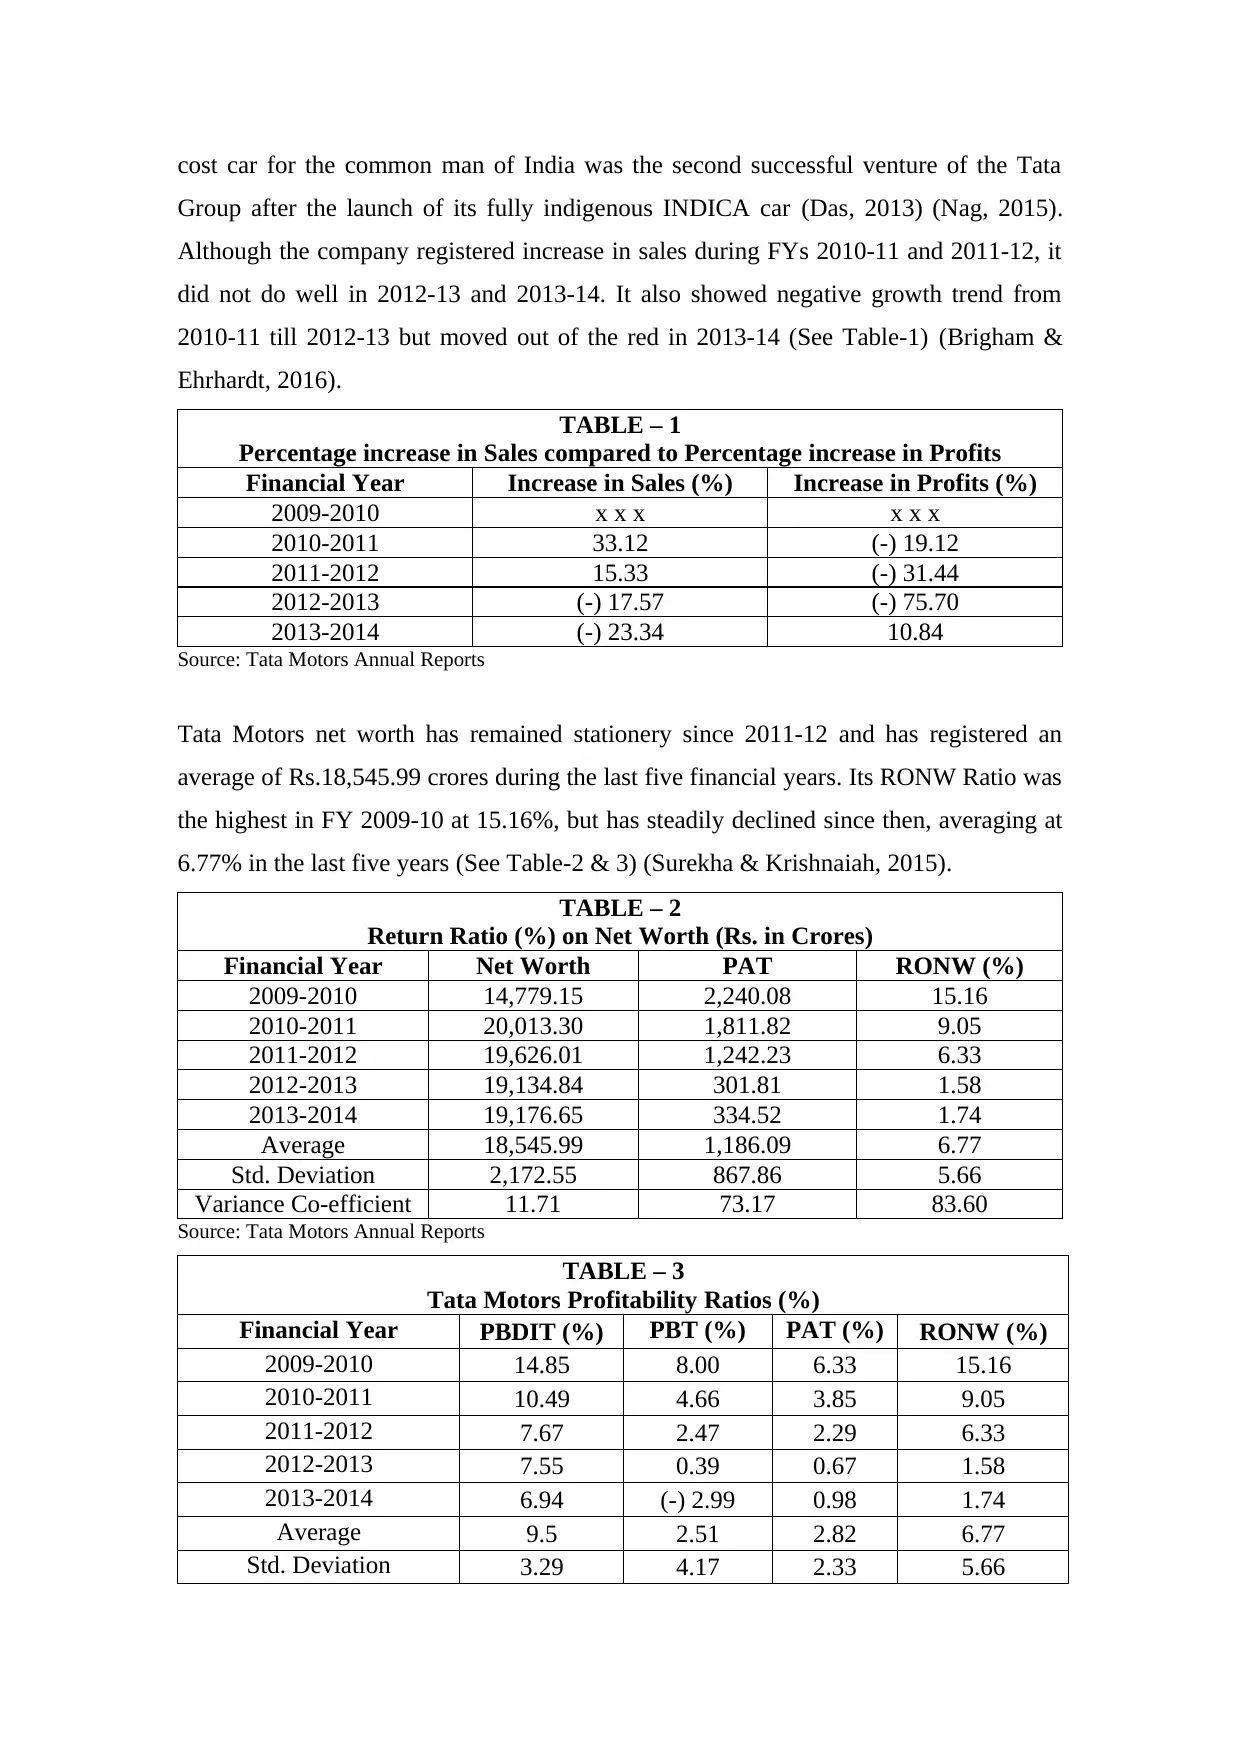
Although the company registered increase in sales during FYs 2010-11 and 2011-12, it
did not do well in 2012-13 and 2013-14. It also showed negative growth trend from
2010-11 till 2012-13 but moved out of the red in 2013-14 (See Table-1) (Brigham &
Ehrhardt, 2016).
TABLE – 1
Percentage increase in Sales compared to Percentage increase in Profits
Financial Year Increase in Sales (%) Increase in Profits (%)
2009-2010 x x x x x x
2010-2011 33.12 (-) 19.12
2011-2012 15.33 (-) 31.44
2012-2013 (-) 17.57 (-) 75.70
2013-2014 (-) 23.34 10.84
Source: Tata Motors Annual Reports
Tata Motors net worth has remained stationery since 2011-12 and has registered an
average of Rs.18,545.99 crores during the last five financial years. Its RONW Ratio was
the highest in FY 2009-10 at 15.16%, but has steadily declined since then, averaging at
6.77% in the last five years (See Table-2 & 3) (Surekha & Krishnaiah, 2015).
TABLE – 2
Return Ratio (%) on Net Worth (Rs. in Crores)
Financial Year Net Worth PAT RONW (%)
2009-2010 14,779.15 2,240.08 15.16
2010-2011 20,013.30 1,811.82 9.05
2011-2012 19,626.01 1,242.23 6.33
2012-2013 19,134.84 301.81 1.58
2013-2014 19,176.65 334.52 1.74
Average 18,545.99 1,186.09 6.77
Std. Deviation 2,172.55 867.86 5.66
Variance Co-efficient 11.71 73.17 83.60
Source: Tata Motors Annual Reports
TABLE – 3
Tata Motors Profitability Ratios (%)
Financial Year PBDIT (%) PBT (%) PAT (%) RONW (%)
2009-2010 14.85 8.00 6.33 15.16
2010-2011 10.49 4.66 3.85 9.05
2011-2012 7.67 2.47 2.29 6.33
2012-2013 7.55 0.39 0.67 1.58
2013-2014 6.94 (-) 2.99 0.98 1.74
Average 9.5 2.51 2.82 6.77
Std. Deviation 3.29 4.17 2.33 5.66
Group after the launch of its fully indigenous INDICA car (Das, 2013) (Nag, 2015).
Although the company registered increase in sales during FYs 2010-11 and 2011-12, it
did not do well in 2012-13 and 2013-14. It also showed negative growth trend from
2010-11 till 2012-13 but moved out of the red in 2013-14 (See Table-1) (Brigham &
Ehrhardt, 2016).
TABLE – 1
Percentage increase in Sales compared to Percentage increase in Profits
Financial Year Increase in Sales (%) Increase in Profits (%)
2009-2010 x x x x x x
2010-2011 33.12 (-) 19.12
2011-2012 15.33 (-) 31.44
2012-2013 (-) 17.57 (-) 75.70
2013-2014 (-) 23.34 10.84
Source: Tata Motors Annual Reports
Tata Motors net worth has remained stationery since 2011-12 and has registered an
average of Rs.18,545.99 crores during the last five financial years. Its RONW Ratio was
the highest in FY 2009-10 at 15.16%, but has steadily declined since then, averaging at
6.77% in the last five years (See Table-2 & 3) (Surekha & Krishnaiah, 2015).
TABLE – 2
Return Ratio (%) on Net Worth (Rs. in Crores)
Financial Year Net Worth PAT RONW (%)
2009-2010 14,779.15 2,240.08 15.16
2010-2011 20,013.30 1,811.82 9.05
2011-2012 19,626.01 1,242.23 6.33
2012-2013 19,134.84 301.81 1.58
2013-2014 19,176.65 334.52 1.74
Average 18,545.99 1,186.09 6.77
Std. Deviation 2,172.55 867.86 5.66
Variance Co-efficient 11.71 73.17 83.60
Source: Tata Motors Annual Reports
TABLE – 3
Tata Motors Profitability Ratios (%)
Financial Year PBDIT (%) PBT (%) PAT (%) RONW (%)
2009-2010 14.85 8.00 6.33 15.16
2010-2011 10.49 4.66 3.85 9.05
2011-2012 7.67 2.47 2.29 6.33
2012-2013 7.55 0.39 0.67 1.58
2013-2014 6.94 (-) 2.99 0.98 1.74
Average 9.5 2.51 2.82 6.77
Std. Deviation 3.29 4.17 2.33 5.66
Variance Co-efficient 34.63 166.40 82.54 83.60
Source: Tata Motors Annual Reports
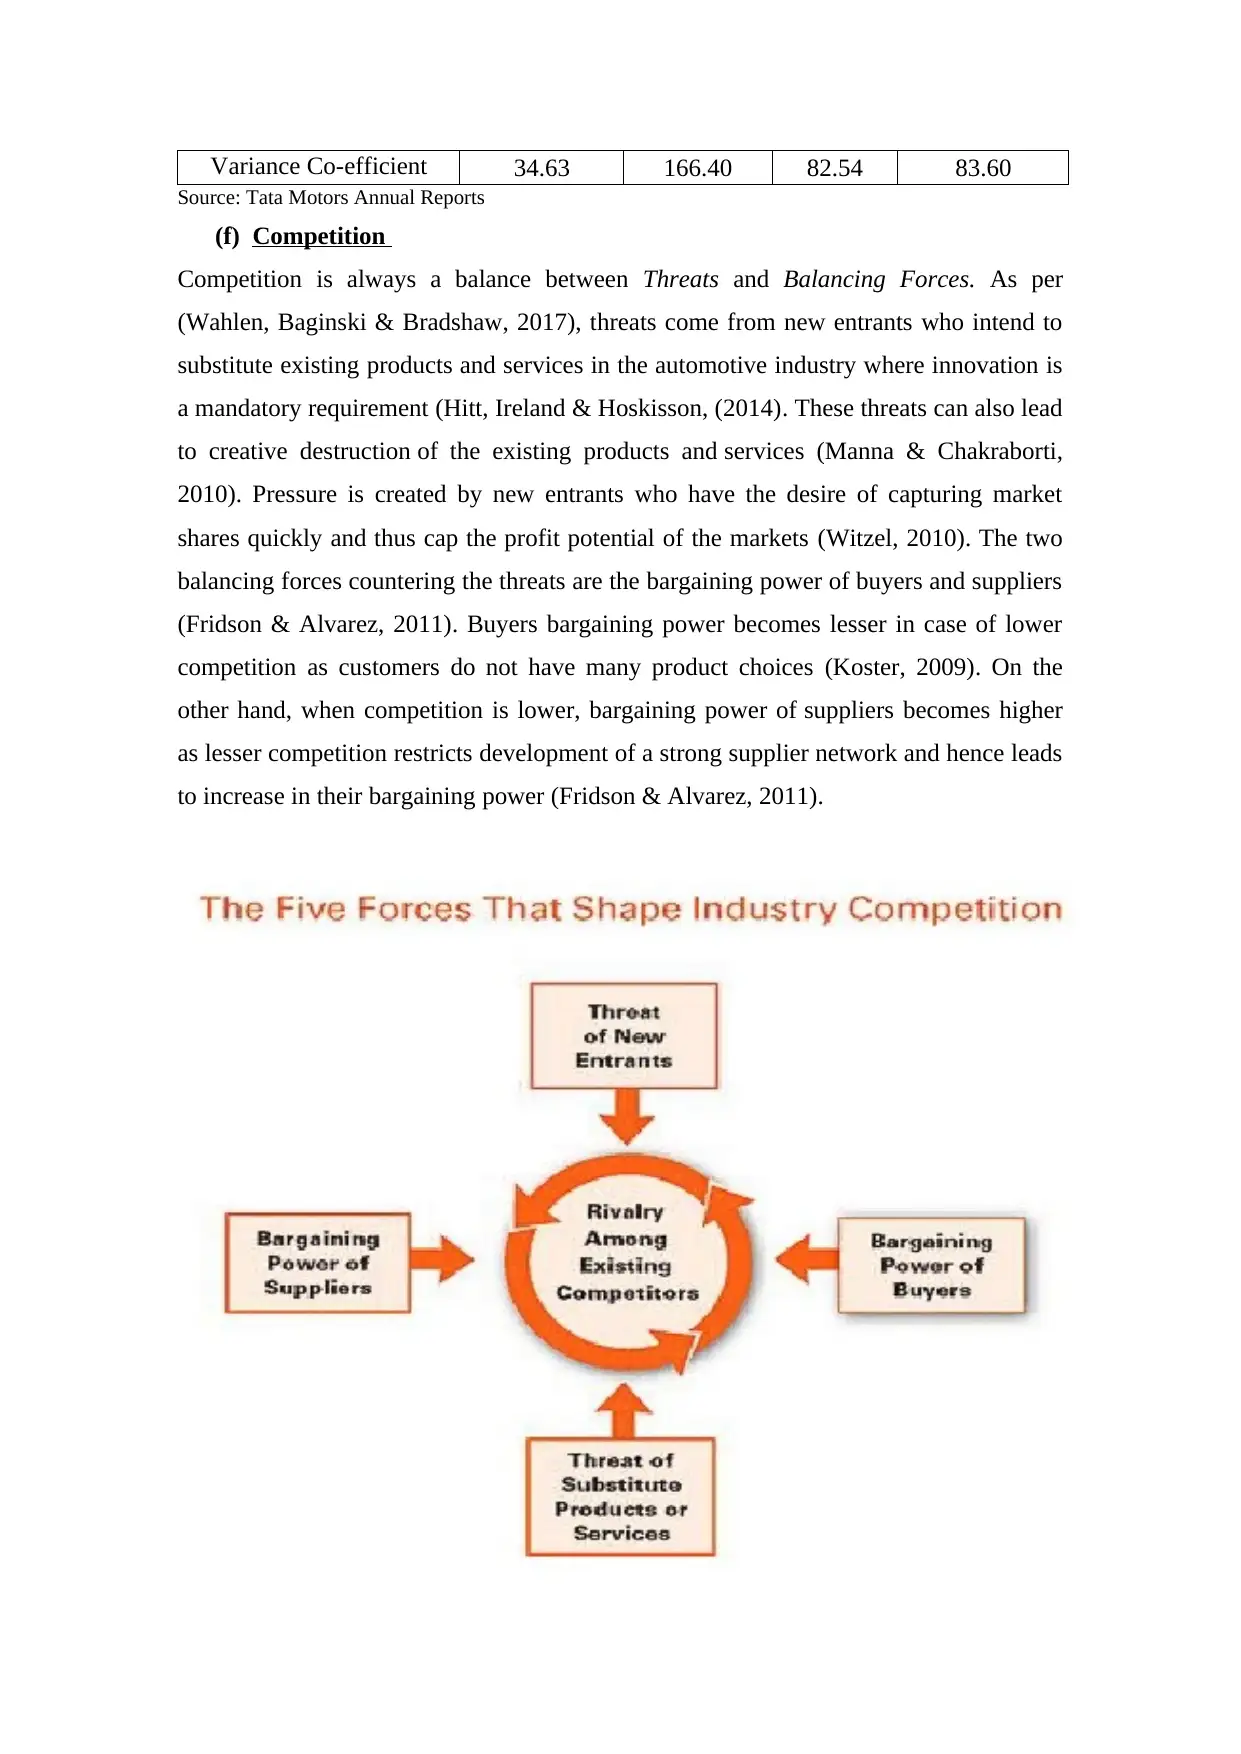
(f) Competition
Competition is always a balance between Threats and Balancing Forces. As per
(Wahlen, Baginski & Bradshaw, 2017), threats come from new entrants who intend to
substitute existing products and services in the automotive industry where innovation is
a mandatory requirement (Hitt, Ireland & Hoskisson, (2014). These threats can also lead
to creative destruction of the existing products and services (Manna & Chakraborti,
2010). Pressure is created by new entrants who have the desire of capturing market
shares quickly and thus cap the profit potential of the markets (Witzel, 2010). The two
balancing forces countering the threats are the bargaining power of buyers and suppliers
(Fridson & Alvarez, 2011). Buyers bargaining power becomes lesser in case of lower
competition as customers do not have many product choices (Koster, 2009). On the
other hand, when competition is lower, bargaining power of suppliers becomes higher
as lesser competition restricts development of a strong supplier network and hence leads
to increase in their bargaining power (Fridson & Alvarez, 2011).
Source: Tata Motors Annual Reports
(f) Competition
Competition is always a balance between Threats and Balancing Forces. As per
(Wahlen, Baginski & Bradshaw, 2017), threats come from new entrants who intend to
substitute existing products and services in the automotive industry where innovation is
a mandatory requirement (Hitt, Ireland & Hoskisson, (2014). These threats can also lead
to creative destruction of the existing products and services (Manna & Chakraborti,
2010). Pressure is created by new entrants who have the desire of capturing market
shares quickly and thus cap the profit potential of the markets (Witzel, 2010). The two
balancing forces countering the threats are the bargaining power of buyers and suppliers
(Fridson & Alvarez, 2011). Buyers bargaining power becomes lesser in case of lower
competition as customers do not have many product choices (Koster, 2009). On the
other hand, when competition is lower, bargaining power of suppliers becomes higher
as lesser competition restricts development of a strong supplier network and hence leads
to increase in their bargaining power (Fridson & Alvarez, 2011).
Secure Best Marks with AI Grader
Need help grading? Try our AI Grader for instant feedback on your assignments.
SOURCE: Money.Com
PART – 3: KEY STAKEHOLDERS
Tata group is managed and owned by the majority stakeholder (36%) Tata Sons Ltd.
through a chain of Family Trusts (Gupta, Wakayama & Rangan, (ed), 2012). The other
big stakeholder is LIC of India (6%) and some private investing companies holding
nearly 10% stake in the group (Lala, 2007). The balance (48%) is owned by the general
public through equity shares (Casey, 2014). Apart from these domestic stakeholders, the
company also has technical tie-ups with:
1. The Institute of Development in Automotive Engineering (IDEA), S.P.A., Italy,
who offers assistance in designing and styling designs for car body.
2. Le Moteur Moderne, France, which is responsible for developing diesel and petrol
engines for the passenger cars being manufactured by the company.
PART – 4: FINDINGS / RESULTS
The definition of ERM given by the Casualty Actuarial Society Committee on
Enterprise Risk Management (2003, p. 8) states and I quote: “ERM is the discipline by
which an organization in an industry assesses, controls, exploits, finances, and
monitors risks from all sources for the purpose of increasing the organization’s short-
and long term value to its stakeholders.” Unquote.
The major Risk Factors, (Wahlen, Baginski & Bradshaw, 2017), being faced by the
automotive industry across the globe, which can affect the net income of an automotive
enterprise are:
a) High Competition
b) Exchange Rate Risk
c) Economic Instability
d) Access to Credit
e) Raw Material Price
f) Supply Chain Disruptions
g) Demand Volatility
h) Regulatory Risk
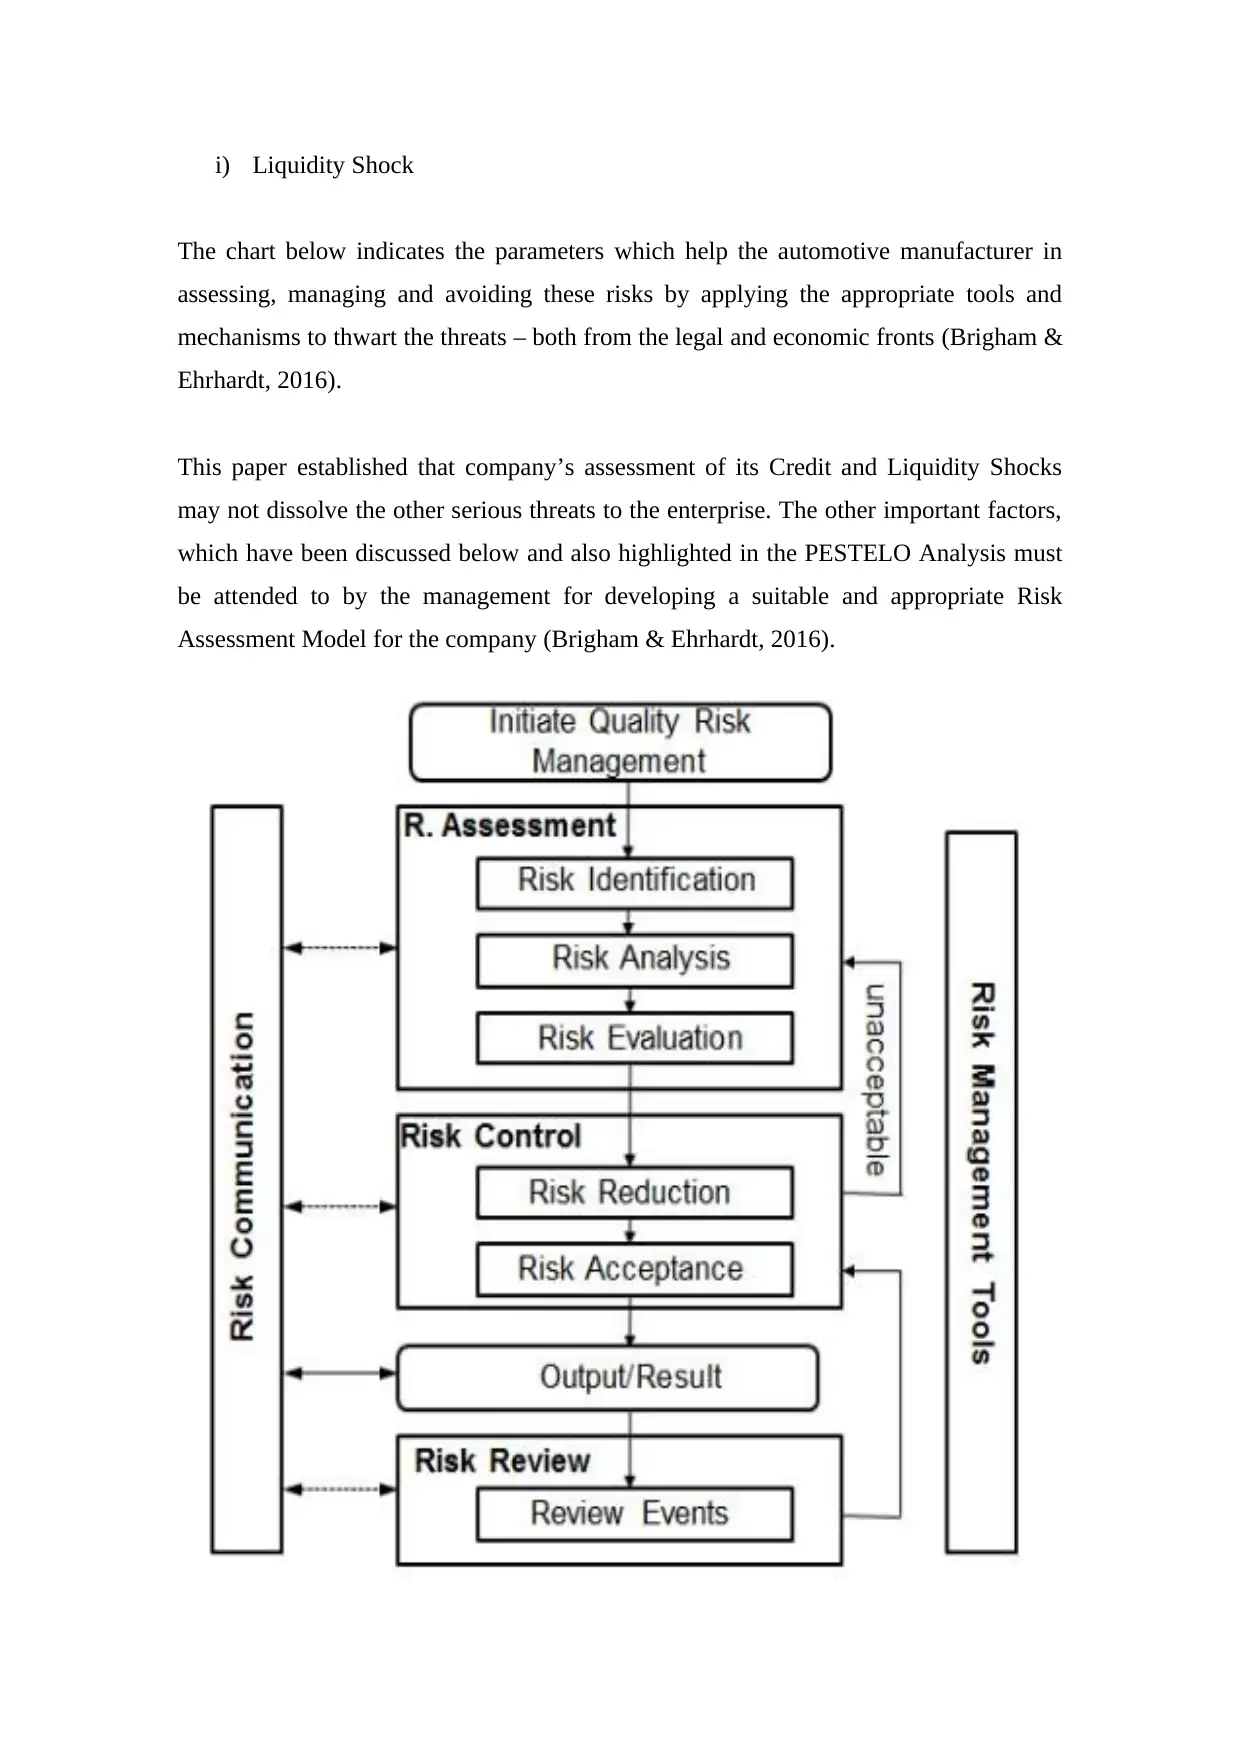
i) Liquidity Shock
The chart below indicates the parameters which help the automotive manufacturer in
assessing, managing and avoiding these risks by applying the appropriate tools and
mechanisms to thwart the threats – both from the legal and economic fronts (Brigham &
Ehrhardt, 2016).
This paper established that company’s assessment of its Credit and Liquidity Shocks
may not dissolve the other serious threats to the enterprise. The other important factors,
which have been discussed below and also highlighted in the PESTELO Analysis must
be attended to by the management for developing a suitable and appropriate Risk
Assessment Model for the company (Brigham & Ehrhardt, 2016).
SOURCE: Money.Com
(A)Business Risk
1. High Competition
According to Ernst and Young Business Risk Report, 2010 India’s automotive industry
has become highly competitive. Quality and Product Features are the factors affecting
competition, along with the time required for development and innovation (Goel, 2014).
Pricing, safety, reliability, fuel economy, financing terms and customer service are the
other affecting factors (Goel, 2014). As the competition for sales in the industry
intensifies, there arises greater need for a more valuable ERM System for the company
to maintain a strong presence within the industry (Das, 2013).
2. Demand Volatility
Demand for vehicles largely depends on the political, social and economic factors in the
country and is greatly influenced by the introduction of new technologies in the vehicles
(Banerjee, 2017).
(B)Economic Risk
1. Exchange Rate Risk
Globalisation demands that Indian Rupees’ value remains attractive so that demand of
Indian products in overseas markets remains high and keeps the price low of imports
(Pandey, 2015). Global marketing has increased the scope of export and import for the
automotive industry and this places importance on exchange rate risk (Banerjee, 2017).
2. Raw Material Price
The increasing consumption and easy availability on international level is leading to an
increase in the prices of the raw materials (Pandey, 2015).
(C)External Risk
1. Supply Chain Disruptions
Supply Chain Management is facing serious disruptions as the markets get global. Tier-
2 stoppages, supplier’s financial strain, union issues and legal factors are some
important external factors which are leading to supply chain disruptions (Brigham &
Ehrhardt, 2016). Any one factor, even if it occurs in the supplier’s country or in the
buyer’s zone, results in supply chain disruptions and drastically affects the economics
and operations of the company’s business (Brigham & Ehrhardt, 2016).
2. Regulatory Risk
Paraphrase This Document
Need a fresh take? Get an instant paraphrase of this document with our AI Paraphraser
Global operations and expansions being maintained and implemented by Tata Motors
are subject to serious threats from change in regulations and legislations related to the
country of operation. Import-export tariffs, domestic sales tax and excise duty are also
effecting the prices of the company’s products and the industry as a whole (Surekha &
Krishnaiah, 2015).
(D)Economic Instability
The Automotive sector, all over the world, remains strongly connected to the
macroeconomic factors of the country. Being a consumer’s product, the country’s Per
Capita Income, Employment Possibilities, Size of the Buying Class and Lender’s
Interest Rates are some of the major macroeconomic parameters which directly affect
the automotive industry (Wahlen, Baginski & Bradshaw, 2017). Tata Motors has been
careful in dealing only with stable countries which have low political risk and which
encourage foreign investments in its industries (Banerjee, 2017).
PART – 5: CONCLUSION
Since its inception, the Tata Group has maintained the custom of returning to the society
what it gets from its people and this heritage has earned the company the trust and
loyalty not only from its consumers, but also from its employees
and stakeholders. These high standards of social behaviour have been reciprocated by
the company’s employees and stakeholders who are continuously enriching this heritage
(Lala, 2007).
Tata Motors, being part of the Tata Group which is celebrating 150 years of its
existence, is still cautious about the following factors as has been stated in its Tata
Motors Sustainability Report, 2015 –
Threat of New Entrants:
Tata Motors takes the achievements of new entrants or of a rival company as learning
lessons to guard the company’s market growth and share.
The intensity of Competitive Rivalry:
Tata Motors has the policy of thwarting competition by developing and introducing new
technologies and products in the market.
The Bargaining Power of Customers:
Tata Motors has the policy of managing proper price control of the company’s products
in the market.
The Bargaining Power of Supplier:
Tata Motors has always maintained a fair and free distribution channel for all its
manufacturing units. This is very important for an Indian company as the supply and
demand factors are highly diverse across length and breadth of the country.
LIST OF REFERENCES
Ashwathappa, K. (2010) International Business. (4th ed). New Delhi: Tata McGraw-Hill
Education.
Banerjee, B. (2017) Financial Policy and Management Accounting. Delhi: PHI
Learning Pvt. Ltd.
Bhat, H. (2013) Tata Indica: The Very First Indian Car. London: Penguin UK.
Brigham, E.F. and Ehrhardt, M.C. (2016) Financial Management: Theory & Practice.
(15th ed.). Boston, MA: Cengage Learning.
Canals, J. (ed). (2012) Leadership Development in a Global World: The Role of
Companies and Business Schools. Hampshire: Springer.
Casey, P. (2014) The Greatest Company in the World?: The Story of TATA. London:
Penguin UK.
Das, S.C. (2013) Business Accounting and Financial Management. Delhi: PHI Learning
Pvt. Ltd.
Fridson, M.S. and Alvarez, F. (2011) Financial Statement Analysis: A Practitioner's
Guide (4th ed.). Hoboken, NJ: John Wiley & Sons.
Goel, S. (2014) Financial Statements Analysis: Cases from Corporate India. Oxon:
Routledge.
Grant, R.M. (2016) Contemporary Strategy Analysis: Text and Cases. West Sussex:
John Wiley & Sons.
Gupta, A.K., Wakayama, T. and Rangan, U.S. (ed). (2012) Global Strategies for
Emerging Asia. San Francisco, CA: John Wiley & Sons.
Hitt, M.A., Ireland, R. D. and Hoskisson, R. E. (2014) Strategic Management: Concepts
and Cases: Competitiveness and Globalization. (11th ed). Stanford, CN: Cengage
Learning.
Koster, K. (2009) International Project Management. London: SAGE.
Lala, R.M. (2007) The Romance of Tata Steel. London: Penguin UK.
Manna, S. and Chakraborti, S. (2010) Values and Ethics in Business and Profession.
New Delhi: PHI Learning Pvt. Ltd.
May, S. (ed). (2012) Case Studies in Organizational Communication: Ethical
Perspectives and Practices. (2nd ed). Thousand Oaks, CA: SAGE Publications.
Nag, A. (2015) Strategic Management. New Delhi: Vikas Publishing House.
Pandey, I.M. (2015) Financial Management. (11th ed.). New Delhi: Vikas Publishing
House.
Rudani, R.B. (2013) Principles of Management. New Delhi: Tata McGraw-Hill
Education.
Surekha, B. and Krishnaiah, K.R. (2015) A Study on Financial Analysis of Tata Motors.
IRACST – International Journal of Commerce, Business and Management (IJCBM),
Vol. 4, No.4, August 2015. Pp: 1224-1228.
Thompson, A.A. (2012) Crafting and Executing Strategy – SIE. New York: Tata
McGraw-Hill Education.
Secure Best Marks with AI Grader
Need help grading? Try our AI Grader for instant feedback on your assignments.
Tulder, R. V., Verbeke, A., Carneiro, J. and Gonzalez-Perez, M.A. (ed). (2016) The
Challenge of BRIC Multinationals. Bingley: Emerald Group Publishing.
Wahlen, J.M., Baginski, S.P. and Bradshaw, M. (2017) Financial Reporting, Financial
Statement Analysis and Valuation. (9th ed.). Boston, MA: Cengage Learning.
Witzel, M. (2010) Tata: Evolution of a Corporate Brand. London: Penguin UK.
1 out of 11

Your All-in-One AI-Powered Toolkit for Academic Success.
+13062052269
info@desklib.com
Available 24*7 on WhatsApp / Email
![[object Object]](/_next/static/media/star-bottom.7253800d.svg)
Unlock your academic potential
© 2024 | Zucol Services PVT LTD | All rights reserved.