Analyzing Continuous Improvement in Educational Performance
VerifiedAdded on 2020/05/28
|15
|2575
|251
AI Summary
The paper delves into the implementation of continuous improvement plans in education, emphasizing structured frameworks to enhance both teacher effectiveness and student outcomes. By integrating Quality Control (QC) tools alongside other methodologies, it outlines a strategic approach to address educational challenges. The plan emphasizes collaborative efforts between educators and administrators, fostering an environment conducive to academic growth. Continuous assessment and adaptation are key components, ensuring that the strategies remain relevant and effective over time. This comprehensive approach not only aims at resolving immediate issues but also sets a foundation for sustained improvement in educational practices. Ultimately, it concludes with long-term benefits such as enhanced student achievement and teacher satisfaction.
Running head: TEACHING AND LEARNING IMPROVEMENT PLAN
Teaching and Learning Improvement Plan
Name of student
Student number
Email address of student
Name of University
Author’s Note
Teaching and Learning Improvement Plan
Name of student
Student number
Email address of student
Name of University
Author’s Note
Paraphrase This Document
Need a fresh take? Get an instant paraphrase of this document with our AI Paraphraser
1TEACHING AND LEARNING IMPROVEMENT PLAN
Executive Summary
In the Division of Learning Support for Teaching, continuous improvement is very much
necessary as the students’ performance are not well and has worried David that the situation
must not go worst, as it will take the reputation of the school down. The report provides the
school with an opportunity to bring a continuous improvement plan in the performance of the
student. As in the last few semesters, the student performance where average as compare to their
peer and the test results. The report will contain a continuous improvement plan and the
implementation plan in high-level so that the issue can be identified and difficulties can be
anticipated.
2TEACHING AND LEARNING IMPROVEMENT PLAN
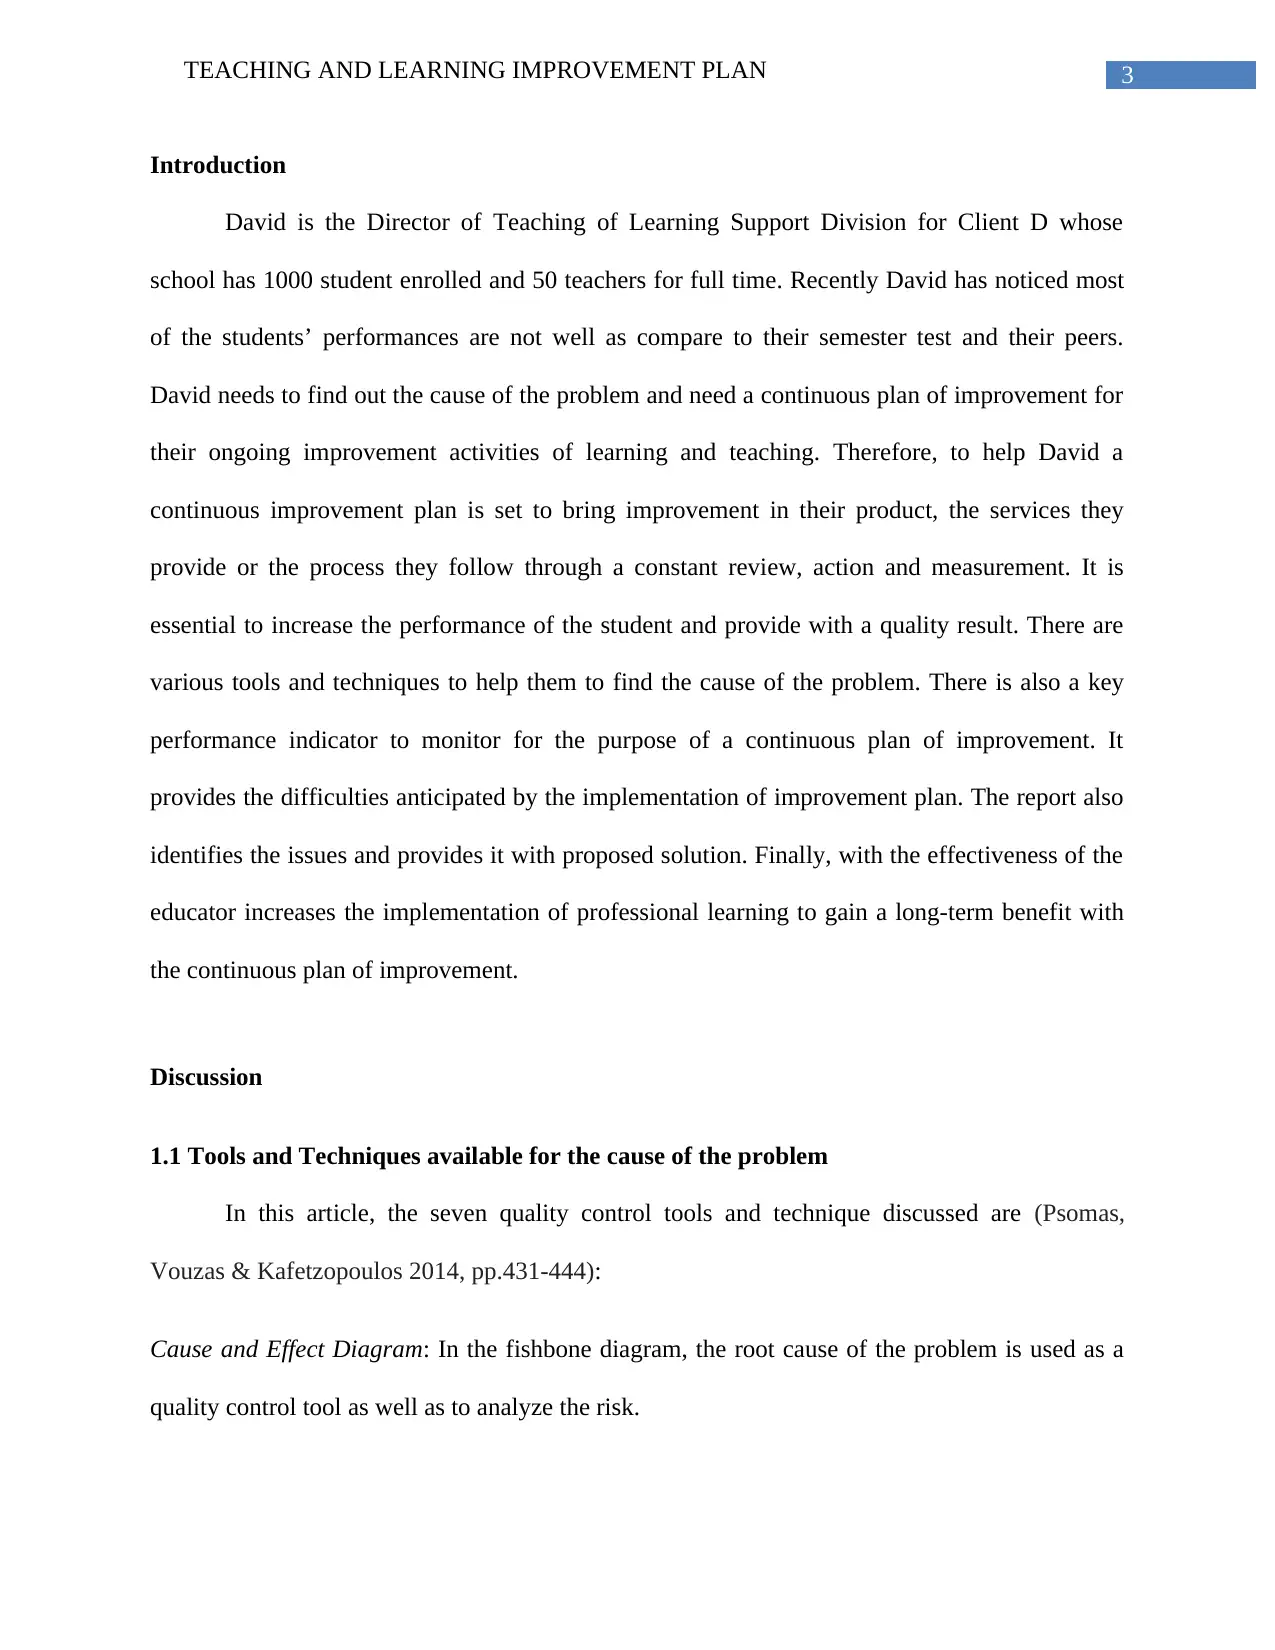
Table of Contents
Introduction......................................................................................................................................3
Discussion........................................................................................................................................3
1.1 Tools and Techniques available for the cause of the problem...............................................3
1.2 In relation to the Seven Quality Control tools keep track of the key performance................7
1.2.1 One QC example.....................................................................................................................7
1.2.2 Second QC example...............................................................................................................7
1.2.3 SIPSA tools other then the 7QC tools....................................................................................7
1.3 High-level continuous improvement plans and a detailed implementation plan...................9
1.4 Identify difficulties with implementation of the improvement plan and solutions to each of
them............................................................................................................................................11
1.5 Long-term benefits of proposed improvement plan.............................................................12
Conclusion.....................................................................................................................................12
References......................................................................................................................................13
⊘ This is a preview!⊘
Do you want full access?
Subscribe today to unlock all pages.
Trusted by 1+ million students worldwide
3TEACHING AND LEARNING IMPROVEMENT PLAN
Introduction
David is the Director of Teaching of Learning Support Division for Client D whose
school has 1000 student enrolled and 50 teachers for full time. Recently David has noticed most
of the students’ performances are not well as compare to their semester test and their peers.
David needs to find out the cause of the problem and need a continuous plan of improvement for
their ongoing improvement activities of learning and teaching. Therefore, to help David a
continuous improvement plan is set to bring improvement in their product, the services they
provide or the process they follow through a constant review, action and measurement. It is
essential to increase the performance of the student and provide with a quality result. There are
various tools and techniques to help them to find the cause of the problem. There is also a key
performance indicator to monitor for the purpose of a continuous plan of improvement. It
provides the difficulties anticipated by the implementation of improvement plan. The report also
identifies the issues and provides it with proposed solution. Finally, with the effectiveness of the
educator increases the implementation of professional learning to gain a long-term benefit with
the continuous plan of improvement.
Discussion
1.1 Tools and Techniques available for the cause of the problem
In this article, the seven quality control tools and technique discussed are (Psomas,
Vouzas & Kafetzopoulos 2014, pp.431-444):
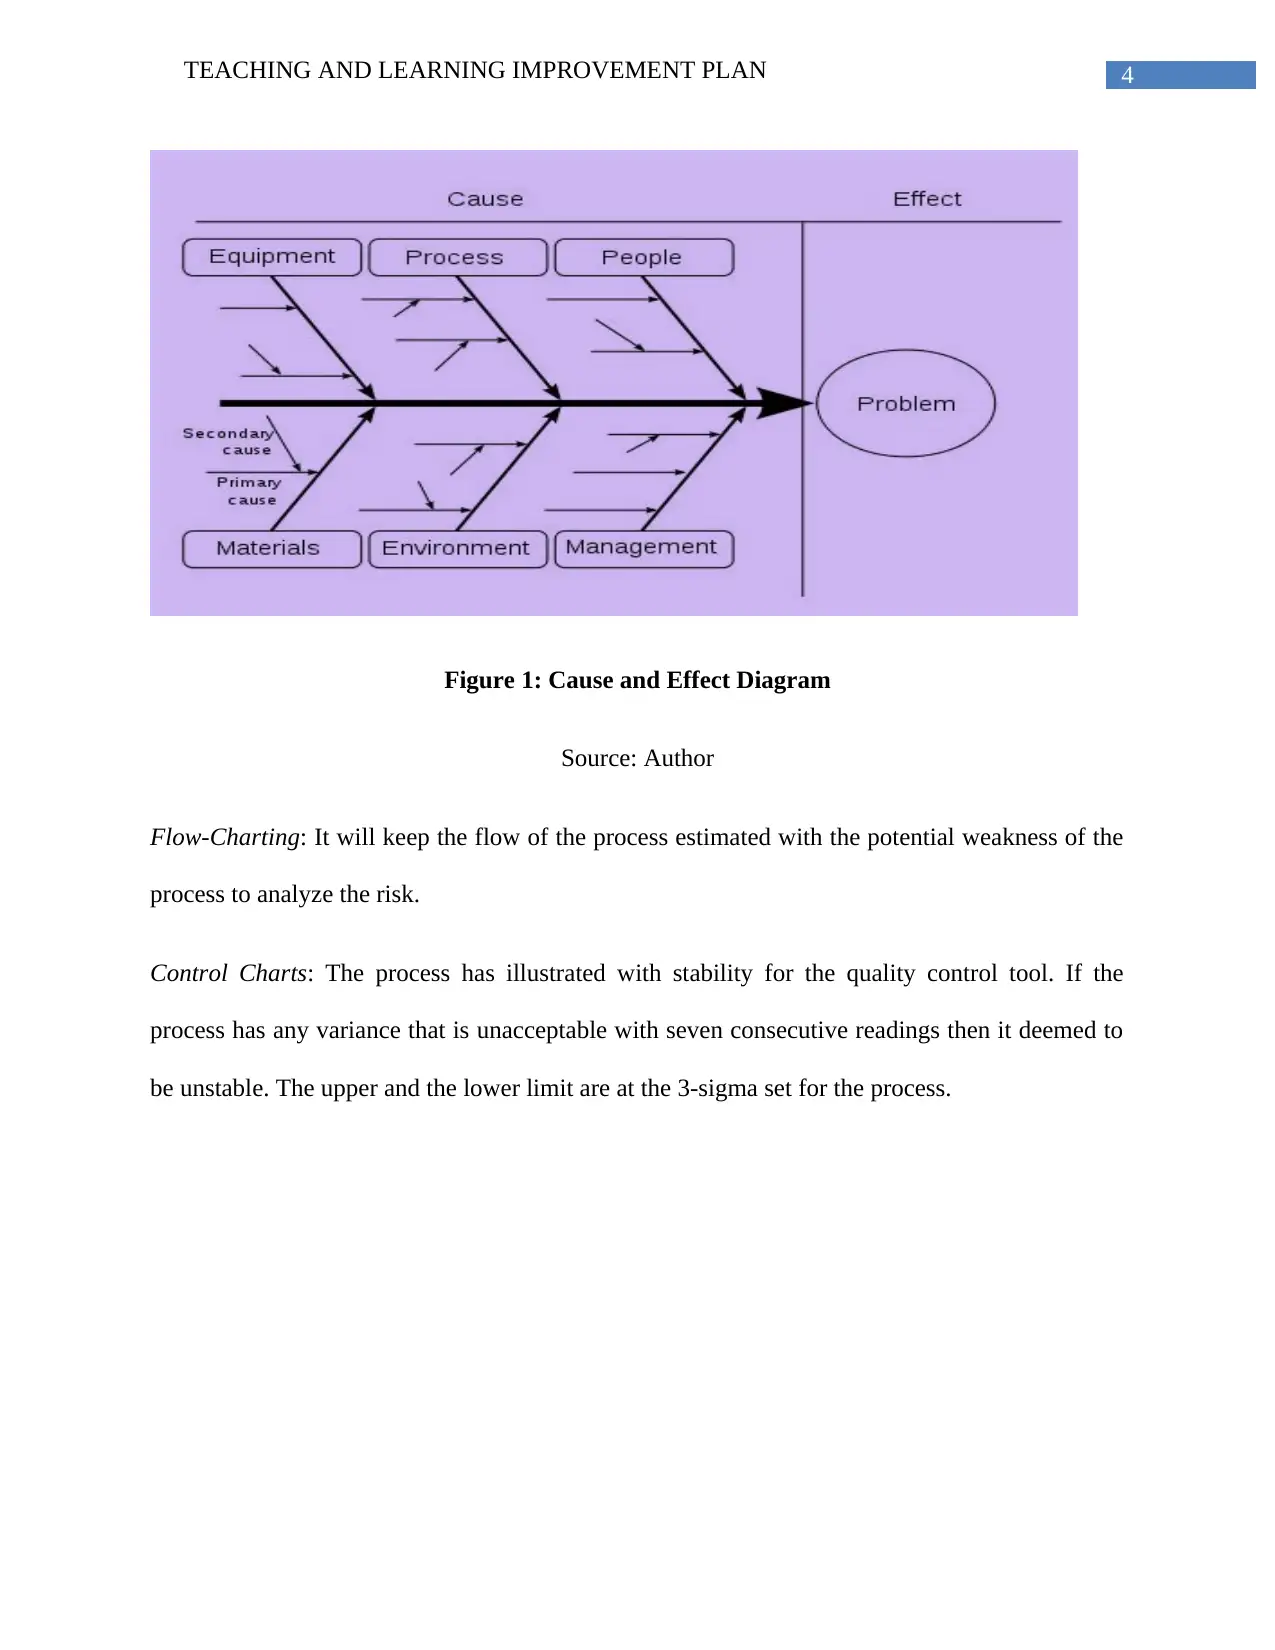
Cause and Effect Diagram: In the fishbone diagram, the root cause of the problem is used as a
quality control tool as well as to analyze the risk.
Introduction
David is the Director of Teaching of Learning Support Division for Client D whose
school has 1000 student enrolled and 50 teachers for full time. Recently David has noticed most
of the students’ performances are not well as compare to their semester test and their peers.
David needs to find out the cause of the problem and need a continuous plan of improvement for
their ongoing improvement activities of learning and teaching. Therefore, to help David a
continuous improvement plan is set to bring improvement in their product, the services they
provide or the process they follow through a constant review, action and measurement. It is
essential to increase the performance of the student and provide with a quality result. There are
various tools and techniques to help them to find the cause of the problem. There is also a key
performance indicator to monitor for the purpose of a continuous plan of improvement. It
provides the difficulties anticipated by the implementation of improvement plan. The report also
identifies the issues and provides it with proposed solution. Finally, with the effectiveness of the
educator increases the implementation of professional learning to gain a long-term benefit with
the continuous plan of improvement.
Discussion
1.1 Tools and Techniques available for the cause of the problem
In this article, the seven quality control tools and technique discussed are (Psomas,
Vouzas & Kafetzopoulos 2014, pp.431-444):
Cause and Effect Diagram: In the fishbone diagram, the root cause of the problem is used as a
quality control tool as well as to analyze the risk.
Paraphrase This Document
Need a fresh take? Get an instant paraphrase of this document with our AI Paraphraser
4TEACHING AND LEARNING IMPROVEMENT PLAN
Figure 1: Cause and Effect Diagram
Source: Author
Flow-Charting: It will keep the flow of the process estimated with the potential weakness of the
process to analyze the risk.
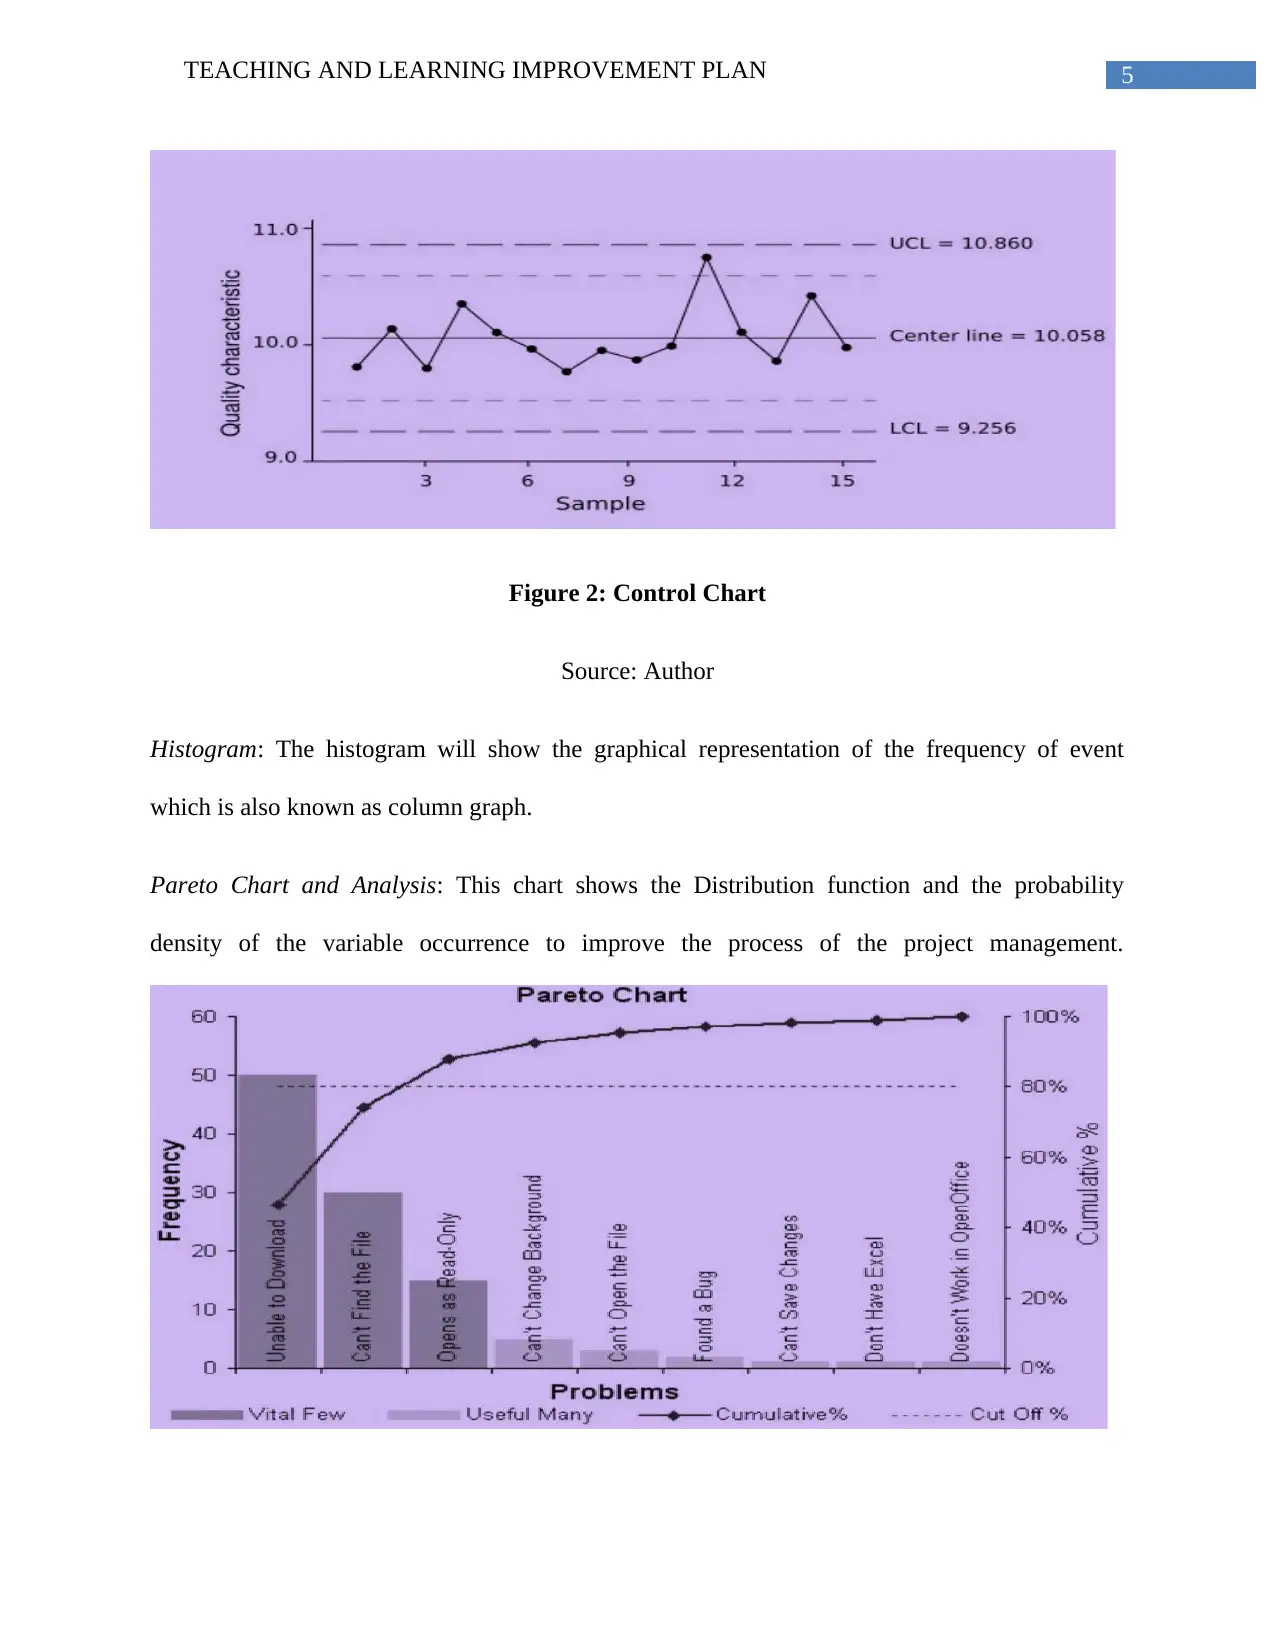
Control Charts: The process has illustrated with stability for the quality control tool. If the
process has any variance that is unacceptable with seven consecutive readings then it deemed to
be unstable. The upper and the lower limit are at the 3-sigma set for the process.
Figure 1: Cause and Effect Diagram
Source: Author
Flow-Charting: It will keep the flow of the process estimated with the potential weakness of the
process to analyze the risk.
Control Charts: The process has illustrated with stability for the quality control tool. If the
process has any variance that is unacceptable with seven consecutive readings then it deemed to
be unstable. The upper and the lower limit are at the 3-sigma set for the process.
5TEACHING AND LEARNING IMPROVEMENT PLAN
Figure 2: Control Chart
Source: Author
Histogram: The histogram will show the graphical representation of the frequency of event
which is also known as column graph.
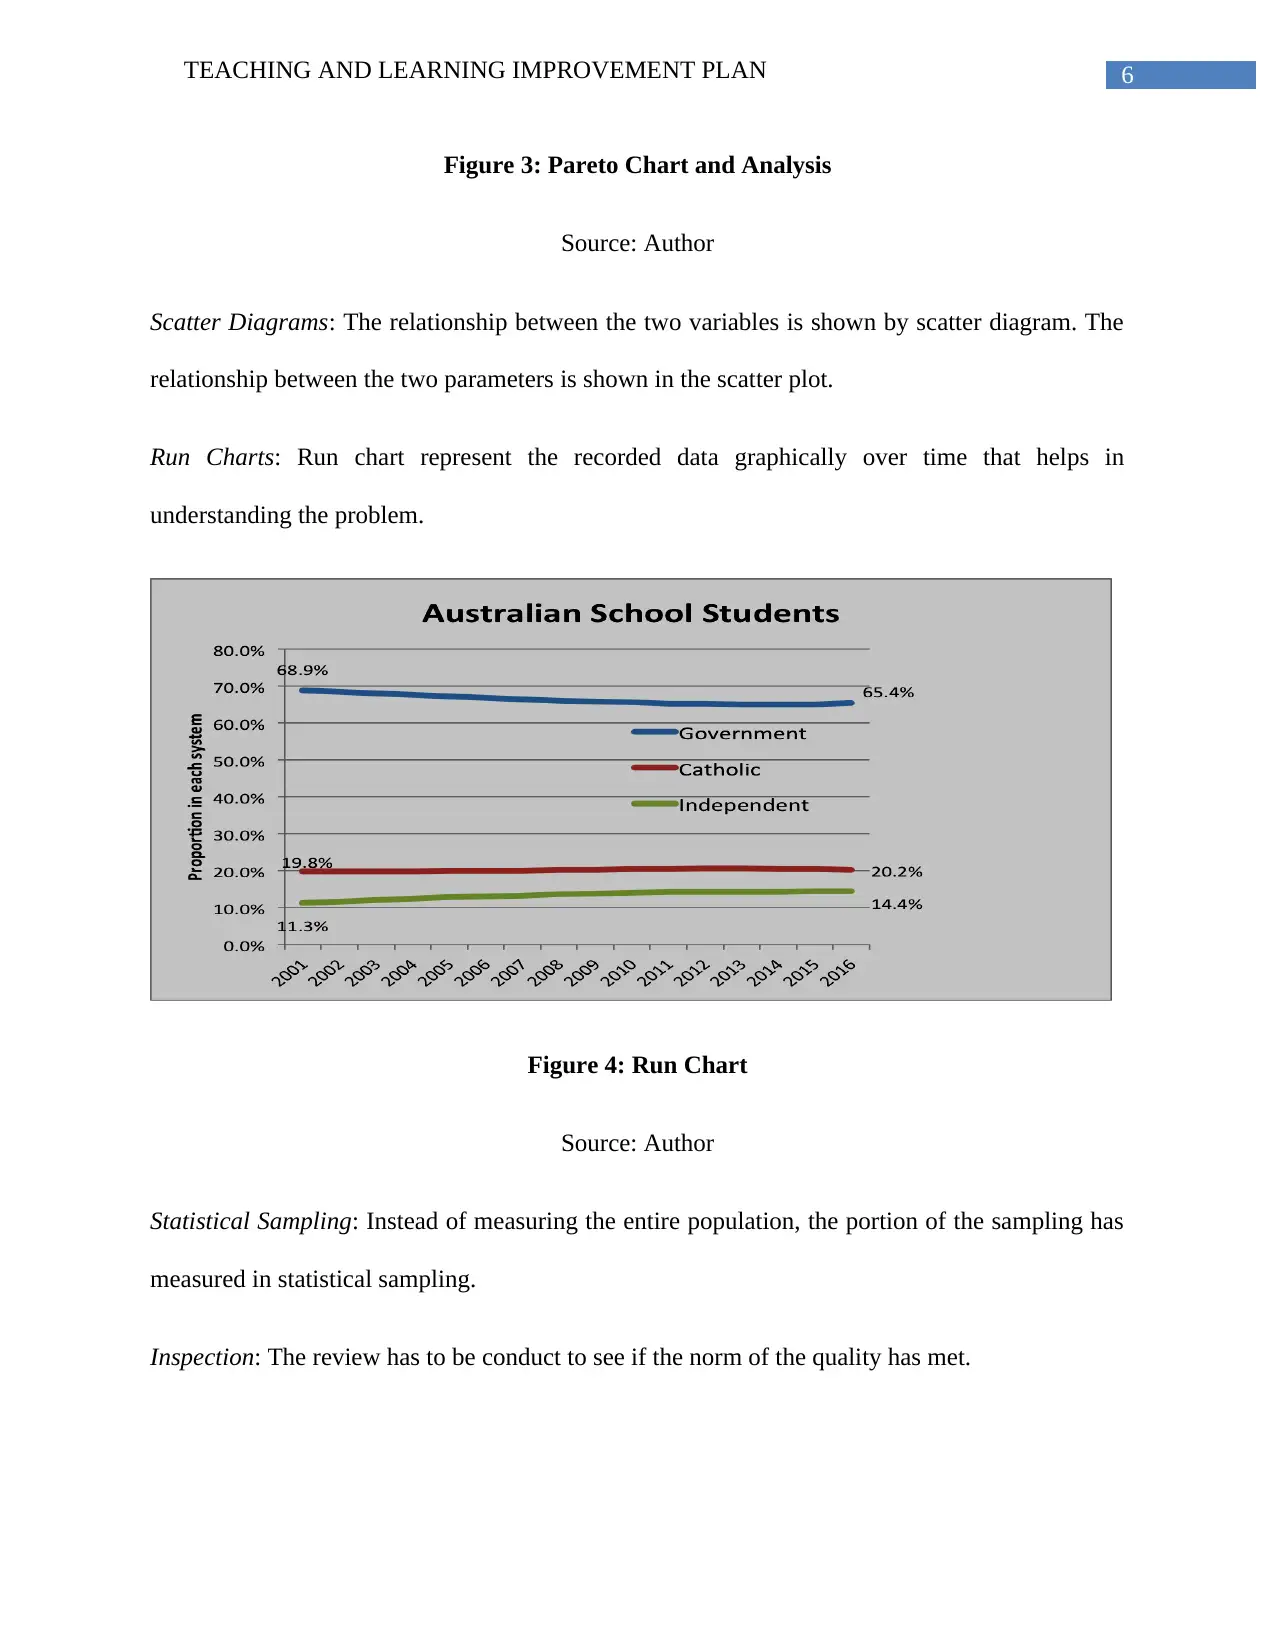
Pareto Chart and Analysis: This chart shows the Distribution function and the probability
density of the variable occurrence to improve the process of the project management.
Figure 2: Control Chart
Source: Author
Histogram: The histogram will show the graphical representation of the frequency of event
which is also known as column graph.
Pareto Chart and Analysis: This chart shows the Distribution function and the probability
density of the variable occurrence to improve the process of the project management.
⊘ This is a preview!⊘
Do you want full access?
Subscribe today to unlock all pages.
Trusted by 1+ million students worldwide
6TEACHING AND LEARNING IMPROVEMENT PLAN
Figure 3: Pareto Chart and Analysis
Source: Author
Scatter Diagrams: The relationship between the two variables is shown by scatter diagram. The
relationship between the two parameters is shown in the scatter plot.
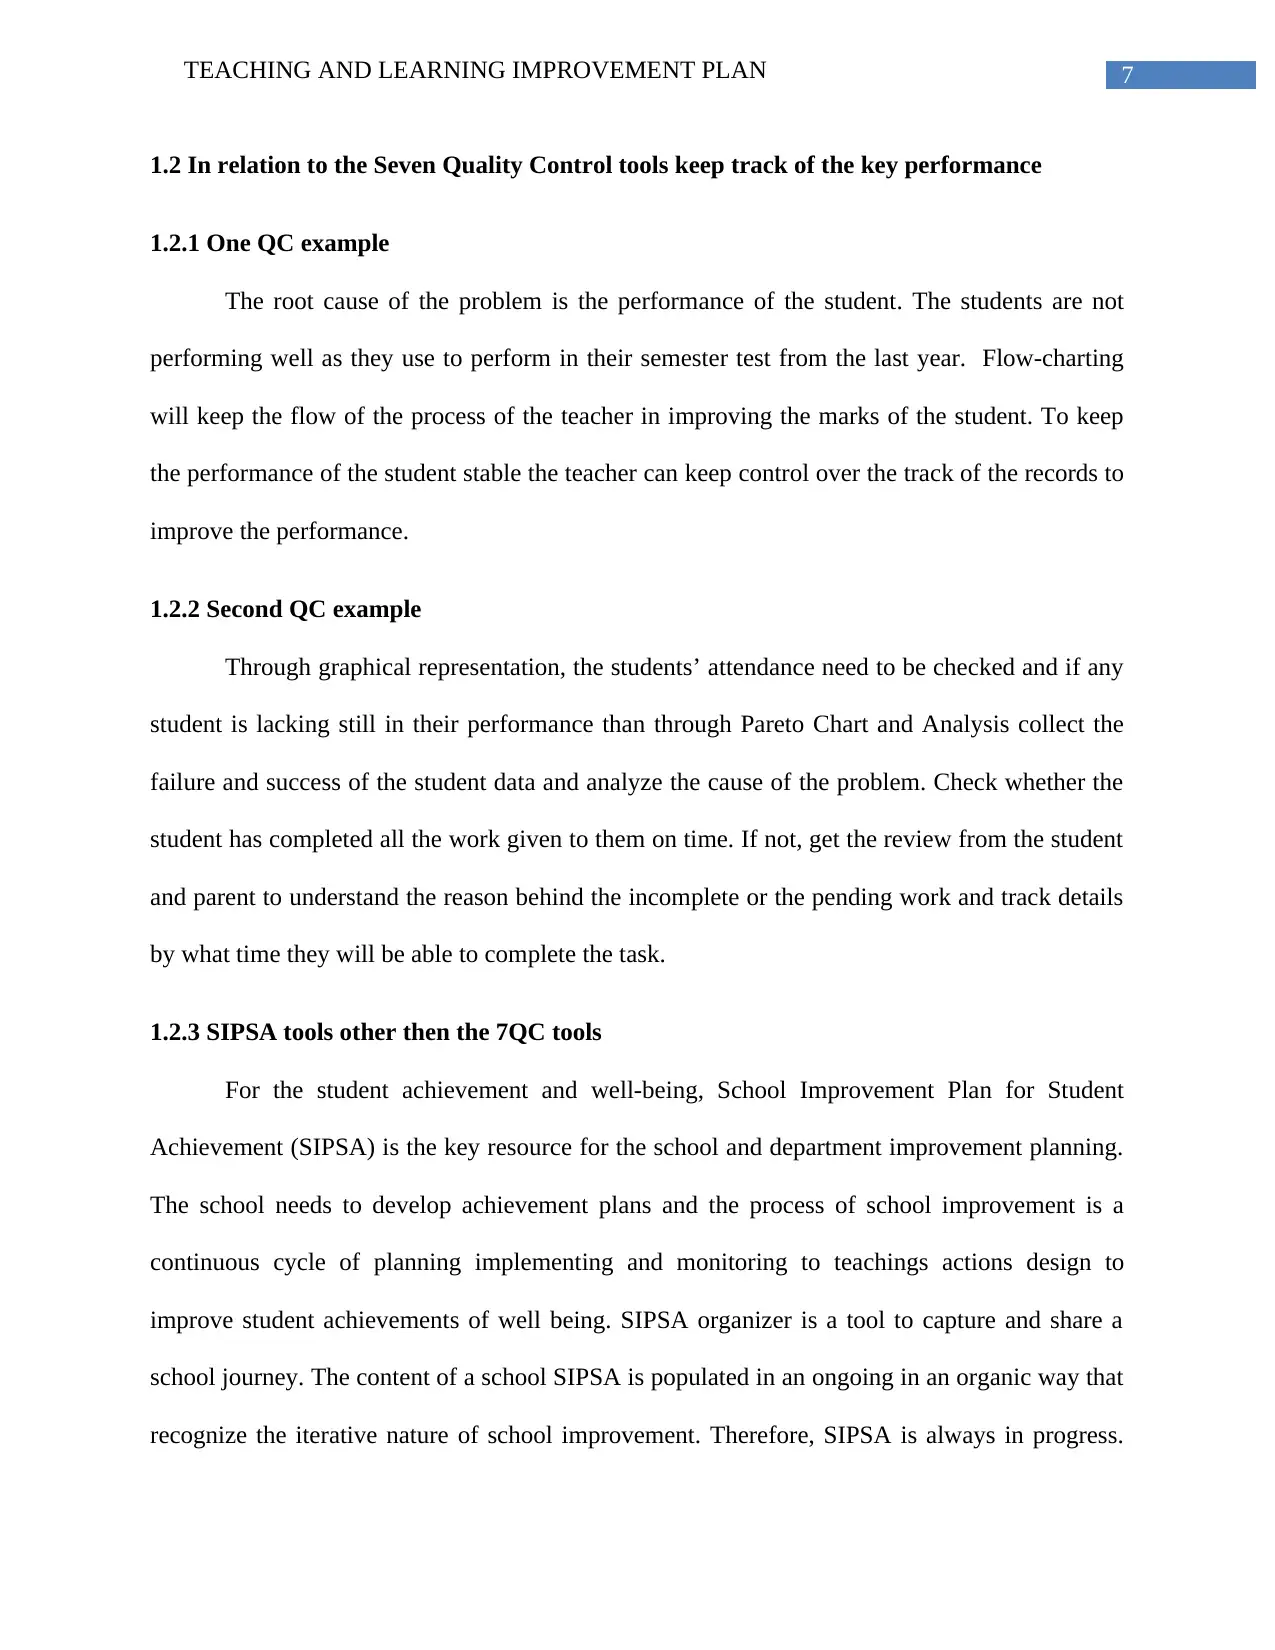
Run Charts: Run chart represent the recorded data graphically over time that helps in
understanding the problem.
Figure 4: Run Chart
Source: Author
Statistical Sampling: Instead of measuring the entire population, the portion of the sampling has
measured in statistical sampling.
Inspection: The review has to be conduct to see if the norm of the quality has met.
Figure 3: Pareto Chart and Analysis
Source: Author
Scatter Diagrams: The relationship between the two variables is shown by scatter diagram. The
relationship between the two parameters is shown in the scatter plot.
Run Charts: Run chart represent the recorded data graphically over time that helps in
understanding the problem.
Figure 4: Run Chart
Source: Author
Statistical Sampling: Instead of measuring the entire population, the portion of the sampling has
measured in statistical sampling.
Inspection: The review has to be conduct to see if the norm of the quality has met.
Paraphrase This Document
Need a fresh take? Get an instant paraphrase of this document with our AI Paraphraser
7TEACHING AND LEARNING IMPROVEMENT PLAN
1.2 In relation to the Seven Quality Control tools keep track of the key performance
1.2.1 One QC example
The root cause of the problem is the performance of the student. The students are not
performing well as they use to perform in their semester test from the last year. Flow-charting
will keep the flow of the process of the teacher in improving the marks of the student. To keep
the performance of the student stable the teacher can keep control over the track of the records to
improve the performance.
1.2.2 Second QC example
Through graphical representation, the students’ attendance need to be checked and if any
student is lacking still in their performance than through Pareto Chart and Analysis collect the
failure and success of the student data and analyze the cause of the problem. Check whether the
student has completed all the work given to them on time. If not, get the review from the student
and parent to understand the reason behind the incomplete or the pending work and track details
by what time they will be able to complete the task.
1.2.3 SIPSA tools other then the 7QC tools
For the student achievement and well-being, School Improvement Plan for Student
Achievement (SIPSA) is the key resource for the school and department improvement planning.
The school needs to develop achievement plans and the process of school improvement is a
continuous cycle of planning implementing and monitoring to teachings actions design to
improve student achievements of well being. SIPSA organizer is a tool to capture and share a
school journey. The content of a school SIPSA is populated in an ongoing in an organic way that
recognize the iterative nature of school improvement. Therefore, SIPSA is always in progress.
8TEACHING AND LEARNING IMPROVEMENT PLAN
SILC support the school throughout the SIPSA process. It offers individual and team a set of
promoting and collective questions to guide and depends on their work. SILC is a learning
assessment cycle design to build and innact a shared understanding of where they are going and
where they are now and how they will close the gap just like a teacher learning assessment cycle.
It begins with diagnostic assessment to understand strength and needs. It requires the
establishment of clear shape and visible goals and outcomes in order to select sequence and
learning actions. It involves a continuous loop for assessment for and as learning and monitor
progress towards goals. To understand the need, educators uses multiples of data, create a school
profile include strength and needs and advices from all stakeholders (Marsh & Farrell 2015,
pp.269-289). It is important to remember the challenges and practices have to be within the
instructional core for real and improvement to occur. The level of content of the student can be
raise. The knowledge and skill that the teacher bring to the teaching of that content can be
increase and increase the level of student in the learning of that content. Thinking about the
strength needs and challenge of practice, teams identify broad goal or goals that they will be
working on in SILC. School teams may record their goals and the theory of actions of the
organizer. For school team working from an existing theory of action to ensure that goal reflects
there thinking. An integral step of goal setting is the identification of intended outcomes,
statements of whatever looks like sounds when the goals have been achieved. This are expressed
in terms of the desire to changes to students learning outcomes, students learning behaviors and
educator learning and practice. It is important to note that this are planed from the student
outcomes that are implemented from the educated learning.
⊘ This is a preview!⊘
Do you want full access?
Subscribe today to unlock all pages.
Trusted by 1+ million students worldwide
9TEACHING AND LEARNING IMPROVEMENT PLAN
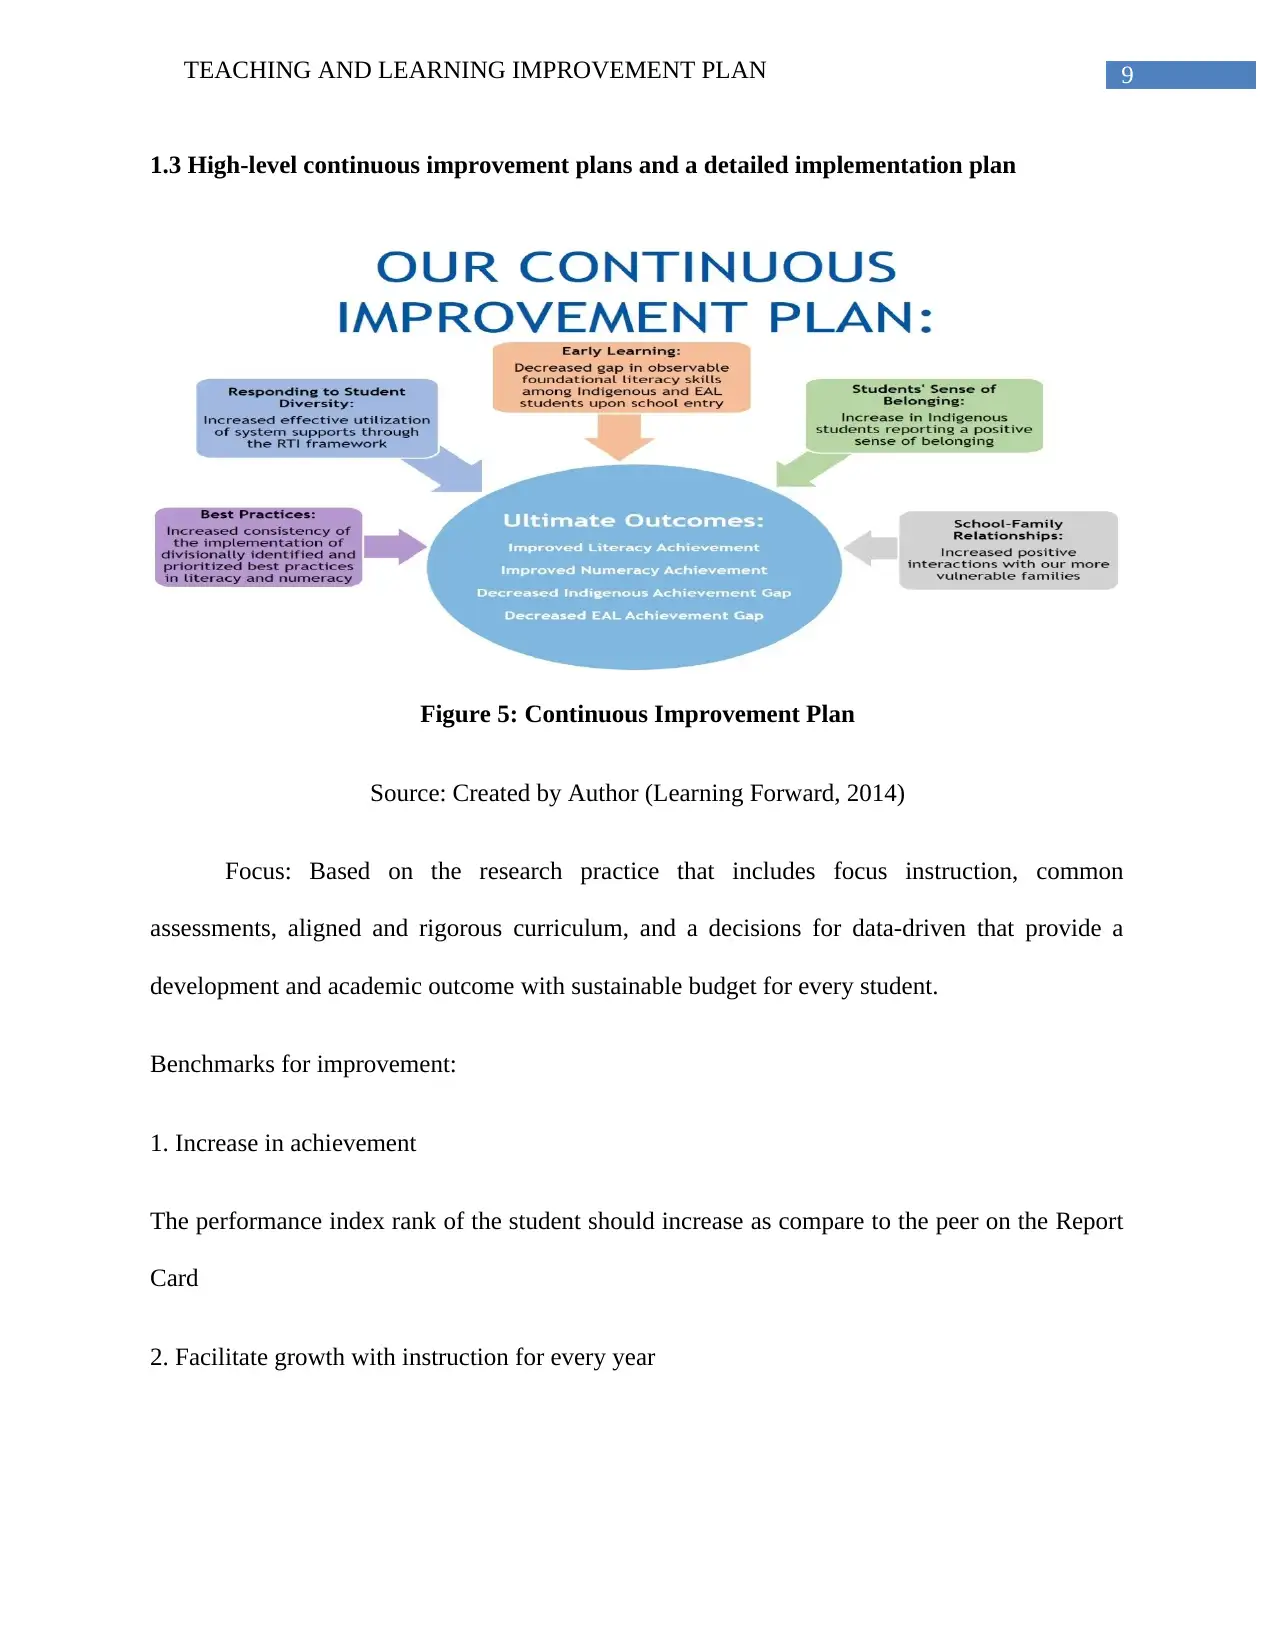
1.3 High-level continuous improvement plans and a detailed implementation plan
Figure 5: Continuous Improvement Plan
Source: Created by Author (Learning Forward, 2014)
Focus: Based on the research practice that includes focus instruction, common
assessments, aligned and rigorous curriculum, and a decisions for data-driven that provide a
development and academic outcome with sustainable budget for every student.
Benchmarks for improvement:
1. Increase in achievement
The performance index rank of the student should increase as compare to the peer on the Report
Card
2. Facilitate growth with instruction for every year
Paraphrase This Document
Need a fresh take? Get an instant paraphrase of this document with our AI Paraphraser
10TEACHING AND LEARNING IMPROVEMENT PLAN
Demonstrate the measuring progress grade of all the students of at least growth of one year or
higher.
3. For all the subgroups that are identified should meet or should exceed the standard of Gap
Closing Component for Grade B.
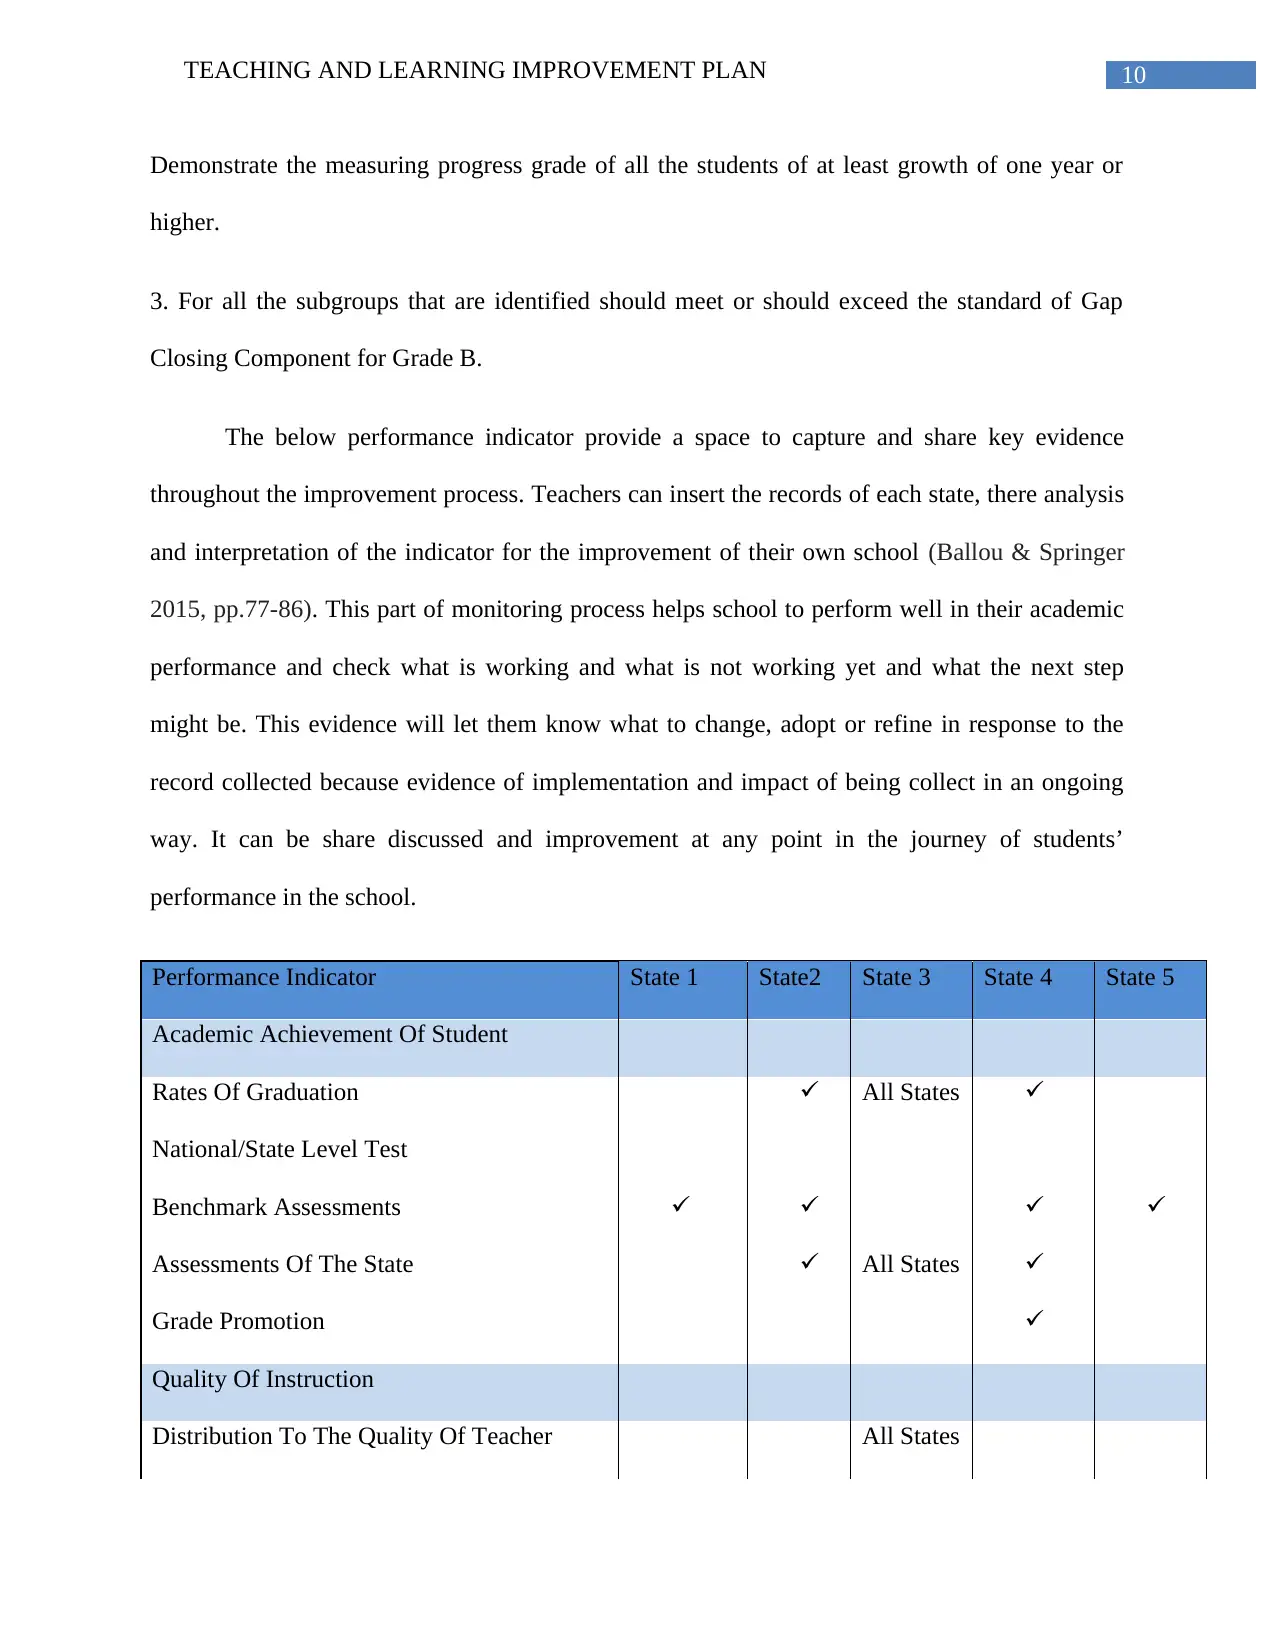
The below performance indicator provide a space to capture and share key evidence
throughout the improvement process. Teachers can insert the records of each state, there analysis
and interpretation of the indicator for the improvement of their own school (Ballou & Springer
2015, pp.77-86). This part of monitoring process helps school to perform well in their academic
performance and check what is working and what is not working yet and what the next step
might be. This evidence will let them know what to change, adopt or refine in response to the
record collected because evidence of implementation and impact of being collect in an ongoing
way. It can be share discussed and improvement at any point in the journey of students’
performance in the school.
Performance Indicator State 1 State2 State 3 State 4 State 5
Academic Achievement Of Student
Rates Of Graduation All States
National/State Level Test
Benchmark Assessments
Assessments Of The State All States
Grade Promotion
Quality Of Instruction
Distribution To The Quality Of Teacher All States
Demonstrate the measuring progress grade of all the students of at least growth of one year or
higher.
3. For all the subgroups that are identified should meet or should exceed the standard of Gap
Closing Component for Grade B.
The below performance indicator provide a space to capture and share key evidence
throughout the improvement process. Teachers can insert the records of each state, there analysis
and interpretation of the indicator for the improvement of their own school (Ballou & Springer
2015, pp.77-86). This part of monitoring process helps school to perform well in their academic
performance and check what is working and what is not working yet and what the next step
might be. This evidence will let them know what to change, adopt or refine in response to the
record collected because evidence of implementation and impact of being collect in an ongoing
way. It can be share discussed and improvement at any point in the journey of students’
performance in the school.
Performance Indicator State 1 State2 State 3 State 4 State 5
Academic Achievement Of Student
Rates Of Graduation All States
National/State Level Test
Benchmark Assessments
Assessments Of The State All States
Grade Promotion
Quality Of Instruction
Distribution To The Quality Of Teacher All States
11TEACHING AND LEARNING IMPROVEMENT PLAN
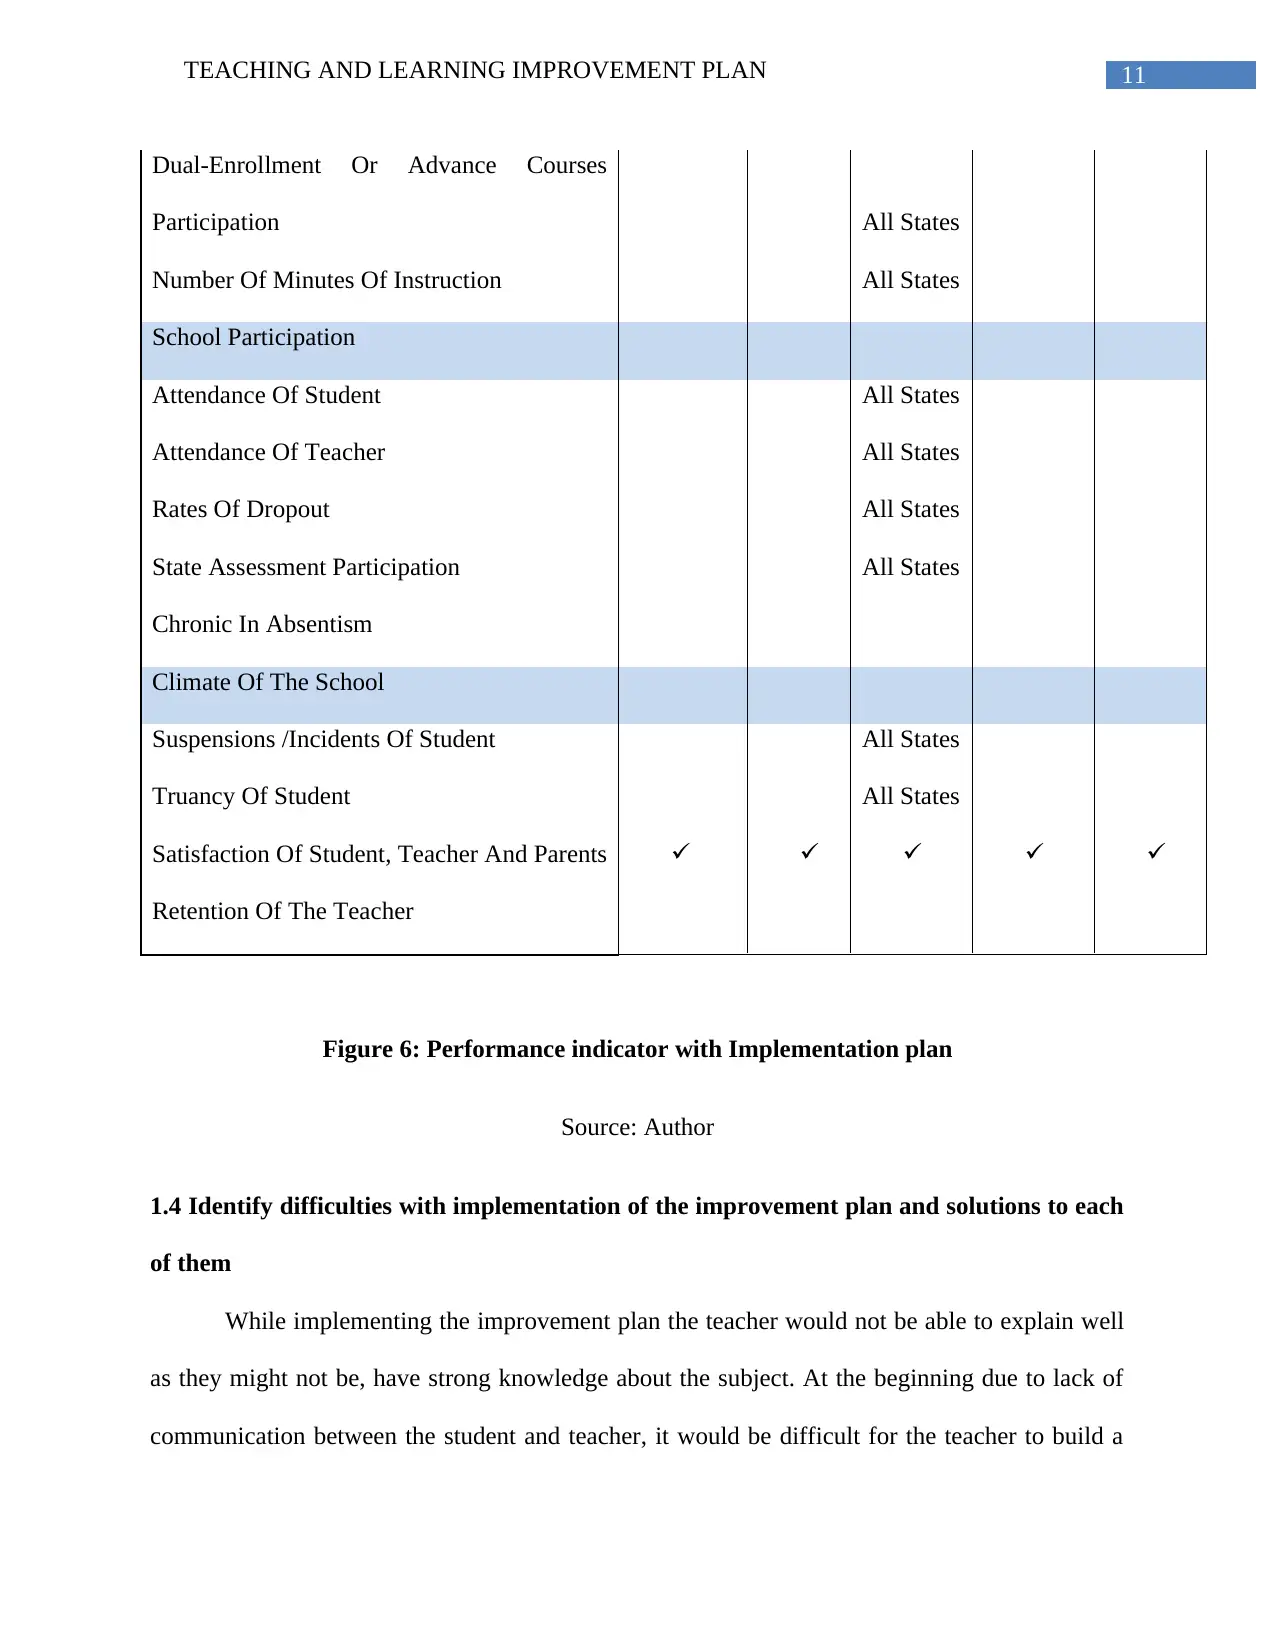
Dual-Enrollment Or Advance Courses
Participation All States
Number Of Minutes Of Instruction All States
School Participation
Attendance Of Student All States
Attendance Of Teacher All States
Rates Of Dropout All States
State Assessment Participation All States
Chronic In Absentism
Climate Of The School
Suspensions /Incidents Of Student All States
Truancy Of Student All States
Satisfaction Of Student, Teacher And Parents
Retention Of The Teacher
Figure 6: Performance indicator with Implementation plan
Source: Author
1.4 Identify difficulties with implementation of the improvement plan and solutions to each
of them
While implementing the improvement plan the teacher would not be able to explain well
as they might not be, have strong knowledge about the subject. At the beginning due to lack of
communication between the student and teacher, it would be difficult for the teacher to build a
⊘ This is a preview!⊘
Do you want full access?
Subscribe today to unlock all pages.
Trusted by 1+ million students worldwide
1 out of 15
Related Documents


Your All-in-One AI-Powered Toolkit for Academic Success.
+13062052269
info@desklib.com
Available 24*7 on WhatsApp / Email
![[object Object]](/_next/static/media/star-bottom.7253800d.svg)
Unlock your academic potential
Copyright © 2020–2026 A2Z Services. All Rights Reserved. Developed and managed by ZUCOL.