Report: Techno-economic Assessment of Local Energy Systems
VerifiedAdded on 2022/12/23
|17
|3820
|135
Report
AI Summary
This report provides a techno-economic assessment of local energy systems, specifically focusing on photovoltaic (PV) energy generation for property development in the UK. It begins by selecting a suitable location, the Isle of Wight, based on high annual PV yield. The report then delves into load analysis, detailing summer and winter consumption profiles for various appliances and creating seasonal and annual load summary tables. Furthermore, it assesses the economic viability of a rooftop PV system, calculating its capacity factor, CO2 savings, and presenting graphs of total investment, net present value, and customer savings. The report also considers cost reduction strategies and identifies the most economical options for powering the estate, concluding with a summary of findings and recommendations.
Techno-economic
Assessment of Local
Energy Systems
Assessment of Local
Energy Systems
Paraphrase This Document
Need a fresh take? Get an instant paraphrase of this document with our AI Paraphraser
Contents
INTRODUCTION...........................................................................................................................3
TASK 1: Choose a suitable location for the property development................................................3
TASK 2: Load Analysis sheet of PvSA and adopt consumption profile of summer and winter.....3
Final summer and winter load tables......................................................................................4
Seasonal load summary table.................................................................................................5
Annual load summary table, daily consumption, and peak load............................................6
Summary plots for average daily consumption and peak load...............................................7
TASK 3: Economical rooftop PV system........................................................................................7
Proposed investment financially viable..................................................................................7
Home electricity demand met by system................................................................................7
The maximum and actual capacity factor of system..............................................................7
CO2 saved annually................................................................................................................8
TASK 4: Plot graphs of total investment, Net present value, and total customer savings..............8
Total investment graph...........................................................................................................8
Net Present Value...................................................................................................................9
Total customer savings...........................................................................................................9
TASK 5: How to reduce the cost of system...................................................................................10
TASK 6: Most economical option to power the estate..................................................................10
CONCLUSION..............................................................................................................................10
REFERENCES..............................................................................................................................11
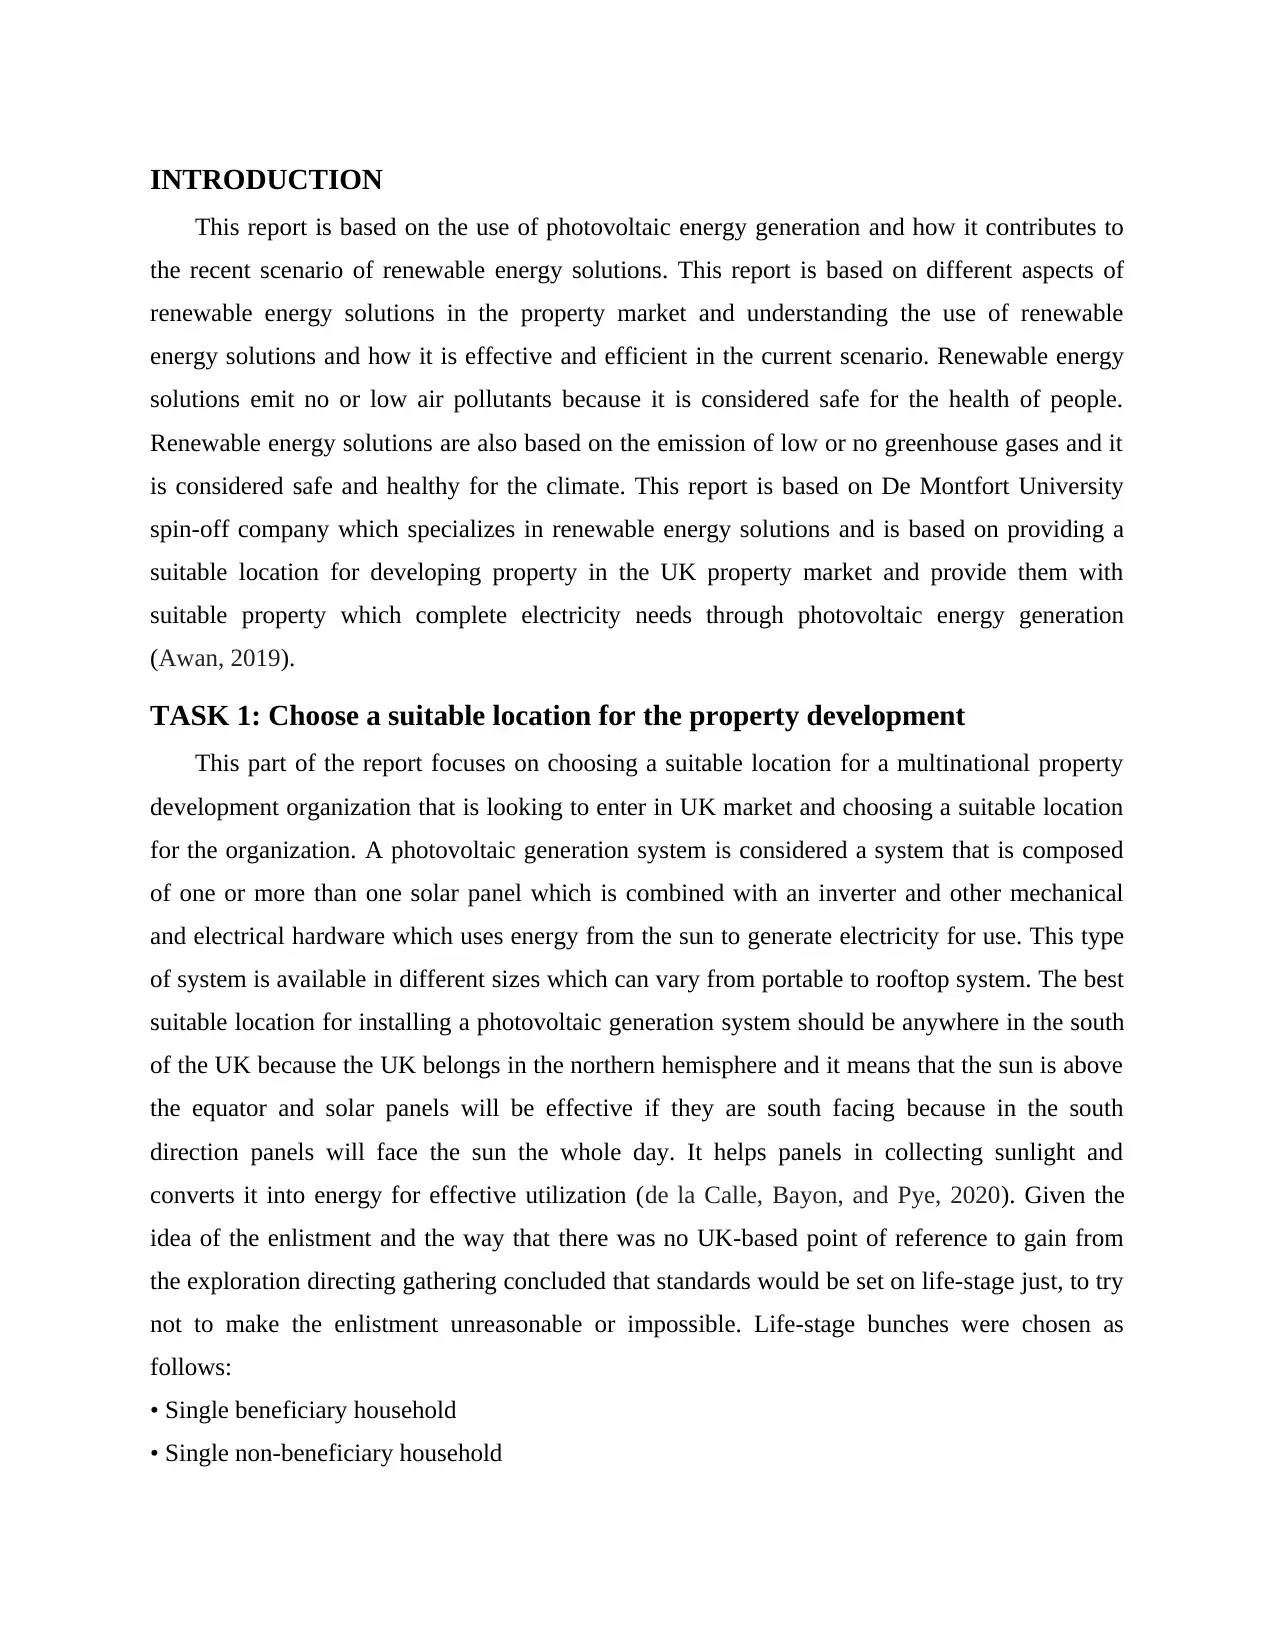
INTRODUCTION
This report is based on the use of photovoltaic energy generation and how it contributes to
the recent scenario of renewable energy solutions. This report is based on different aspects of
renewable energy solutions in the property market and understanding the use of renewable
energy solutions and how it is effective and efficient in the current scenario. Renewable energy
solutions emit no or low air pollutants because it is considered safe for the health of people.
Renewable energy solutions are also based on the emission of low or no greenhouse gases and it
is considered safe and healthy for the climate. This report is based on De Montfort University
spin-off company which specializes in renewable energy solutions and is based on providing a
suitable location for developing property in the UK property market and provide them with
suitable property which complete electricity needs through photovoltaic energy generation
(Awan, 2019).
TASK 1: Choose a suitable location for the property development
This part of the report focuses on choosing a suitable location for a multinational property
development organization that is looking to enter in UK market and choosing a suitable location
for the organization. A photovoltaic generation system is considered a system that is composed
of one or more than one solar panel which is combined with an inverter and other mechanical
and electrical hardware which uses energy from the sun to generate electricity for use. This type
of system is available in different sizes which can vary from portable to rooftop system. The best
suitable location for installing a photovoltaic generation system should be anywhere in the south
of the UK because the UK belongs in the northern hemisphere and it means that the sun is above
the equator and solar panels will be effective if they are south facing because in the south
direction panels will face the sun the whole day. It helps panels in collecting sunlight and
converts it into energy for effective utilization (de la Calle, Bayon, and Pye, 2020). Given the
idea of the enlistment and the way that there was no UK-based point of reference to gain from
the exploration directing gathering concluded that standards would be set on life-stage just, to try
not to make the enlistment unreasonable or impossible. Life-stage bunches were chosen as
follows:
• Single beneficiary household
• Single non-beneficiary household
⊘ This is a preview!⊘
Do you want full access?
Subscribe today to unlock all pages.
Trusted by 1+ million students worldwide
• Numerous retired person household
• Families with youngster/kids;
• Numerous individual families without any kids living at home.
CV information base location postings were created for each example point. If quantity targets
were not met from inside the dispensed CV locations, questioners utilized 'compounding' 6 from
inside the equivalent test highlight to meet the portion. Standards were spread across the year to
guarantee that segment bunches were part across various seasons and to stay away from a
specific segment subgroup from being checked at one specific season. No weighting has been
applied to the information as the expectation is to make examinations between the ecological
perspectives on the investigation test against public information on these issues. Weighting the
information to the profile of the public populace would cover any distinctions ought to there any
kind.
Paraphrase This Document
Need a fresh take? Get an instant paraphrase of this document with our AI Paraphraser
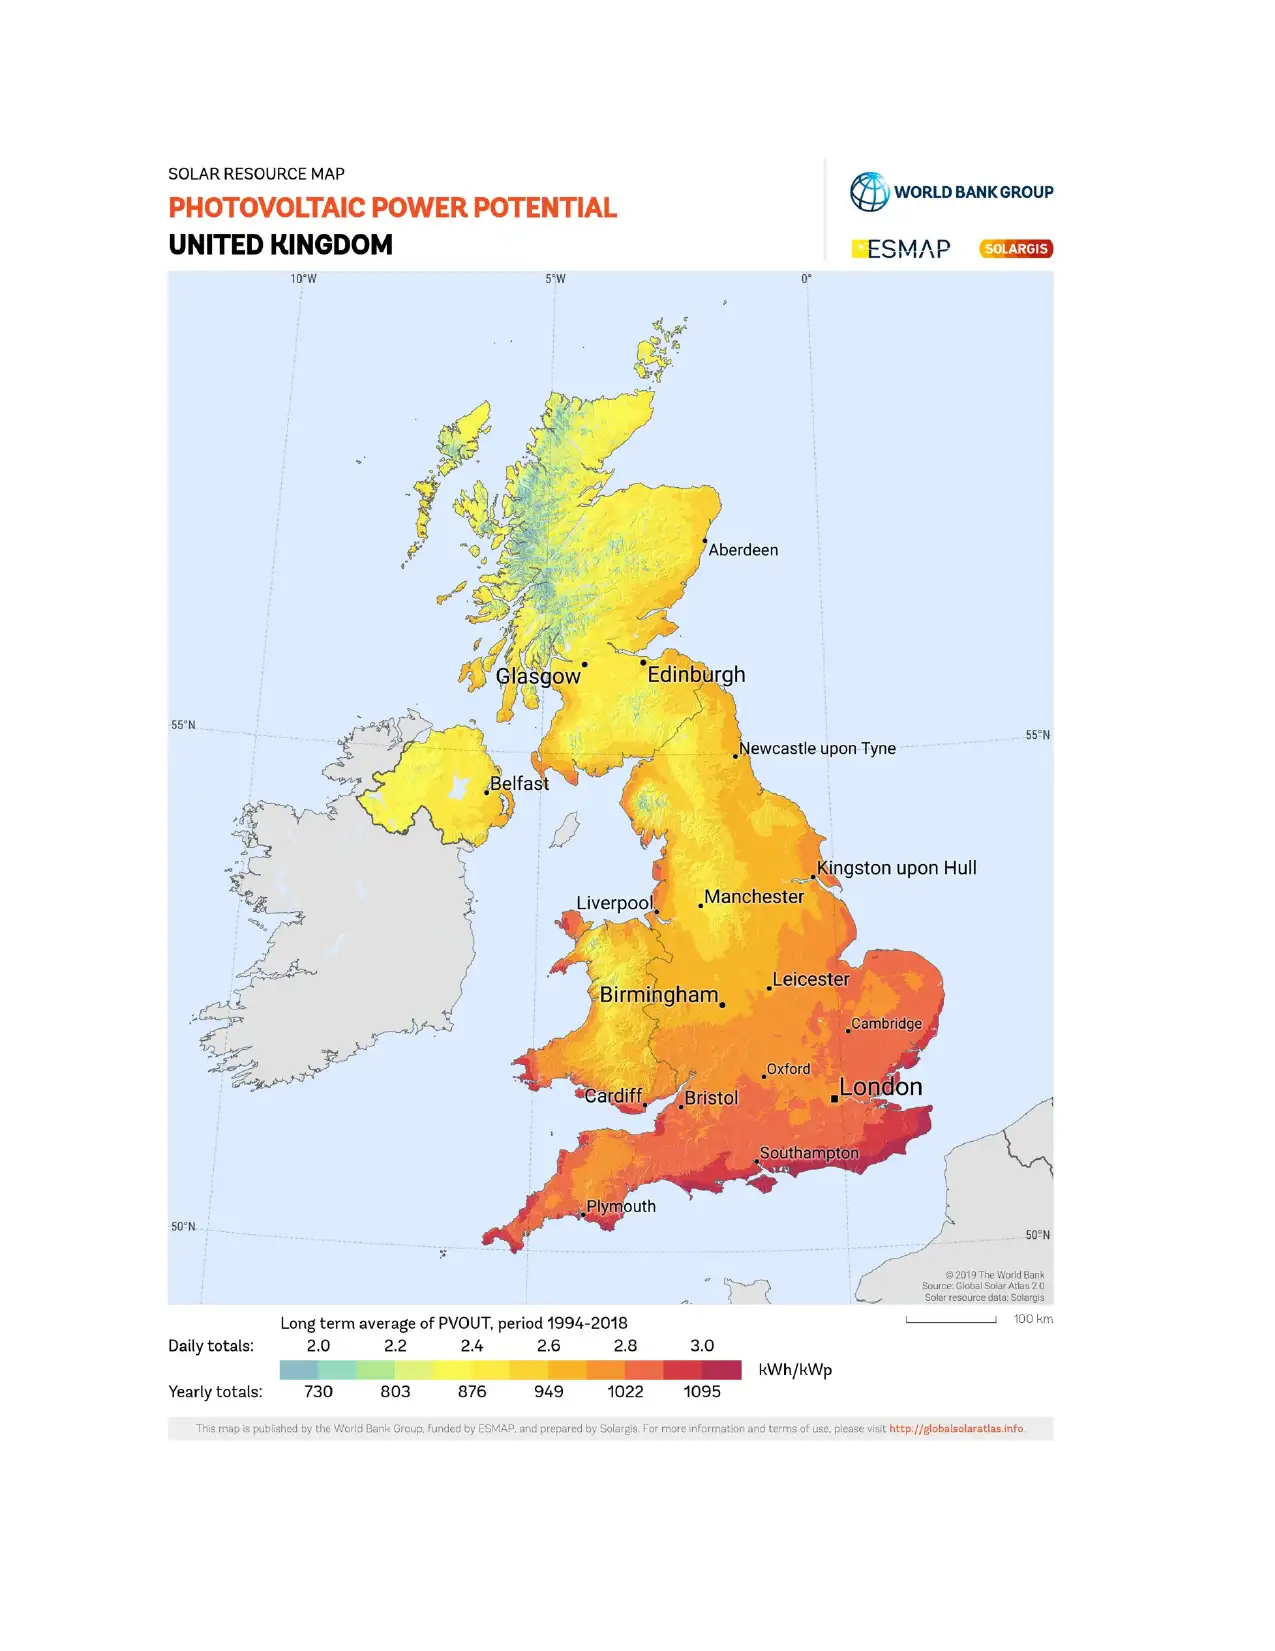
The proposed coordinates of the estate are 5037’52’’N and 119’27” W (or 50.63111N and
1.32417W), which is a plot of land close to Kingston, on the Isle of Wight. This location has a
specific annual PV yield greater than 1095 kWh/kWp, and, therefore, one of the places with the
highest PV yield in the UK. Generally, any of the dark red regions would be acceptable.
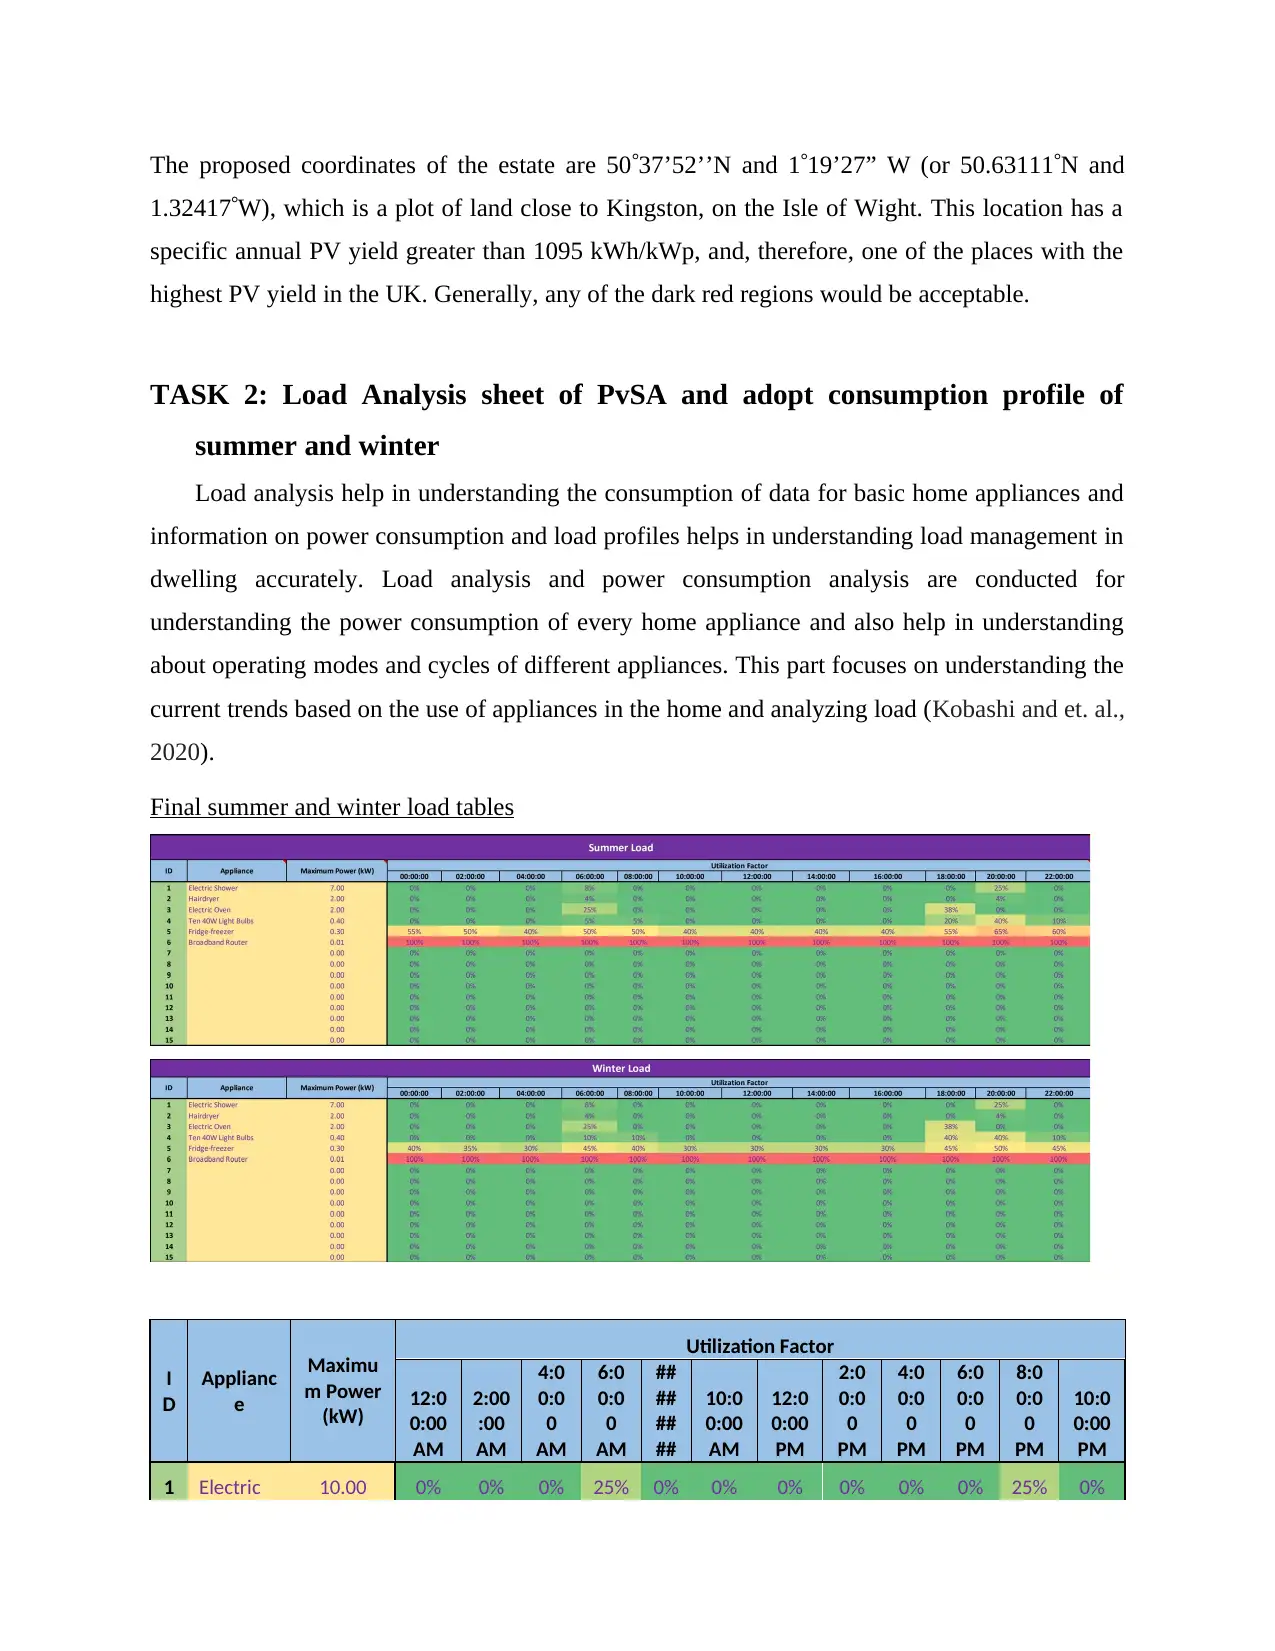
TASK 2: Load Analysis sheet of PvSA and adopt consumption profile of
summer and winter
Load analysis help in understanding the consumption of data for basic home appliances and
information on power consumption and load profiles helps in understanding load management in
dwelling accurately. Load analysis and power consumption analysis are conducted for
understanding the power consumption of every home appliance and also help in understanding
about operating modes and cycles of different appliances. This part focuses on understanding the
current trends based on the use of appliances in the home and analyzing load (Kobashi and et. al.,
2020).
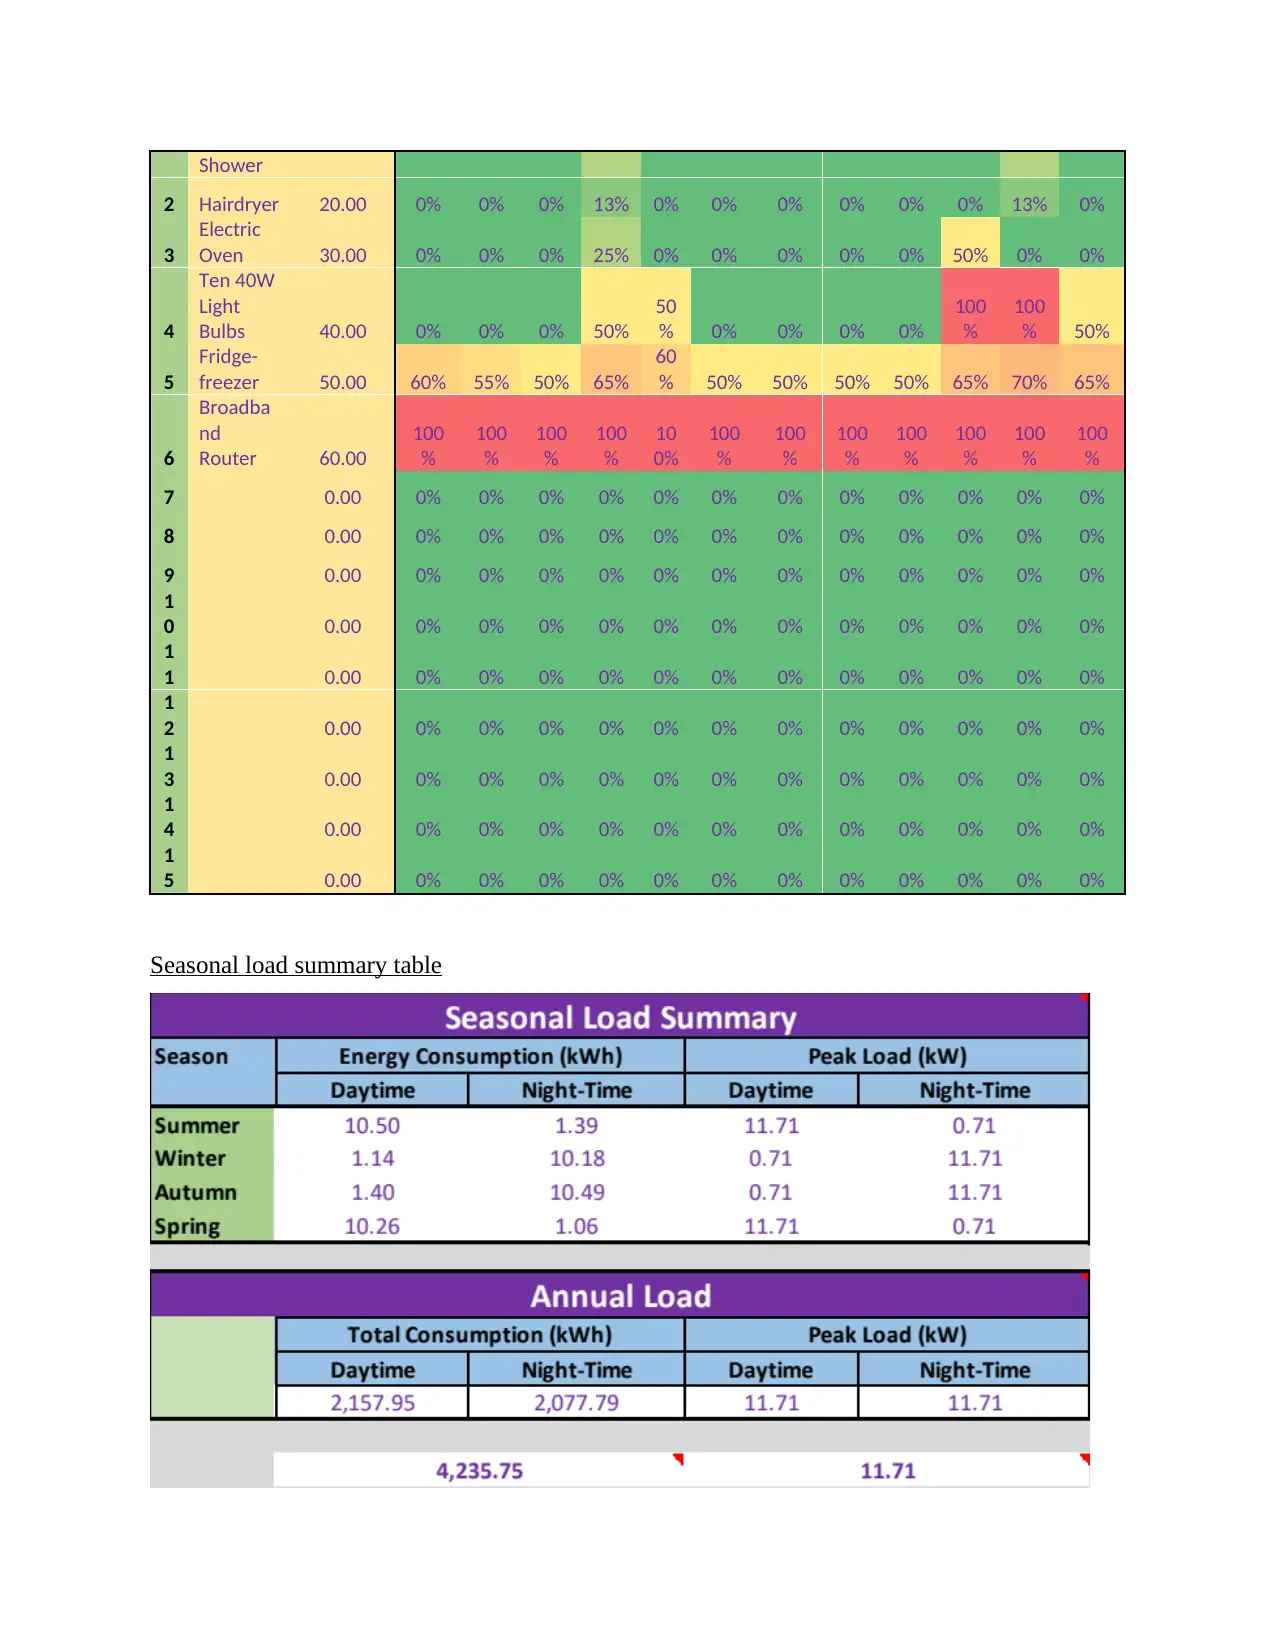
Final summer and winter load tables
I
D
Applianc
e
Maximu
m Power
(kW)
Utilization Factor
12:0
0:00
AM
2:00
:00
AM
4:0
0:0
0
AM
6:0
0:0
0
AM
##
##
##
##
10:0
0:00
AM
12:0
0:00
PM
2:0
0:0
0
PM
4:0
0:0
0
PM
6:0
0:0
0
PM
8:0
0:0
0
PM
10:0
0:00
PM
1 Electric 10.00 0% 0% 0% 25% 0% 0% 0% 0% 0% 0% 25% 0%
1.32417W), which is a plot of land close to Kingston, on the Isle of Wight. This location has a
specific annual PV yield greater than 1095 kWh/kWp, and, therefore, one of the places with the
highest PV yield in the UK. Generally, any of the dark red regions would be acceptable.
TASK 2: Load Analysis sheet of PvSA and adopt consumption profile of
summer and winter
Load analysis help in understanding the consumption of data for basic home appliances and
information on power consumption and load profiles helps in understanding load management in
dwelling accurately. Load analysis and power consumption analysis are conducted for
understanding the power consumption of every home appliance and also help in understanding
about operating modes and cycles of different appliances. This part focuses on understanding the
current trends based on the use of appliances in the home and analyzing load (Kobashi and et. al.,
2020).
Final summer and winter load tables
I
D
Applianc
e
Maximu
m Power
(kW)
Utilization Factor
12:0
0:00
AM
2:00
:00
AM
4:0
0:0
0
AM
6:0
0:0
0
AM
##
##
##
##
10:0
0:00
AM
12:0
0:00
PM
2:0
0:0
0
PM
4:0
0:0
0
PM
6:0
0:0
0
PM
8:0
0:0
0
PM
10:0
0:00
PM
1 Electric 10.00 0% 0% 0% 25% 0% 0% 0% 0% 0% 0% 25% 0%
⊘ This is a preview!⊘
Do you want full access?
Subscribe today to unlock all pages.
Trusted by 1+ million students worldwide
Shower
2 Hairdryer 20.00 0% 0% 0% 13% 0% 0% 0% 0% 0% 0% 13% 0%
3
Electric
Oven 30.00 0% 0% 0% 25% 0% 0% 0% 0% 0% 50% 0% 0%
4
Ten 40W
Light
Bulbs 40.00 0% 0% 0% 50%
50
% 0% 0% 0% 0%
100
%
100
% 50%
5
Fridge-
freezer 50.00 60% 55% 50% 65%
60
% 50% 50% 50% 50% 65% 70% 65%
6
Broadba
nd
Router 60.00
100
%
100
%
100
%
100
%
10
0%
100
%
100
%
100
%
100
%
100
%
100
%
100
%
7 0.00 0% 0% 0% 0% 0% 0% 0% 0% 0% 0% 0% 0%
8 0.00 0% 0% 0% 0% 0% 0% 0% 0% 0% 0% 0% 0%
9 0.00 0% 0% 0% 0% 0% 0% 0% 0% 0% 0% 0% 0%
1
0 0.00 0% 0% 0% 0% 0% 0% 0% 0% 0% 0% 0% 0%
1
1 0.00 0% 0% 0% 0% 0% 0% 0% 0% 0% 0% 0% 0%
1
2 0.00 0% 0% 0% 0% 0% 0% 0% 0% 0% 0% 0% 0%
1
3 0.00 0% 0% 0% 0% 0% 0% 0% 0% 0% 0% 0% 0%
1
4 0.00 0% 0% 0% 0% 0% 0% 0% 0% 0% 0% 0% 0%
1
5 0.00 0% 0% 0% 0% 0% 0% 0% 0% 0% 0% 0% 0%
Seasonal load summary table
Paraphrase This Document
Need a fresh take? Get an instant paraphrase of this document with our AI Paraphraser
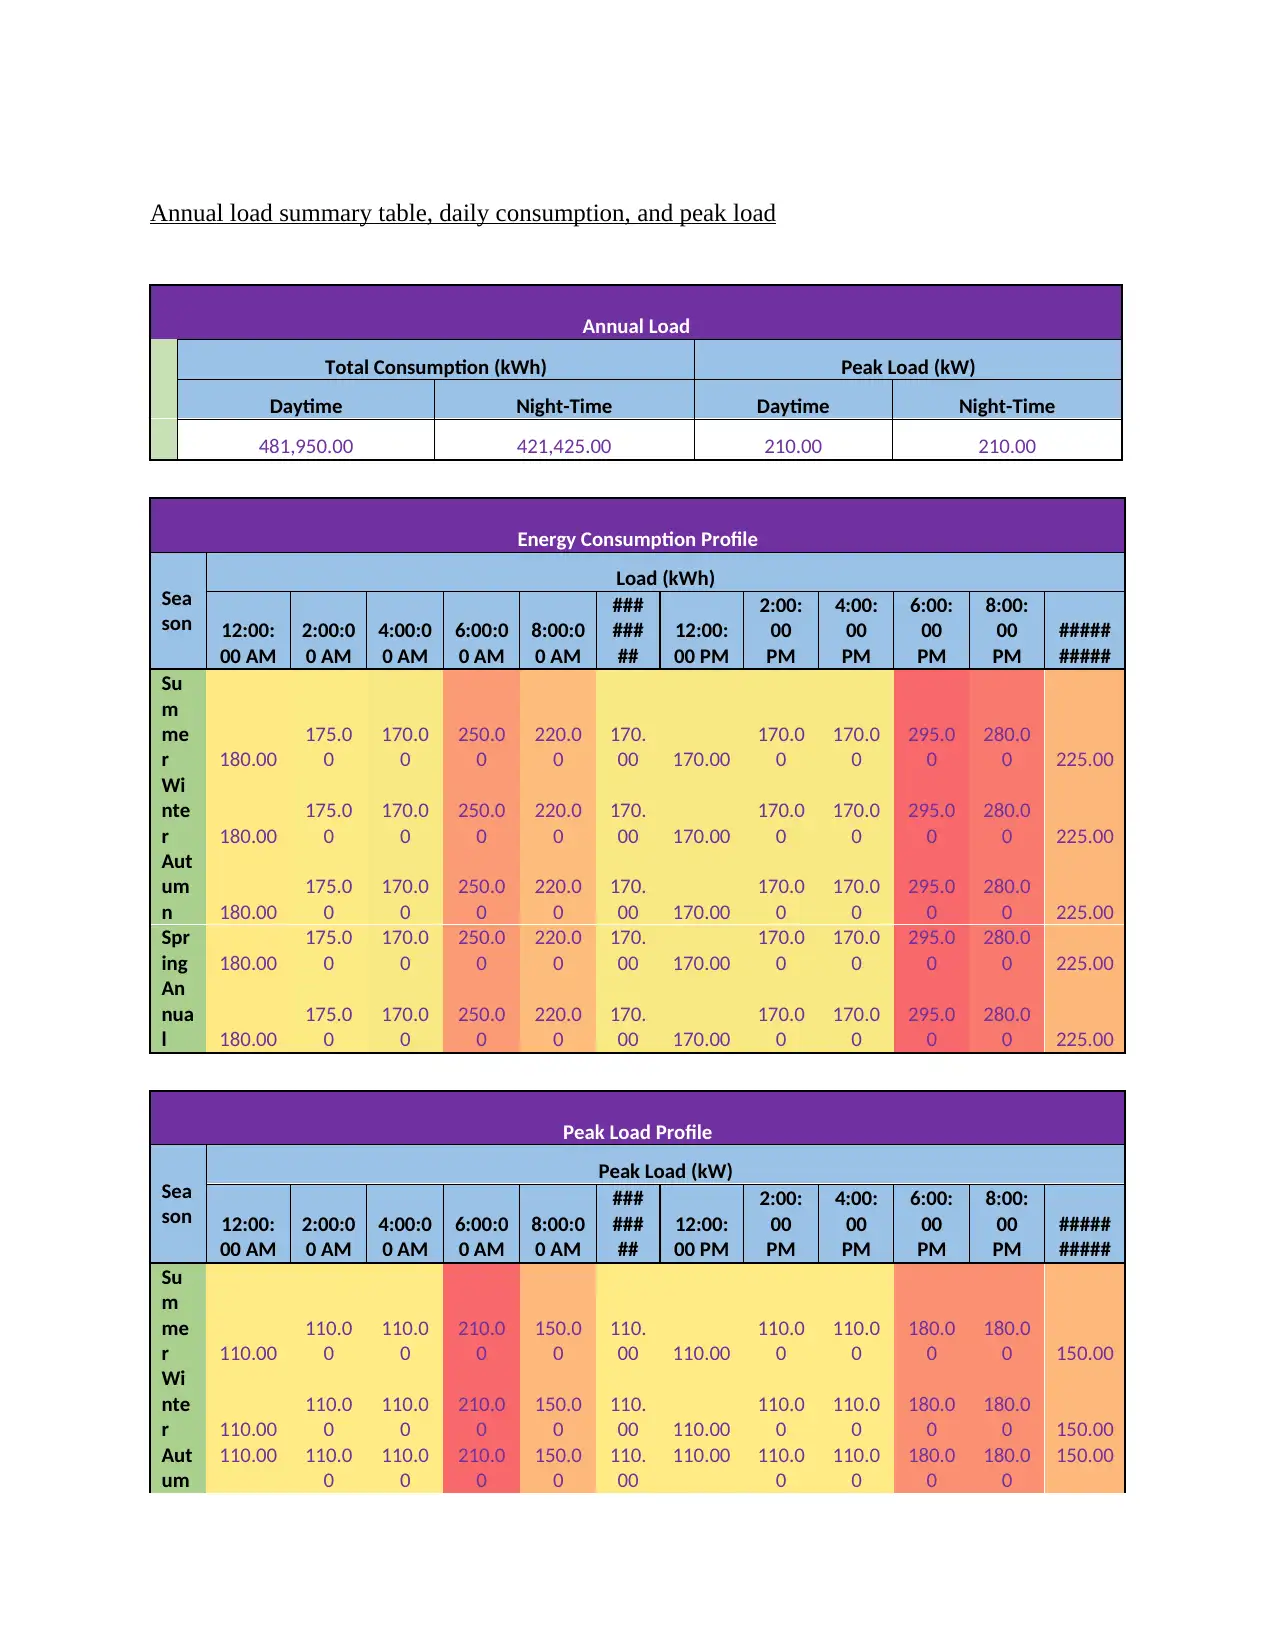
Annual load summary table, daily consumption, and peak load
Annual Load
Total Consumption (kWh) Peak Load (kW)
Daytime Night-Time Daytime Night-Time
481,950.00 421,425.00 210.00 210.00
Energy Consumption Profile
Sea
son
Load (kWh)
12:00:
00 AM
2:00:0
0 AM
4:00:0
0 AM
6:00:0
0 AM
8:00:0
0 AM
###
###
##
12:00:
00 PM
2:00:
00
PM
4:00:
00
PM
6:00:
00
PM
8:00:
00
PM
#####
#####
Su
m
me
r 180.00
175.0
0
170.0
0
250.0
0
220.0
0
170.
00 170.00
170.0
0
170.0
0
295.0
0
280.0
0 225.00
Wi
nte
r 180.00
175.0
0
170.0
0
250.0
0
220.0
0
170.
00 170.00
170.0
0
170.0
0
295.0
0
280.0
0 225.00
Aut
um
n 180.00
175.0
0
170.0
0
250.0
0
220.0
0
170.
00 170.00
170.0
0
170.0
0
295.0
0
280.0
0 225.00
Spr
ing 180.00
175.0
0
170.0
0
250.0
0
220.0
0
170.
00 170.00
170.0
0
170.0
0
295.0
0
280.0
0 225.00
An
nua
l 180.00
175.0
0
170.0
0
250.0
0
220.0
0
170.
00 170.00
170.0
0
170.0
0
295.0
0
280.0
0 225.00
Peak Load Profile
Sea
son
Peak Load (kW)
12:00:
00 AM
2:00:0
0 AM
4:00:0
0 AM
6:00:0
0 AM
8:00:0
0 AM
###
###
##
12:00:
00 PM
2:00:
00
PM
4:00:
00
PM
6:00:
00
PM
8:00:
00
PM
#####
#####
Su
m
me
r 110.00
110.0
0
110.0
0
210.0
0
150.0
0
110.
00 110.00
110.0
0
110.0
0
180.0
0
180.0
0 150.00
Wi
nte
r 110.00
110.0
0
110.0
0
210.0
0
150.0
0
110.
00 110.00
110.0
0
110.0
0
180.0
0
180.0
0 150.00
Aut
um
110.00 110.0
0
110.0
0
210.0
0
150.0
0
110.
00
110.00 110.0
0
110.0
0
180.0
0
180.0
0
150.00
n
Spr
ing 110.00
110.0
0
110.0
0
210.0
0
150.0
0
110.
00 110.00
110.0
0
110.0
0
180.0
0
180.0
0 150.00
An
nua
l 110.00
110.0
0
110.0
0
210.0
0
150.0
0
110.
00 110.00
110.0
0
110.0
0
180.0
0
180.0
0 150.00
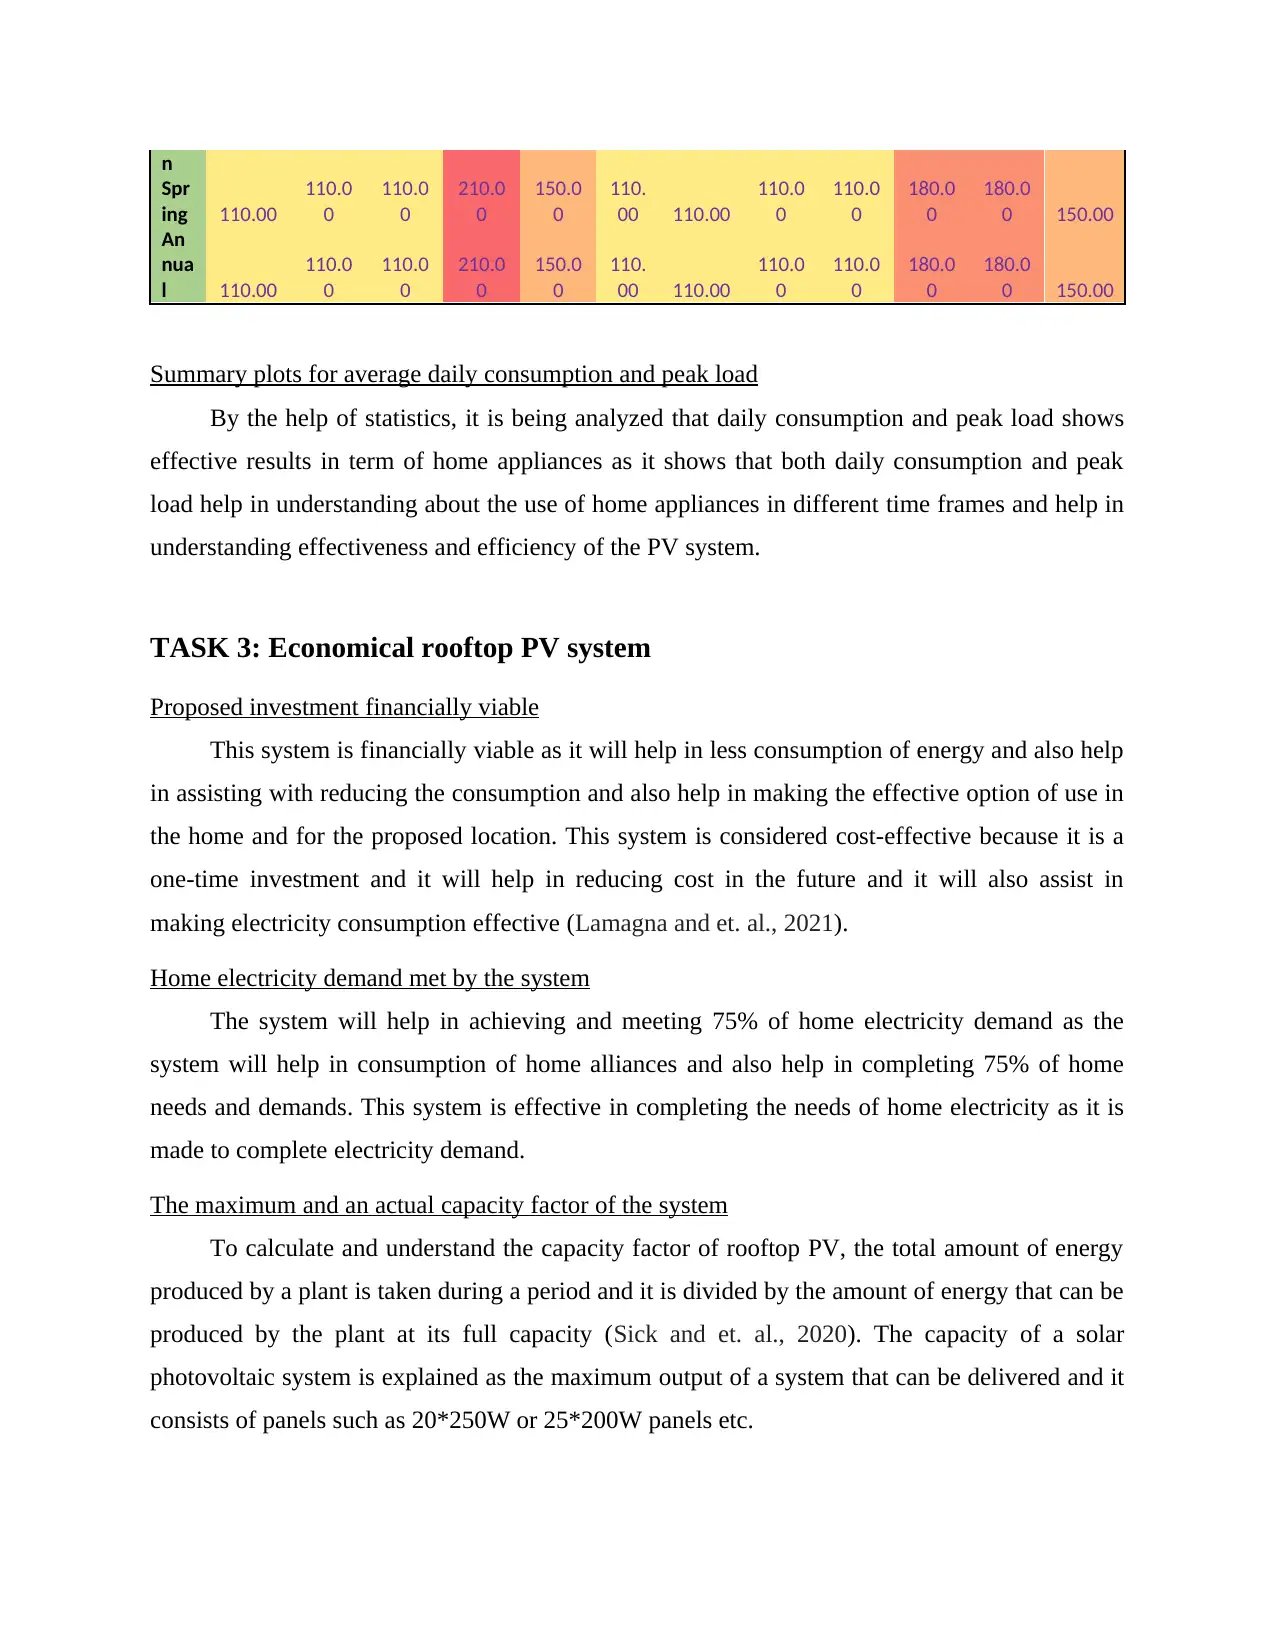
Summary plots for average daily consumption and peak load
By the help of statistics, it is being analyzed that daily consumption and peak load shows
effective results in term of home appliances as it shows that both daily consumption and peak
load help in understanding about the use of home appliances in different time frames and help in
understanding effectiveness and efficiency of the PV system.
TASK 3: Economical rooftop PV system
Proposed investment financially viable
This system is financially viable as it will help in less consumption of energy and also help
in assisting with reducing the consumption and also help in making the effective option of use in
the home and for the proposed location. This system is considered cost-effective because it is a
one-time investment and it will help in reducing cost in the future and it will also assist in
making electricity consumption effective (Lamagna and et. al., 2021).
Home electricity demand met by the system
The system will help in achieving and meeting 75% of home electricity demand as the
system will help in consumption of home alliances and also help in completing 75% of home
needs and demands. This system is effective in completing the needs of home electricity as it is
made to complete electricity demand.
The maximum and an actual capacity factor of the system
To calculate and understand the capacity factor of rooftop PV, the total amount of energy
produced by a plant is taken during a period and it is divided by the amount of energy that can be
produced by the plant at its full capacity (Sick and et. al., 2020). The capacity of a solar
photovoltaic system is explained as the maximum output of a system that can be delivered and it
consists of panels such as 20*250W or 25*200W panels etc.
Spr
ing 110.00
110.0
0
110.0
0
210.0
0
150.0
0
110.
00 110.00
110.0
0
110.0
0
180.0
0
180.0
0 150.00
An
nua
l 110.00
110.0
0
110.0
0
210.0
0
150.0
0
110.
00 110.00
110.0
0
110.0
0
180.0
0
180.0
0 150.00
Summary plots for average daily consumption and peak load
By the help of statistics, it is being analyzed that daily consumption and peak load shows
effective results in term of home appliances as it shows that both daily consumption and peak
load help in understanding about the use of home appliances in different time frames and help in
understanding effectiveness and efficiency of the PV system.
TASK 3: Economical rooftop PV system
Proposed investment financially viable
This system is financially viable as it will help in less consumption of energy and also help
in assisting with reducing the consumption and also help in making the effective option of use in
the home and for the proposed location. This system is considered cost-effective because it is a
one-time investment and it will help in reducing cost in the future and it will also assist in
making electricity consumption effective (Lamagna and et. al., 2021).
Home electricity demand met by the system
The system will help in achieving and meeting 75% of home electricity demand as the
system will help in consumption of home alliances and also help in completing 75% of home
needs and demands. This system is effective in completing the needs of home electricity as it is
made to complete electricity demand.
The maximum and an actual capacity factor of the system
To calculate and understand the capacity factor of rooftop PV, the total amount of energy
produced by a plant is taken during a period and it is divided by the amount of energy that can be
produced by the plant at its full capacity (Sick and et. al., 2020). The capacity of a solar
photovoltaic system is explained as the maximum output of a system that can be delivered and it
consists of panels such as 20*250W or 25*200W panels etc.
⊘ This is a preview!⊘
Do you want full access?
Subscribe today to unlock all pages.
Trusted by 1+ million students worldwide
CO2 saved annually
Carbon intensity in the south of the UK is considered low as it is recorded at 147gCO2/kWh
and carbon intensity of electricity is measured in kilowatt-hour of energy consumed. This way
carbon emission from the PV system can be analyzed.
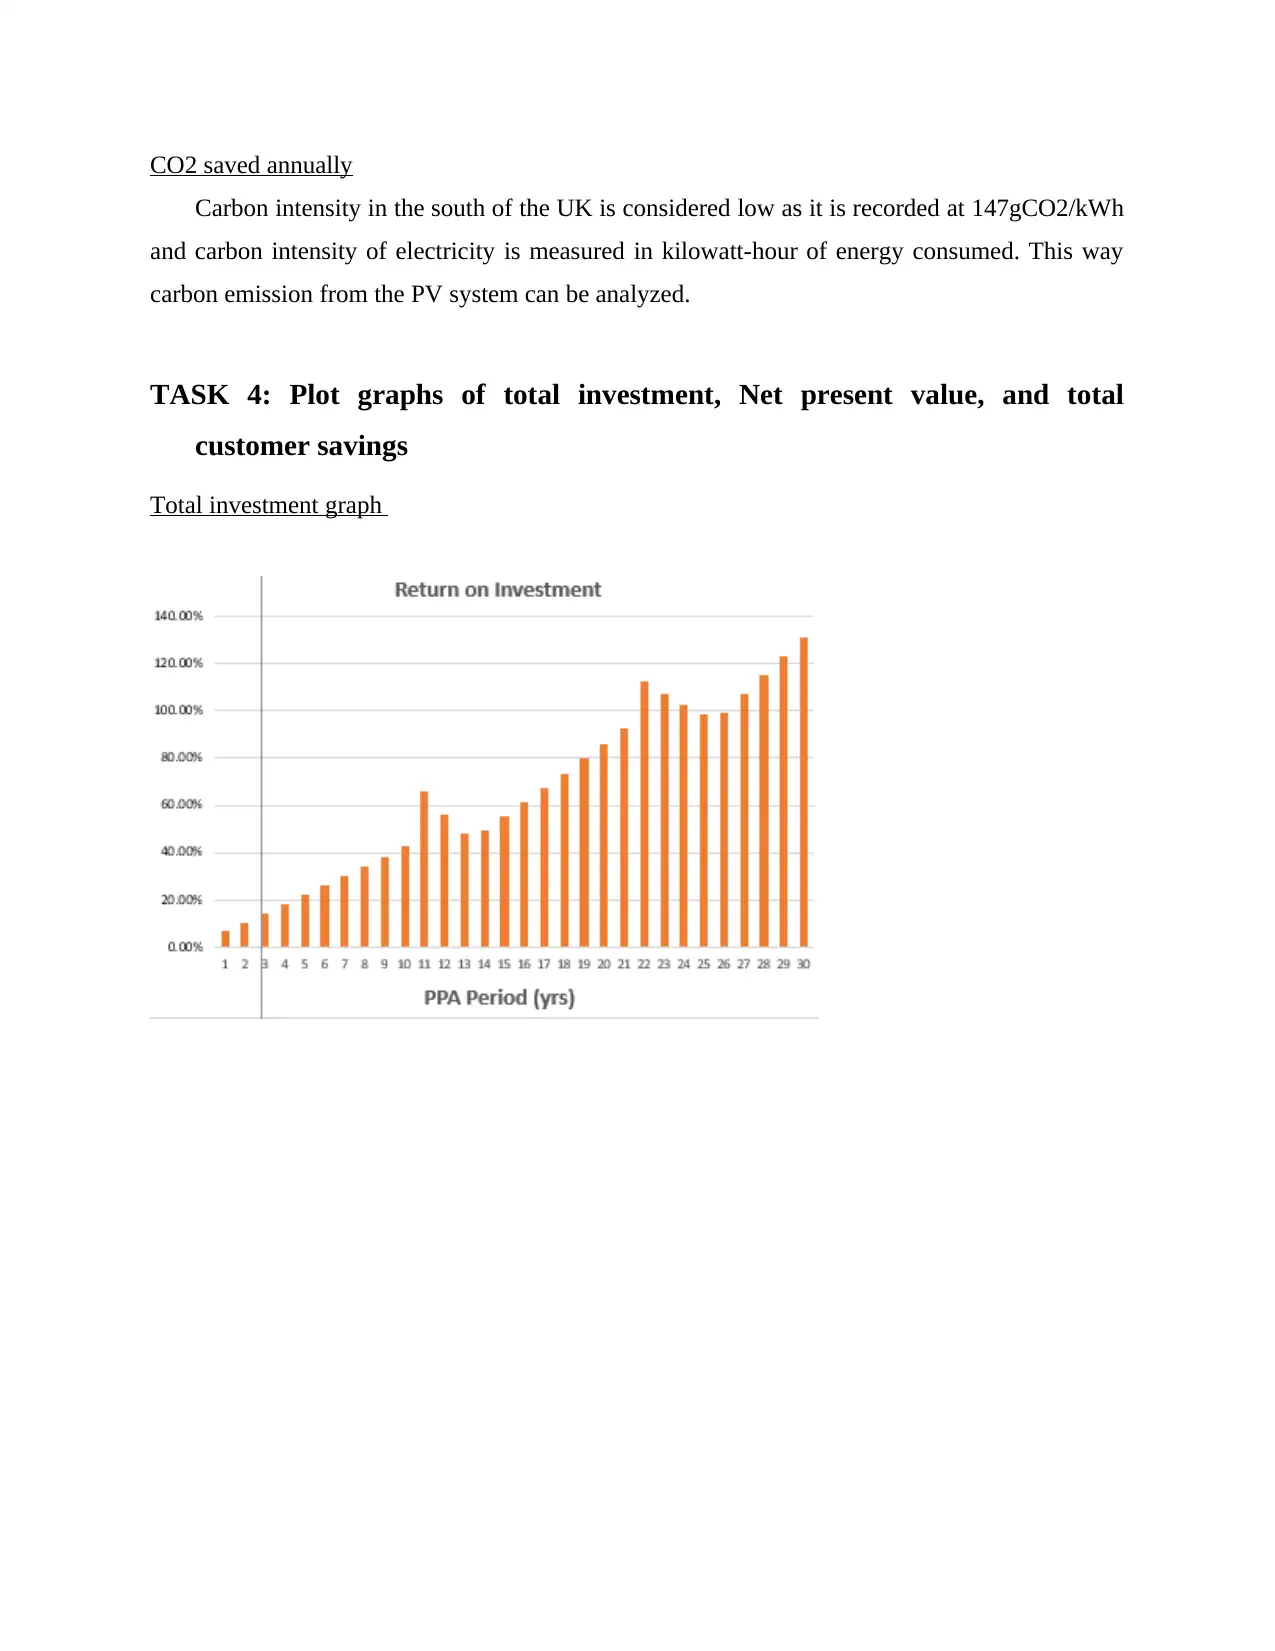
TASK 4: Plot graphs of total investment, Net present value, and total
customer savings
Total investment graph
Carbon intensity in the south of the UK is considered low as it is recorded at 147gCO2/kWh
and carbon intensity of electricity is measured in kilowatt-hour of energy consumed. This way
carbon emission from the PV system can be analyzed.
TASK 4: Plot graphs of total investment, Net present value, and total
customer savings
Total investment graph
Paraphrase This Document
Need a fresh take? Get an instant paraphrase of this document with our AI Paraphraser
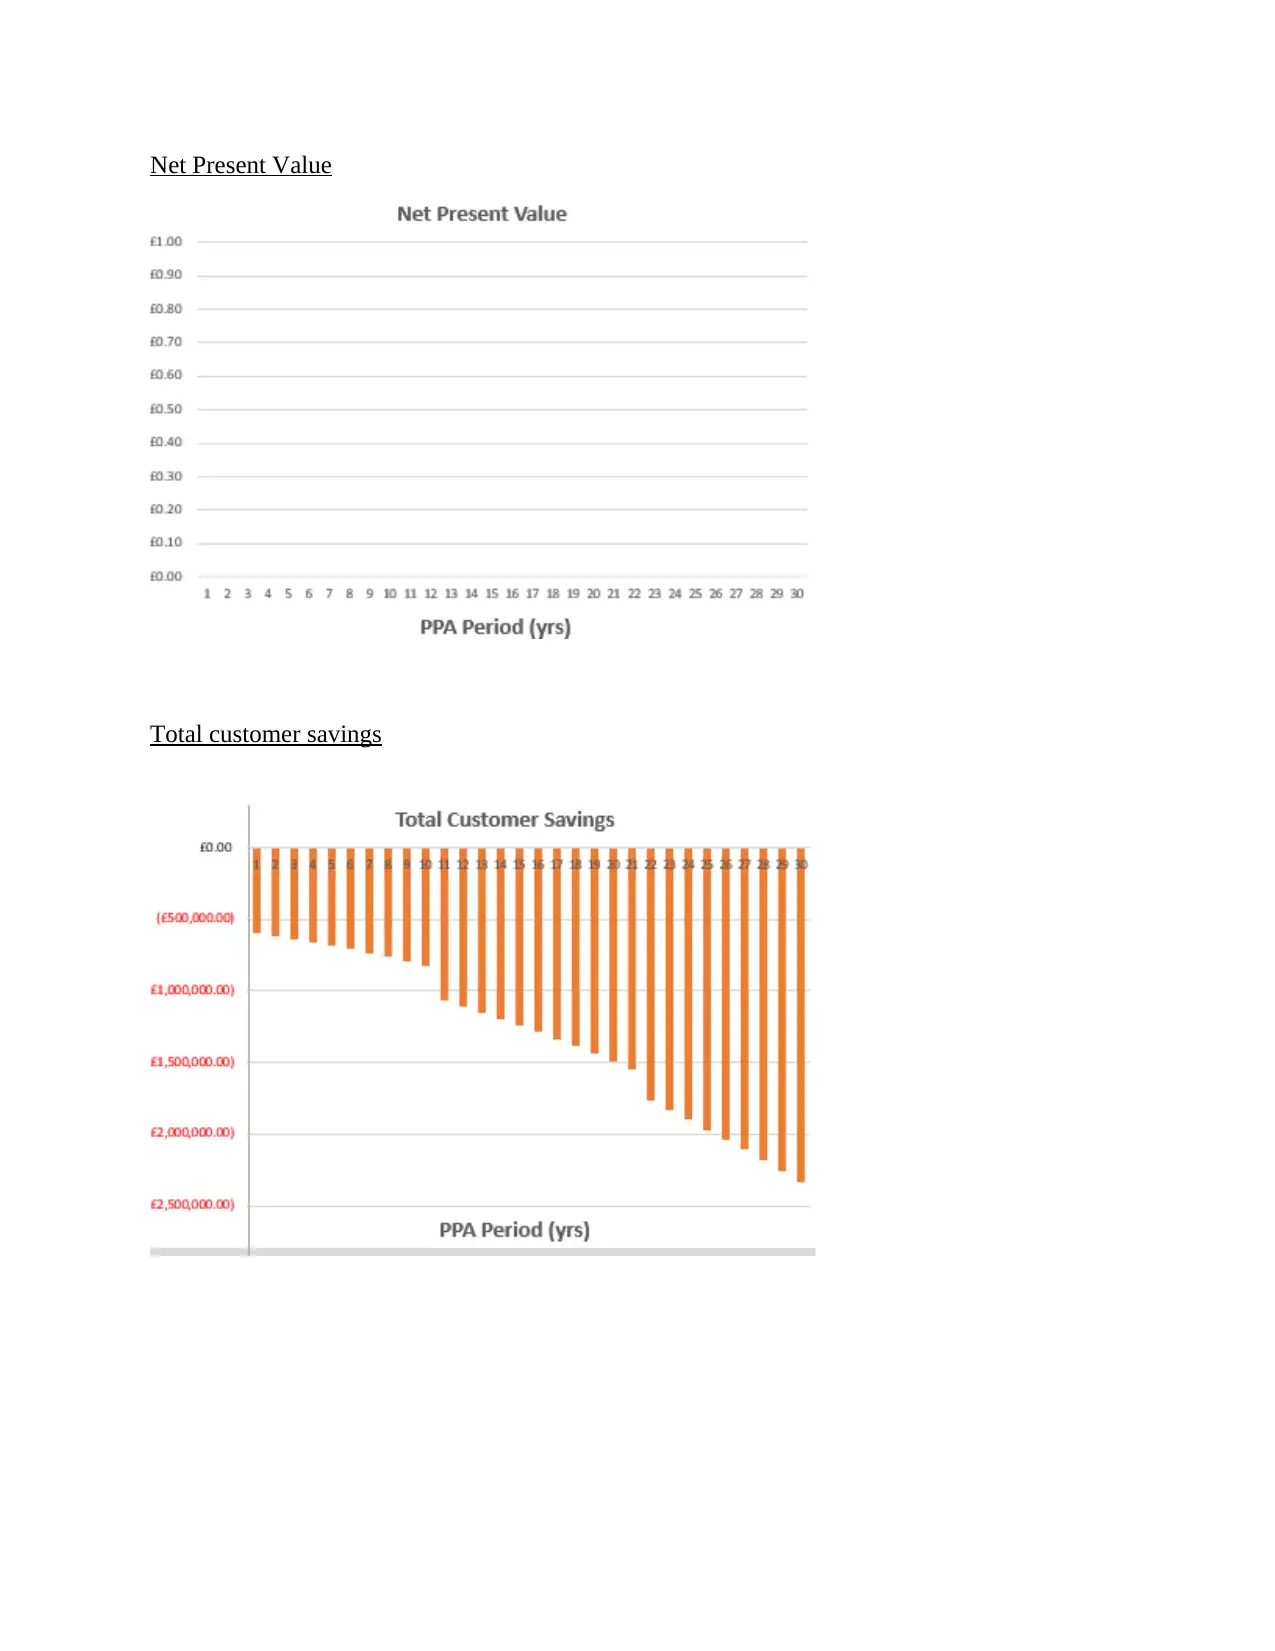
Net Present Value
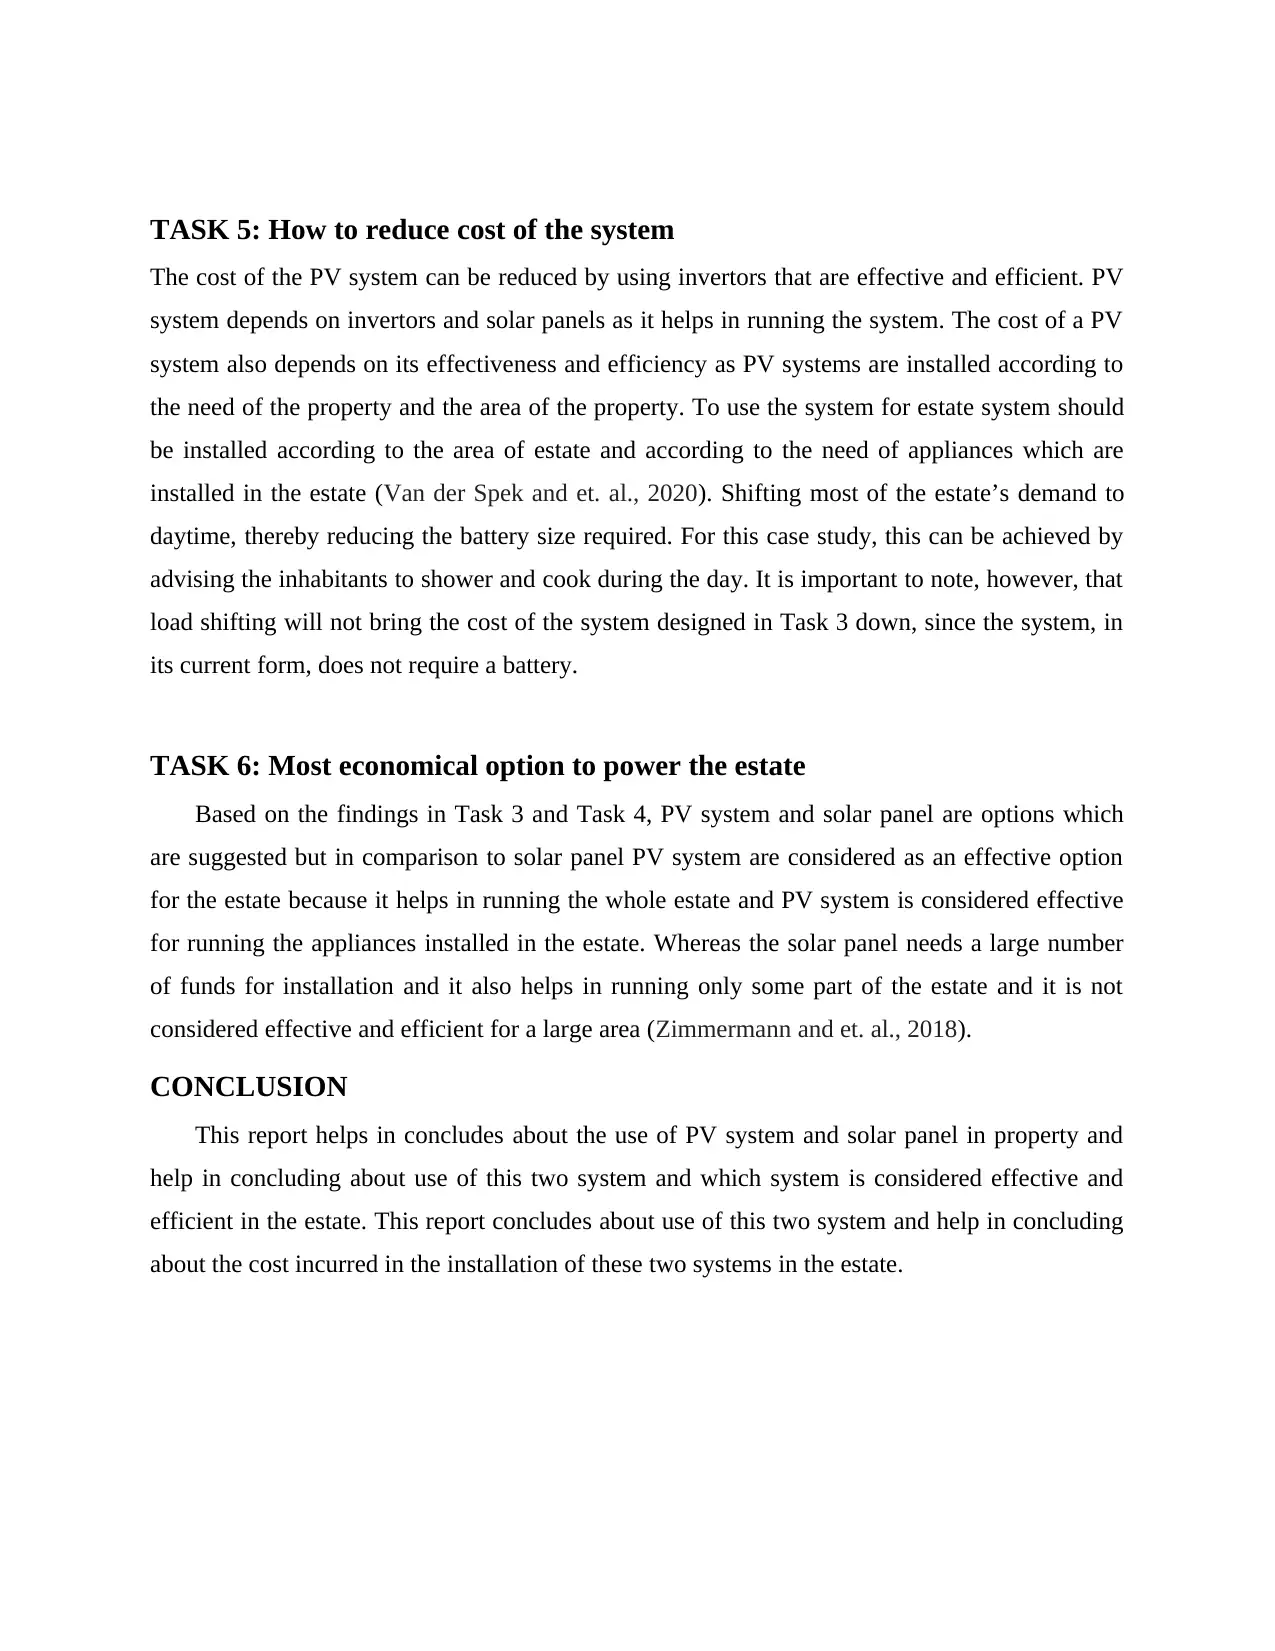
Total customer savings
Total customer savings
TASK 5: How to reduce cost of the system
The cost of the PV system can be reduced by using invertors that are effective and efficient. PV
system depends on invertors and solar panels as it helps in running the system. The cost of a PV
system also depends on its effectiveness and efficiency as PV systems are installed according to
the need of the property and the area of the property. To use the system for estate system should
be installed according to the area of estate and according to the need of appliances which are
installed in the estate (Van der Spek and et. al., 2020). Shifting most of the estate’s demand to
daytime, thereby reducing the battery size required. For this case study, this can be achieved by
advising the inhabitants to shower and cook during the day. It is important to note, however, that
load shifting will not bring the cost of the system designed in Task 3 down, since the system, in
its current form, does not require a battery.
TASK 6: Most economical option to power the estate
Based on the findings in Task 3 and Task 4, PV system and solar panel are options which
are suggested but in comparison to solar panel PV system are considered as an effective option
for the estate because it helps in running the whole estate and PV system is considered effective
for running the appliances installed in the estate. Whereas the solar panel needs a large number
of funds for installation and it also helps in running only some part of the estate and it is not
considered effective and efficient for a large area (Zimmermann and et. al., 2018).
CONCLUSION
This report helps in concludes about the use of PV system and solar panel in property and
help in concluding about use of this two system and which system is considered effective and
efficient in the estate. This report concludes about use of this two system and help in concluding
about the cost incurred in the installation of these two systems in the estate.
⊘ This is a preview!⊘
Do you want full access?
Subscribe today to unlock all pages.
Trusted by 1+ million students worldwide
1 out of 17
Related Documents


Your All-in-One AI-Powered Toolkit for Academic Success.
+13062052269
info@desklib.com
Available 24*7 on WhatsApp / Email
![[object Object]](/_next/static/media/star-bottom.7253800d.svg)
Unlock your academic potential
Copyright © 2020–2026 A2Z Services. All Rights Reserved. Developed and managed by ZUCOL.