De Montfort University: PV System Assessment and Analysis Report
VerifiedAdded on 2022/12/23
|14
|2910
|440
Report
AI Summary
This report provides a techno-economic assessment of a photovoltaic (PV) energy system for property development. It begins by selecting a suitable location in the UK for PV system installation, emphasizing the importance of south-facing panels for optimal sunlight capture. The report includes a detailed load analysis of summer and winter consumption, creating load tables and summary plots. It then evaluates the financial viability of a rooftop PV system, including investment analysis, net present value, and customer savings. The report also explores strategies for reducing system costs and identifies the most economical options for powering an estate with PV systems. The analysis considers factors such as carbon emission reduction and the system's ability to meet home electricity demand. The report concludes with a summary of findings and recommendations for the implementation of PV systems in property development.
Techno-economic
Assessment of Local
Energy Systems
Assessment of Local
Energy Systems
Paraphrase This Document
Need a fresh take? Get an instant paraphrase of this document with our AI Paraphraser
Contents
INTRODUCTION...........................................................................................................................3
TASK 1: Choose suitable location for the property development...................................................3
TASK 2: Load Analysis sheet of PvSA and adopt consumption profile of summer and winter.....3
Final summer and winter load tables......................................................................................4
Seasonal load summary table.................................................................................................5
Annual load summary table, daily consumption and peak load.............................................6
Summary plots for average daily consumption and peak load...............................................7
TASK 3: Economical rooftop PV system........................................................................................7
Proposed investment financially viable..................................................................................7
Home electricity demand met by system................................................................................7
Maximum and actual capacity factor of system.....................................................................7
CO2 saved annually................................................................................................................8
TASK 4: Plot graphs of total investment, Net present value and total customer savings...............8
Total investment graph...........................................................................................................8
Net Present Value...................................................................................................................9
Total customer savings...........................................................................................................9
TASK 5: How to reduce cost of system.........................................................................................10
TASK 6: Most economical option to power the estate..................................................................10
CONCLUSION..............................................................................................................................10
REFERENCES..............................................................................................................................11
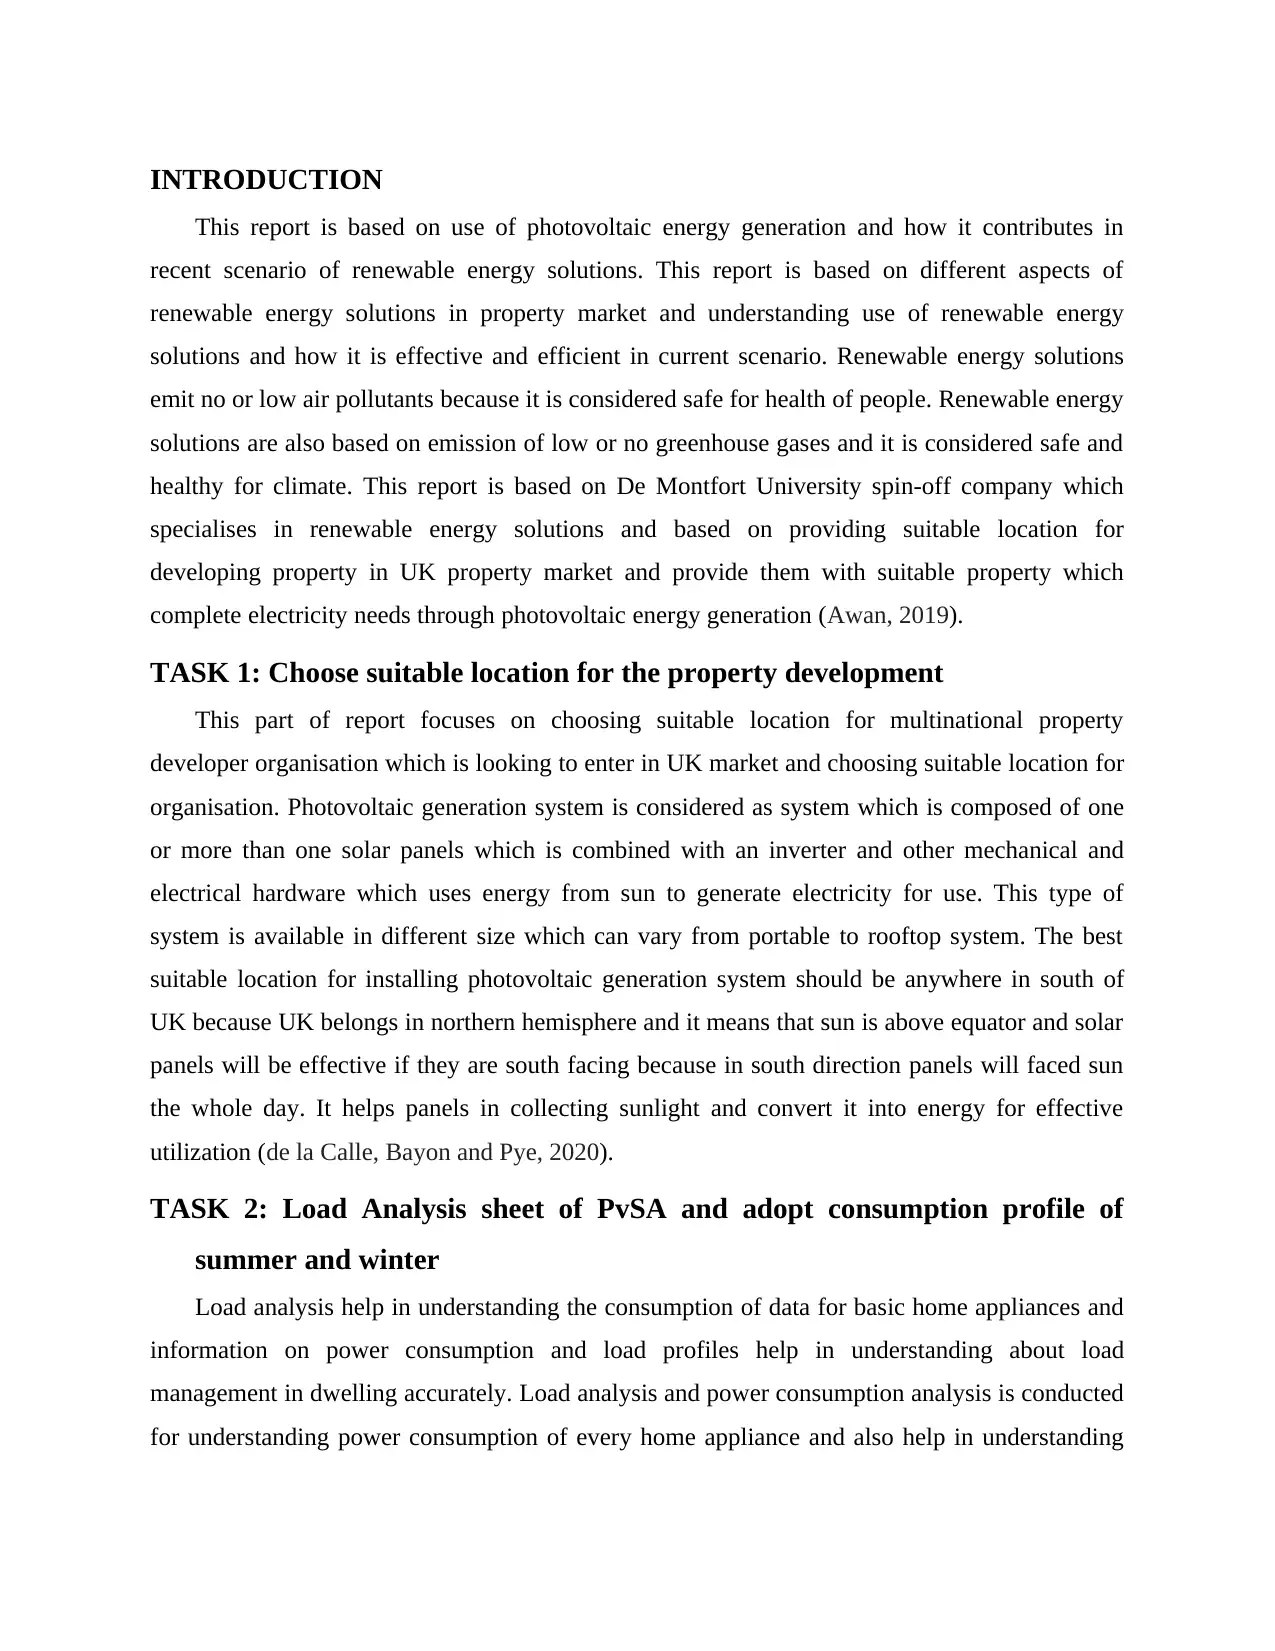
INTRODUCTION
This report is based on use of photovoltaic energy generation and how it contributes in
recent scenario of renewable energy solutions. This report is based on different aspects of
renewable energy solutions in property market and understanding use of renewable energy
solutions and how it is effective and efficient in current scenario. Renewable energy solutions
emit no or low air pollutants because it is considered safe for health of people. Renewable energy
solutions are also based on emission of low or no greenhouse gases and it is considered safe and
healthy for climate. This report is based on De Montfort University spin-off company which
specialises in renewable energy solutions and based on providing suitable location for
developing property in UK property market and provide them with suitable property which
complete electricity needs through photovoltaic energy generation (Awan, 2019).
TASK 1: Choose suitable location for the property development
This part of report focuses on choosing suitable location for multinational property
developer organisation which is looking to enter in UK market and choosing suitable location for
organisation. Photovoltaic generation system is considered as system which is composed of one
or more than one solar panels which is combined with an inverter and other mechanical and
electrical hardware which uses energy from sun to generate electricity for use. This type of
system is available in different size which can vary from portable to rooftop system. The best
suitable location for installing photovoltaic generation system should be anywhere in south of
UK because UK belongs in northern hemisphere and it means that sun is above equator and solar
panels will be effective if they are south facing because in south direction panels will faced sun
the whole day. It helps panels in collecting sunlight and convert it into energy for effective
utilization (de la Calle, Bayon and Pye, 2020).
TASK 2: Load Analysis sheet of PvSA and adopt consumption profile of
summer and winter
Load analysis help in understanding the consumption of data for basic home appliances and
information on power consumption and load profiles help in understanding about load
management in dwelling accurately. Load analysis and power consumption analysis is conducted
for understanding power consumption of every home appliance and also help in understanding
⊘ This is a preview!⊘
Do you want full access?
Subscribe today to unlock all pages.
Trusted by 1+ million students worldwide
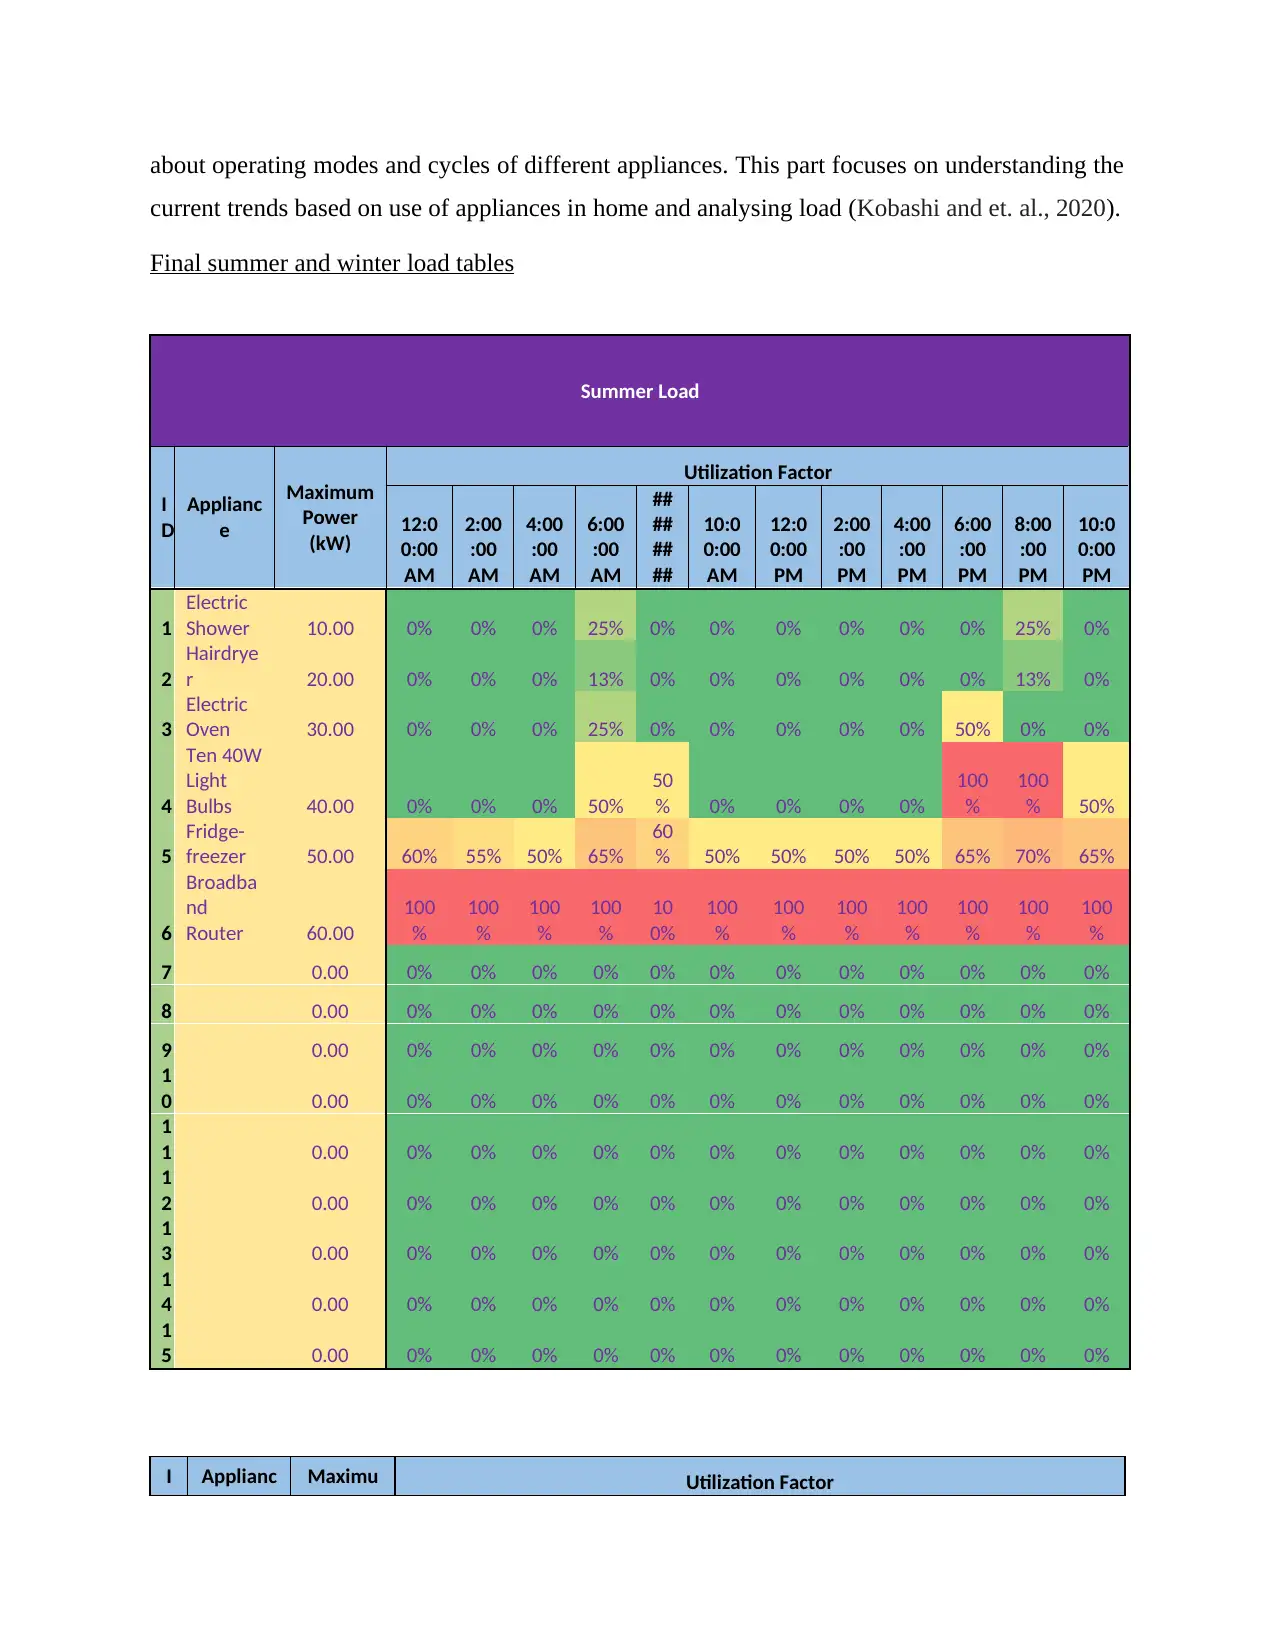
about operating modes and cycles of different appliances. This part focuses on understanding the
current trends based on use of appliances in home and analysing load (Kobashi and et. al., 2020).
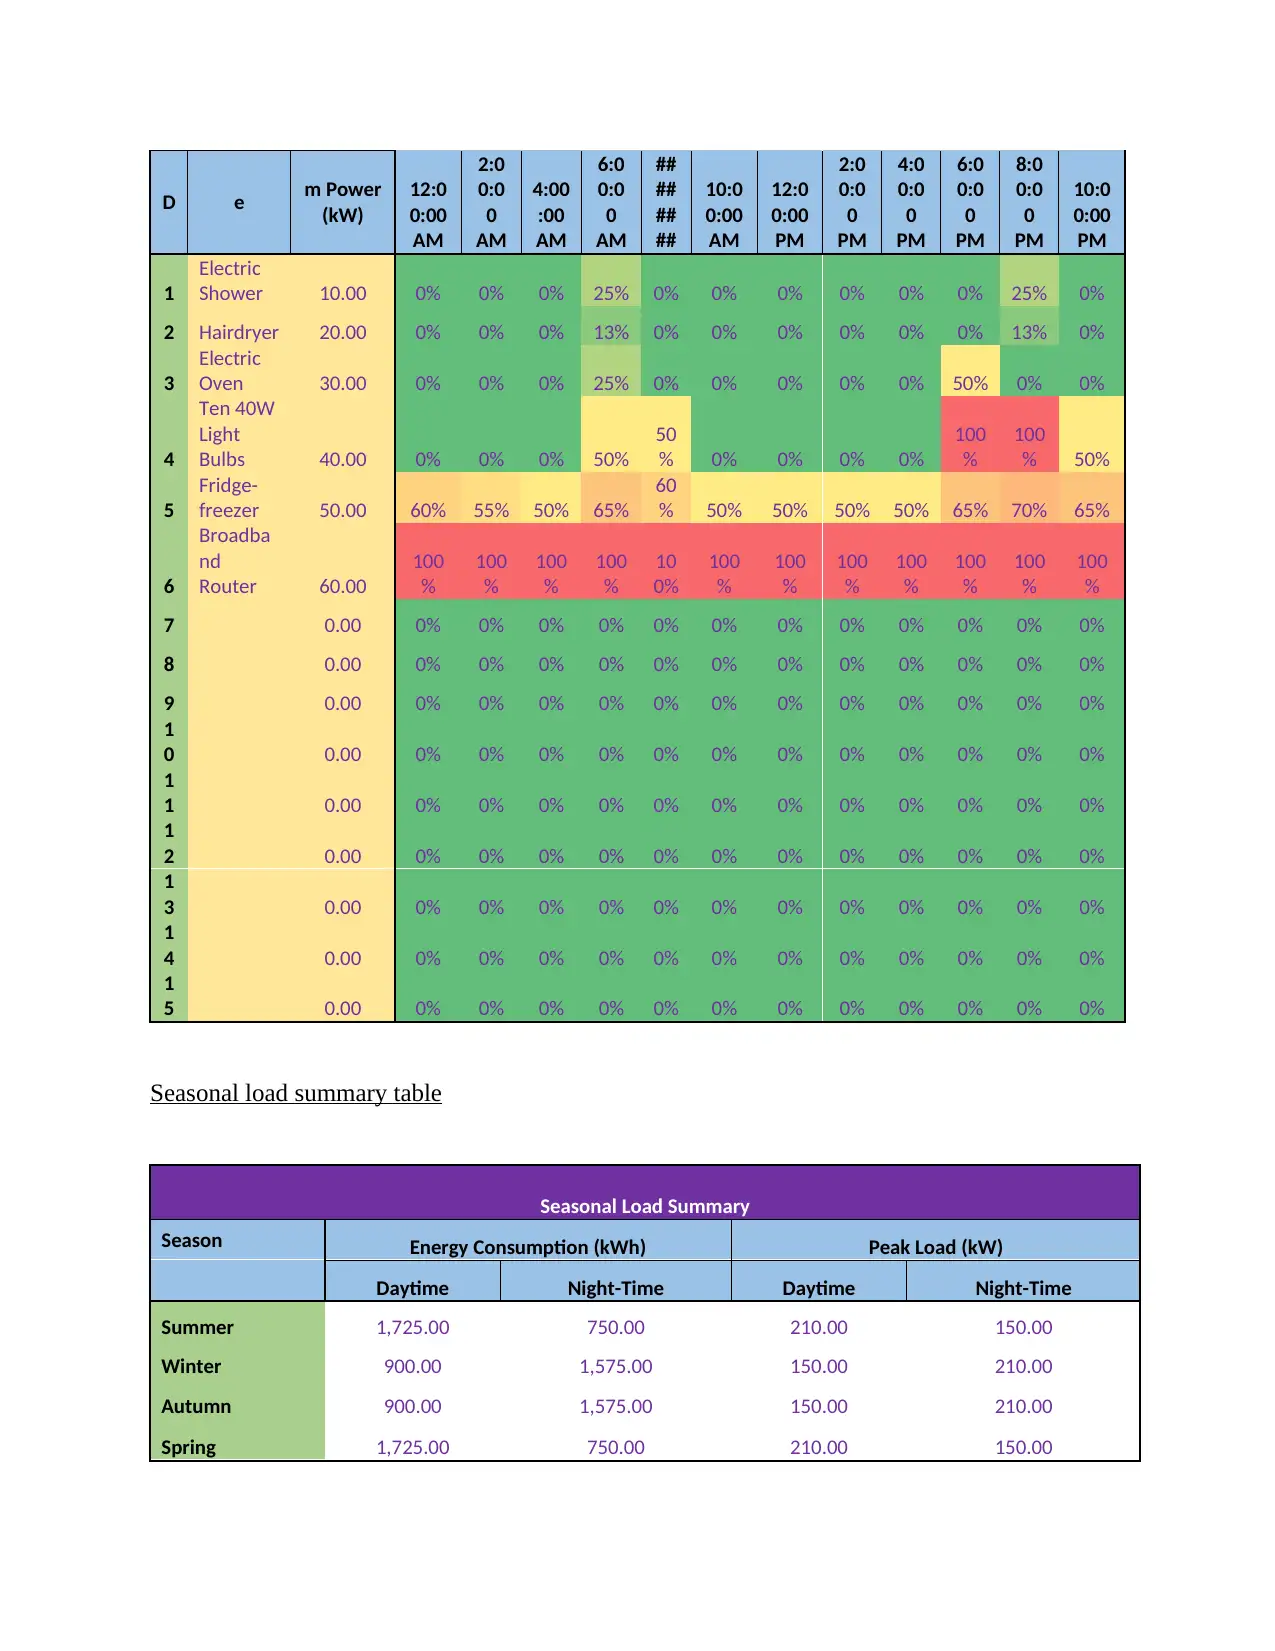
Final summer and winter load tables
Summer Load
I
D
Applianc
e
Maximum
Power
(kW)
Utilization Factor
12:0
0:00
AM
2:00
:00
AM
4:00
:00
AM
6:00
:00
AM
##
##
##
##
10:0
0:00
AM
12:0
0:00
PM
2:00
:00
PM
4:00
:00
PM
6:00
:00
PM
8:00
:00
PM
10:0
0:00
PM
1
Electric
Shower 10.00 0% 0% 0% 25% 0% 0% 0% 0% 0% 0% 25% 0%
2
Hairdrye
r 20.00 0% 0% 0% 13% 0% 0% 0% 0% 0% 0% 13% 0%
3
Electric
Oven 30.00 0% 0% 0% 25% 0% 0% 0% 0% 0% 50% 0% 0%
4
Ten 40W
Light
Bulbs 40.00 0% 0% 0% 50%
50
% 0% 0% 0% 0%
100
%
100
% 50%
5
Fridge-
freezer 50.00 60% 55% 50% 65%
60
% 50% 50% 50% 50% 65% 70% 65%
6
Broadba
nd
Router 60.00
100
%
100
%
100
%
100
%
10
0%
100
%
100
%
100
%
100
%
100
%
100
%
100
%
7 0.00 0% 0% 0% 0% 0% 0% 0% 0% 0% 0% 0% 0%
8 0.00 0% 0% 0% 0% 0% 0% 0% 0% 0% 0% 0% 0%
9 0.00 0% 0% 0% 0% 0% 0% 0% 0% 0% 0% 0% 0%
1
0 0.00 0% 0% 0% 0% 0% 0% 0% 0% 0% 0% 0% 0%
1
1 0.00 0% 0% 0% 0% 0% 0% 0% 0% 0% 0% 0% 0%
1
2 0.00 0% 0% 0% 0% 0% 0% 0% 0% 0% 0% 0% 0%
1
3 0.00 0% 0% 0% 0% 0% 0% 0% 0% 0% 0% 0% 0%
1
4 0.00 0% 0% 0% 0% 0% 0% 0% 0% 0% 0% 0% 0%
1
5 0.00 0% 0% 0% 0% 0% 0% 0% 0% 0% 0% 0% 0%
I Applianc Maximu Utilization Factor
current trends based on use of appliances in home and analysing load (Kobashi and et. al., 2020).
Final summer and winter load tables
Summer Load
I
D
Applianc
e
Maximum
Power
(kW)
Utilization Factor
12:0
0:00
AM
2:00
:00
AM
4:00
:00
AM
6:00
:00
AM
##
##
##
##
10:0
0:00
AM
12:0
0:00
PM
2:00
:00
PM
4:00
:00
PM
6:00
:00
PM
8:00
:00
PM
10:0
0:00
PM
1
Electric
Shower 10.00 0% 0% 0% 25% 0% 0% 0% 0% 0% 0% 25% 0%
2
Hairdrye
r 20.00 0% 0% 0% 13% 0% 0% 0% 0% 0% 0% 13% 0%
3
Electric
Oven 30.00 0% 0% 0% 25% 0% 0% 0% 0% 0% 50% 0% 0%
4
Ten 40W
Light
Bulbs 40.00 0% 0% 0% 50%
50
% 0% 0% 0% 0%
100
%
100
% 50%
5
Fridge-
freezer 50.00 60% 55% 50% 65%
60
% 50% 50% 50% 50% 65% 70% 65%
6
Broadba
nd
Router 60.00
100
%
100
%
100
%
100
%
10
0%
100
%
100
%
100
%
100
%
100
%
100
%
100
%
7 0.00 0% 0% 0% 0% 0% 0% 0% 0% 0% 0% 0% 0%
8 0.00 0% 0% 0% 0% 0% 0% 0% 0% 0% 0% 0% 0%
9 0.00 0% 0% 0% 0% 0% 0% 0% 0% 0% 0% 0% 0%
1
0 0.00 0% 0% 0% 0% 0% 0% 0% 0% 0% 0% 0% 0%
1
1 0.00 0% 0% 0% 0% 0% 0% 0% 0% 0% 0% 0% 0%
1
2 0.00 0% 0% 0% 0% 0% 0% 0% 0% 0% 0% 0% 0%
1
3 0.00 0% 0% 0% 0% 0% 0% 0% 0% 0% 0% 0% 0%
1
4 0.00 0% 0% 0% 0% 0% 0% 0% 0% 0% 0% 0% 0%
1
5 0.00 0% 0% 0% 0% 0% 0% 0% 0% 0% 0% 0% 0%
I Applianc Maximu Utilization Factor
Paraphrase This Document
Need a fresh take? Get an instant paraphrase of this document with our AI Paraphraser
D e m Power
(kW)
12:0
0:00
AM
2:0
0:0
0
AM
4:00
:00
AM
6:0
0:0
0
AM
##
##
##
##
10:0
0:00
AM
12:0
0:00
PM
2:0
0:0
0
PM
4:0
0:0
0
PM
6:0
0:0
0
PM
8:0
0:0
0
PM
10:0
0:00
PM
1
Electric
Shower 10.00 0% 0% 0% 25% 0% 0% 0% 0% 0% 0% 25% 0%
2 Hairdryer 20.00 0% 0% 0% 13% 0% 0% 0% 0% 0% 0% 13% 0%
3
Electric
Oven 30.00 0% 0% 0% 25% 0% 0% 0% 0% 0% 50% 0% 0%
4
Ten 40W
Light
Bulbs 40.00 0% 0% 0% 50%
50
% 0% 0% 0% 0%
100
%
100
% 50%
5
Fridge-
freezer 50.00 60% 55% 50% 65%
60
% 50% 50% 50% 50% 65% 70% 65%
6
Broadba
nd
Router 60.00
100
%
100
%
100
%
100
%
10
0%
100
%
100
%
100
%
100
%
100
%
100
%
100
%
7 0.00 0% 0% 0% 0% 0% 0% 0% 0% 0% 0% 0% 0%
8 0.00 0% 0% 0% 0% 0% 0% 0% 0% 0% 0% 0% 0%
9 0.00 0% 0% 0% 0% 0% 0% 0% 0% 0% 0% 0% 0%
1
0 0.00 0% 0% 0% 0% 0% 0% 0% 0% 0% 0% 0% 0%
1
1 0.00 0% 0% 0% 0% 0% 0% 0% 0% 0% 0% 0% 0%
1
2 0.00 0% 0% 0% 0% 0% 0% 0% 0% 0% 0% 0% 0%
1
3 0.00 0% 0% 0% 0% 0% 0% 0% 0% 0% 0% 0% 0%
1
4 0.00 0% 0% 0% 0% 0% 0% 0% 0% 0% 0% 0% 0%
1
5 0.00 0% 0% 0% 0% 0% 0% 0% 0% 0% 0% 0% 0%
Seasonal load summary table
Seasonal Load Summary
Season Energy Consumption (kWh) Peak Load (kW)
Daytime Night-Time Daytime Night-Time
Summer 1,725.00 750.00 210.00 150.00
Winter 900.00 1,575.00 150.00 210.00
Autumn 900.00 1,575.00 150.00 210.00
Spring 1,725.00 750.00 210.00 150.00
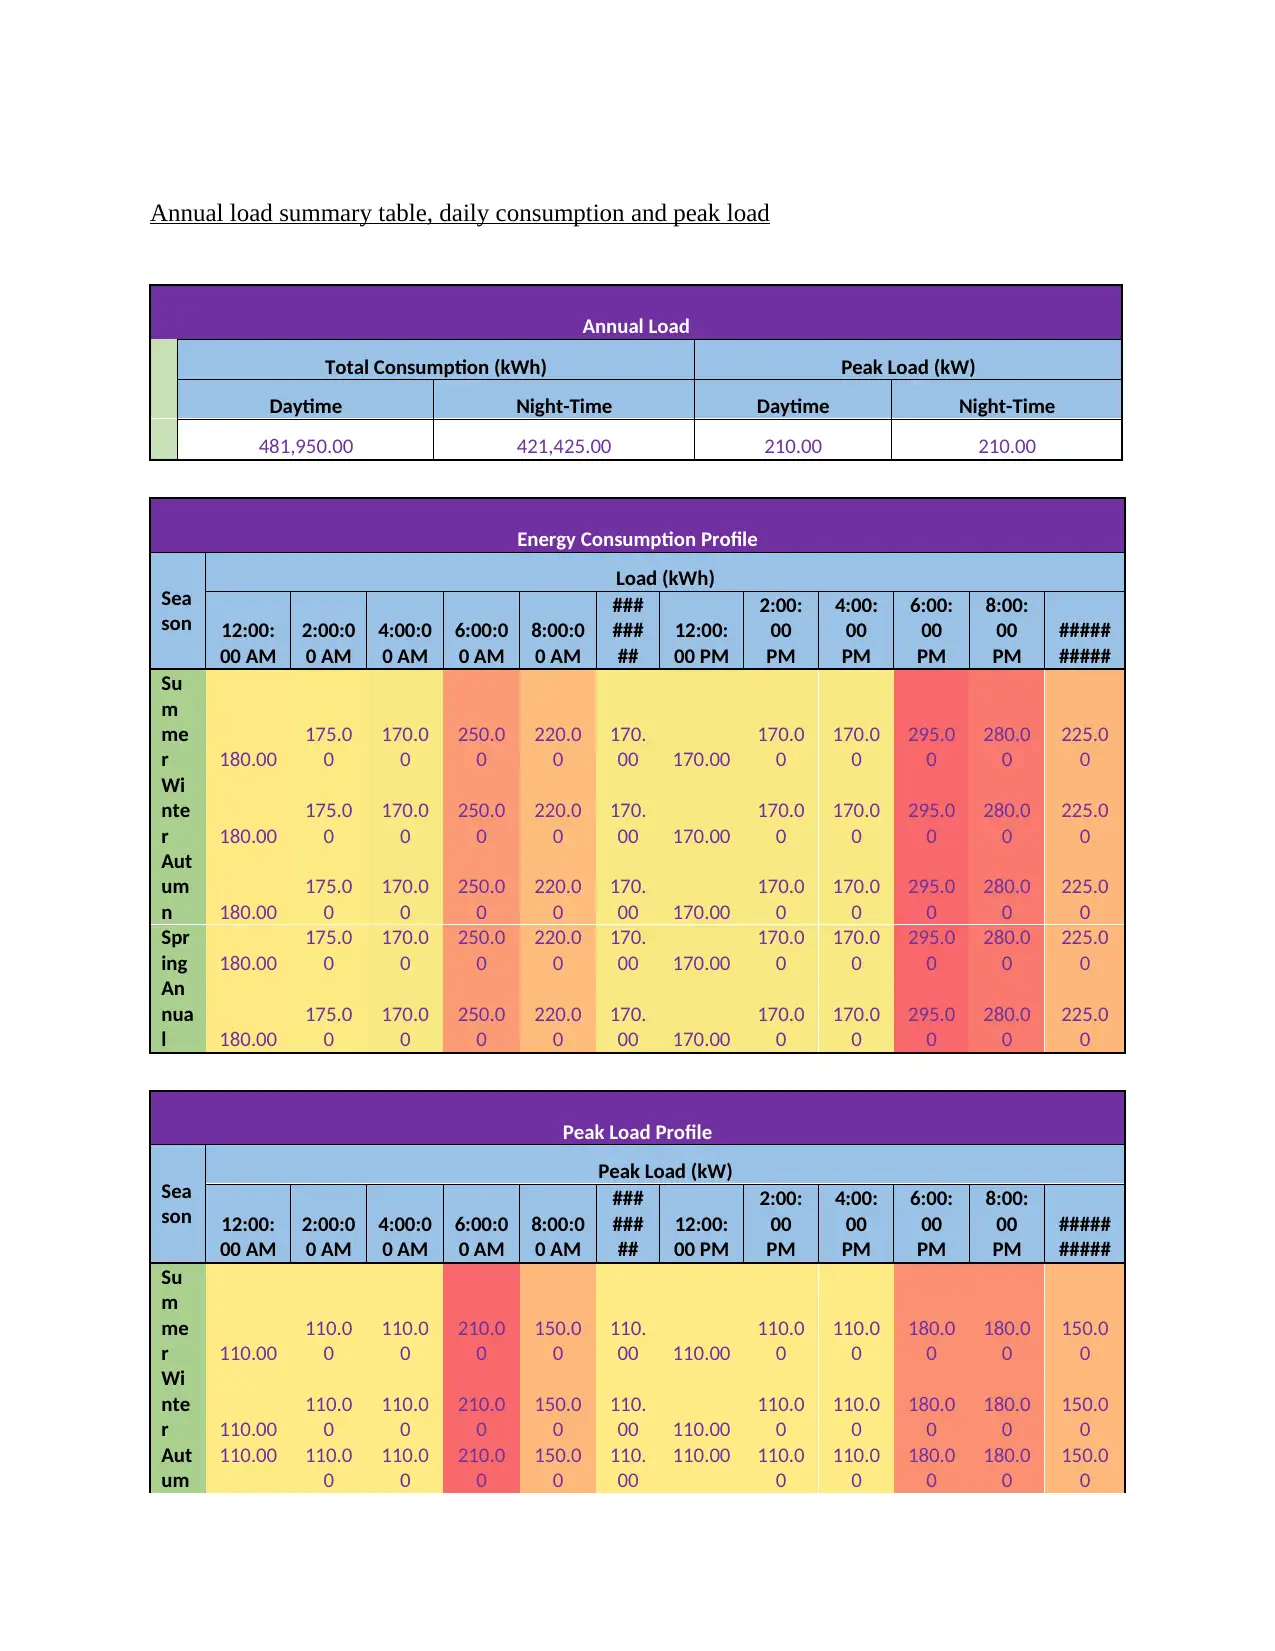
Annual load summary table, daily consumption and peak load
Annual Load
Total Consumption (kWh) Peak Load (kW)
Daytime Night-Time Daytime Night-Time
481,950.00 421,425.00 210.00 210.00
Energy Consumption Profile
Sea
son
Load (kWh)
12:00:
00 AM
2:00:0
0 AM
4:00:0
0 AM
6:00:0
0 AM
8:00:0
0 AM
###
###
##
12:00:
00 PM
2:00:
00
PM
4:00:
00
PM
6:00:
00
PM
8:00:
00
PM
#####
#####
Su
m
me
r 180.00
175.0
0
170.0
0
250.0
0
220.0
0
170.
00 170.00
170.0
0
170.0
0
295.0
0
280.0
0
225.0
0
Wi
nte
r 180.00
175.0
0
170.0
0
250.0
0
220.0
0
170.
00 170.00
170.0
0
170.0
0
295.0
0
280.0
0
225.0
0
Aut
um
n 180.00
175.0
0
170.0
0
250.0
0
220.0
0
170.
00 170.00
170.0
0
170.0
0
295.0
0
280.0
0
225.0
0
Spr
ing 180.00
175.0
0
170.0
0
250.0
0
220.0
0
170.
00 170.00
170.0
0
170.0
0
295.0
0
280.0
0
225.0
0
An
nua
l 180.00
175.0
0
170.0
0
250.0
0
220.0
0
170.
00 170.00
170.0
0
170.0
0
295.0
0
280.0
0
225.0
0
Peak Load Profile
Sea
son
Peak Load (kW)
12:00:
00 AM
2:00:0
0 AM
4:00:0
0 AM
6:00:0
0 AM
8:00:0
0 AM
###
###
##
12:00:
00 PM
2:00:
00
PM
4:00:
00
PM
6:00:
00
PM
8:00:
00
PM
#####
#####
Su
m
me
r 110.00
110.0
0
110.0
0
210.0
0
150.0
0
110.
00 110.00
110.0
0
110.0
0
180.0
0
180.0
0
150.0
0
Wi
nte
r 110.00
110.0
0
110.0
0
210.0
0
150.0
0
110.
00 110.00
110.0
0
110.0
0
180.0
0
180.0
0
150.0
0
Aut
um
110.00 110.0
0
110.0
0
210.0
0
150.0
0
110.
00
110.00 110.0
0
110.0
0
180.0
0
180.0
0
150.0
0
⊘ This is a preview!⊘
Do you want full access?
Subscribe today to unlock all pages.
Trusted by 1+ million students worldwide
n
Spr
ing 110.00
110.0
0
110.0
0
210.0
0
150.0
0
110.
00 110.00
110.0
0
110.0
0
180.0
0
180.0
0
150.0
0
An
nua
l 110.00
110.0
0
110.0
0
210.0
0
150.0
0
110.
00 110.00
110.0
0
110.0
0
180.0
0
180.0
0
150.0
0
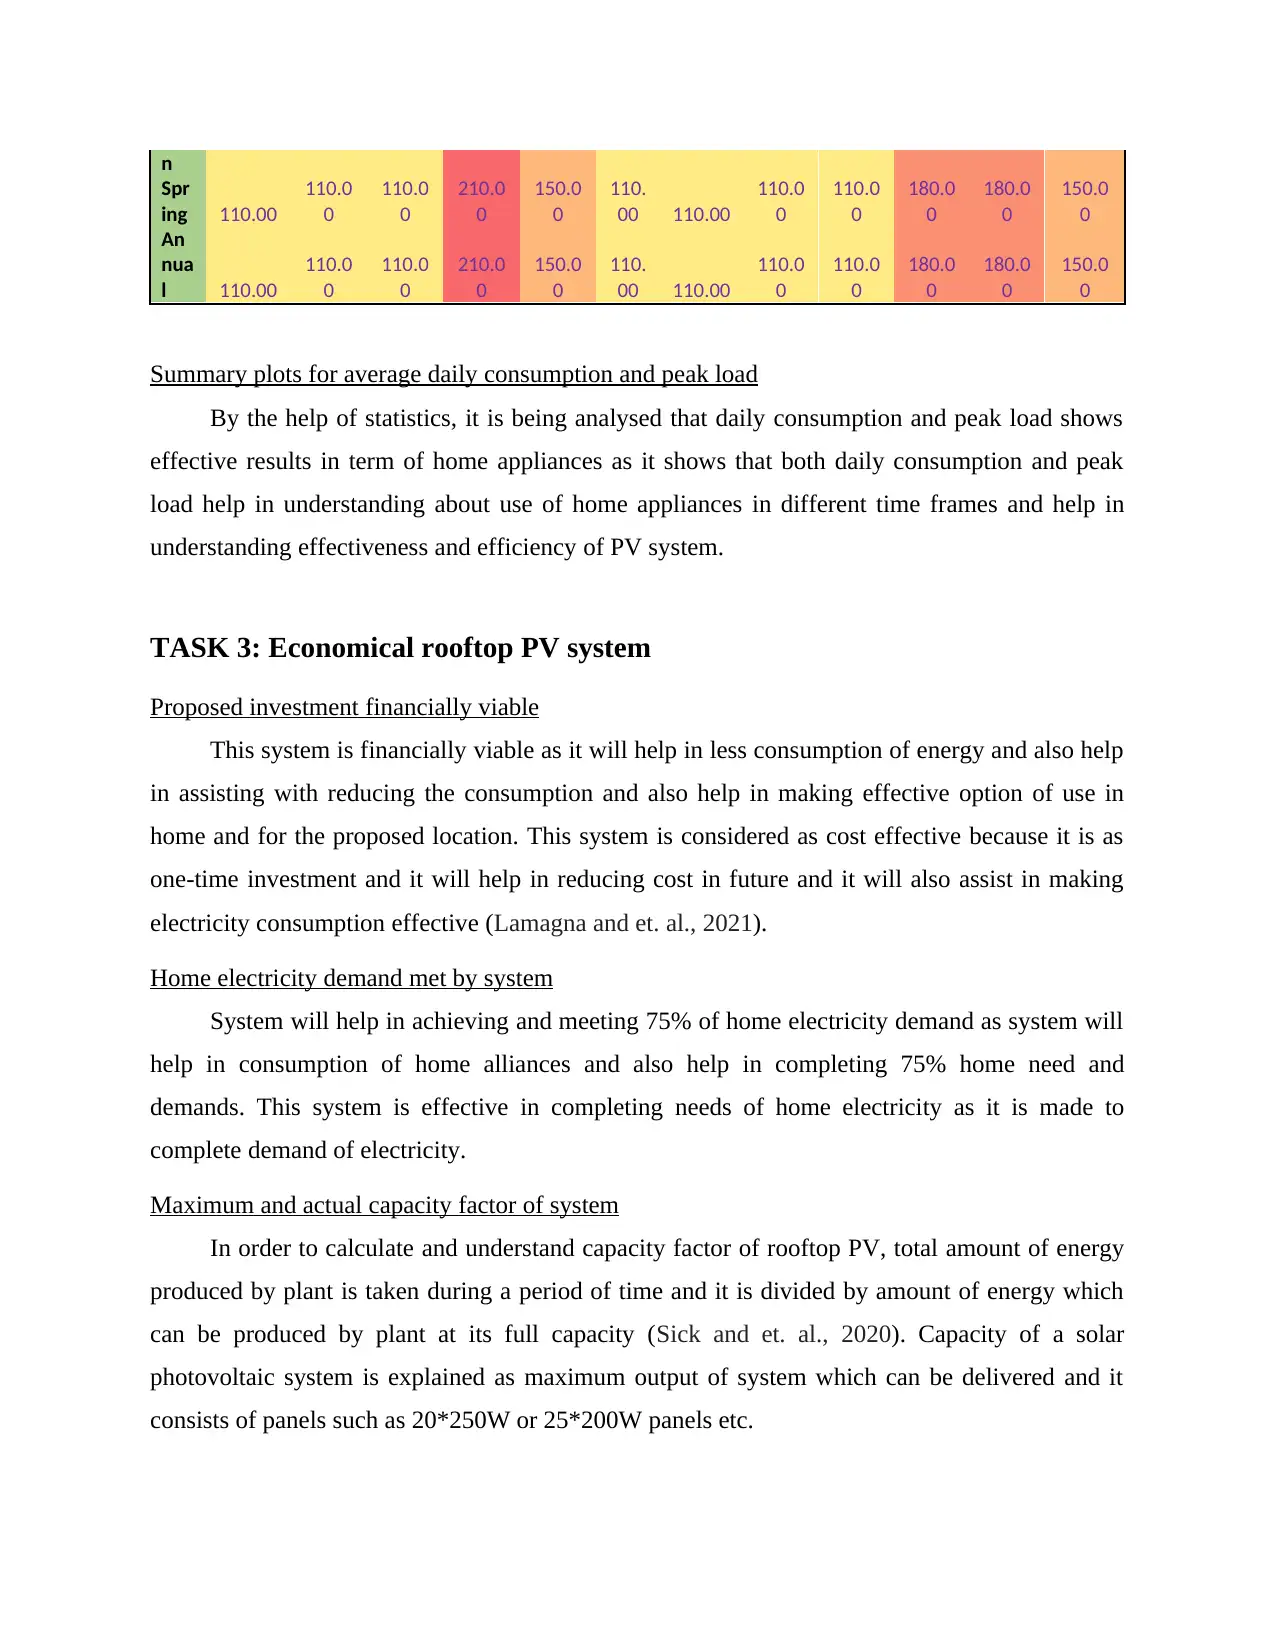
Summary plots for average daily consumption and peak load
By the help of statistics, it is being analysed that daily consumption and peak load shows
effective results in term of home appliances as it shows that both daily consumption and peak
load help in understanding about use of home appliances in different time frames and help in
understanding effectiveness and efficiency of PV system.
TASK 3: Economical rooftop PV system
Proposed investment financially viable
This system is financially viable as it will help in less consumption of energy and also help
in assisting with reducing the consumption and also help in making effective option of use in
home and for the proposed location. This system is considered as cost effective because it is as
one-time investment and it will help in reducing cost in future and it will also assist in making
electricity consumption effective (Lamagna and et. al., 2021).
Home electricity demand met by system
System will help in achieving and meeting 75% of home electricity demand as system will
help in consumption of home alliances and also help in completing 75% home need and
demands. This system is effective in completing needs of home electricity as it is made to
complete demand of electricity.
Maximum and actual capacity factor of system
In order to calculate and understand capacity factor of rooftop PV, total amount of energy
produced by plant is taken during a period of time and it is divided by amount of energy which
can be produced by plant at its full capacity (Sick and et. al., 2020). Capacity of a solar
photovoltaic system is explained as maximum output of system which can be delivered and it
consists of panels such as 20*250W or 25*200W panels etc.
Spr
ing 110.00
110.0
0
110.0
0
210.0
0
150.0
0
110.
00 110.00
110.0
0
110.0
0
180.0
0
180.0
0
150.0
0
An
nua
l 110.00
110.0
0
110.0
0
210.0
0
150.0
0
110.
00 110.00
110.0
0
110.0
0
180.0
0
180.0
0
150.0
0
Summary plots for average daily consumption and peak load
By the help of statistics, it is being analysed that daily consumption and peak load shows
effective results in term of home appliances as it shows that both daily consumption and peak
load help in understanding about use of home appliances in different time frames and help in
understanding effectiveness and efficiency of PV system.
TASK 3: Economical rooftop PV system
Proposed investment financially viable
This system is financially viable as it will help in less consumption of energy and also help
in assisting with reducing the consumption and also help in making effective option of use in
home and for the proposed location. This system is considered as cost effective because it is as
one-time investment and it will help in reducing cost in future and it will also assist in making
electricity consumption effective (Lamagna and et. al., 2021).
Home electricity demand met by system
System will help in achieving and meeting 75% of home electricity demand as system will
help in consumption of home alliances and also help in completing 75% home need and
demands. This system is effective in completing needs of home electricity as it is made to
complete demand of electricity.
Maximum and actual capacity factor of system
In order to calculate and understand capacity factor of rooftop PV, total amount of energy
produced by plant is taken during a period of time and it is divided by amount of energy which
can be produced by plant at its full capacity (Sick and et. al., 2020). Capacity of a solar
photovoltaic system is explained as maximum output of system which can be delivered and it
consists of panels such as 20*250W or 25*200W panels etc.
Paraphrase This Document
Need a fresh take? Get an instant paraphrase of this document with our AI Paraphraser
CO2 saved annually
Carbon intensity in south of UK is considered low as it is recorded of 147gCO2/kwh and
carbon intensity of electricity is measured in kilowatt hour of energy consumed. This way carbon
emission from PV system can be analysed.
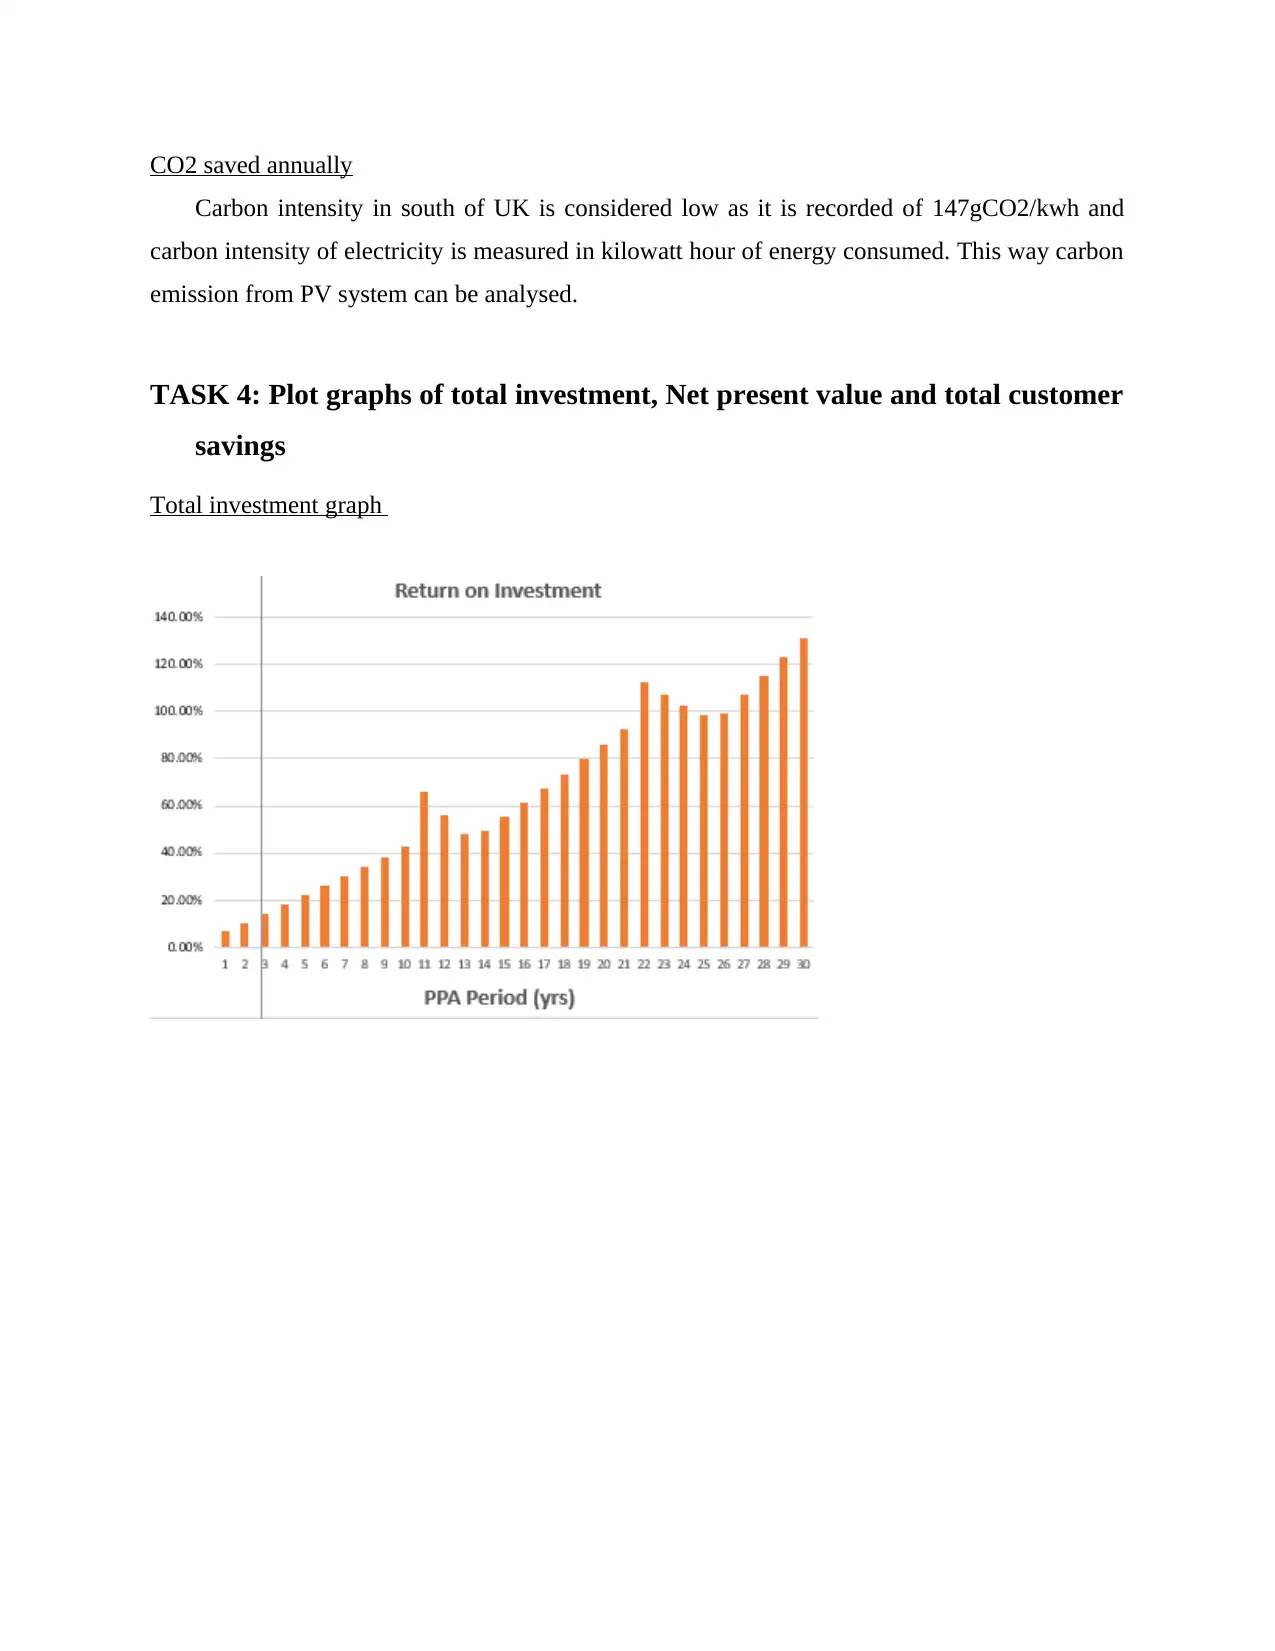
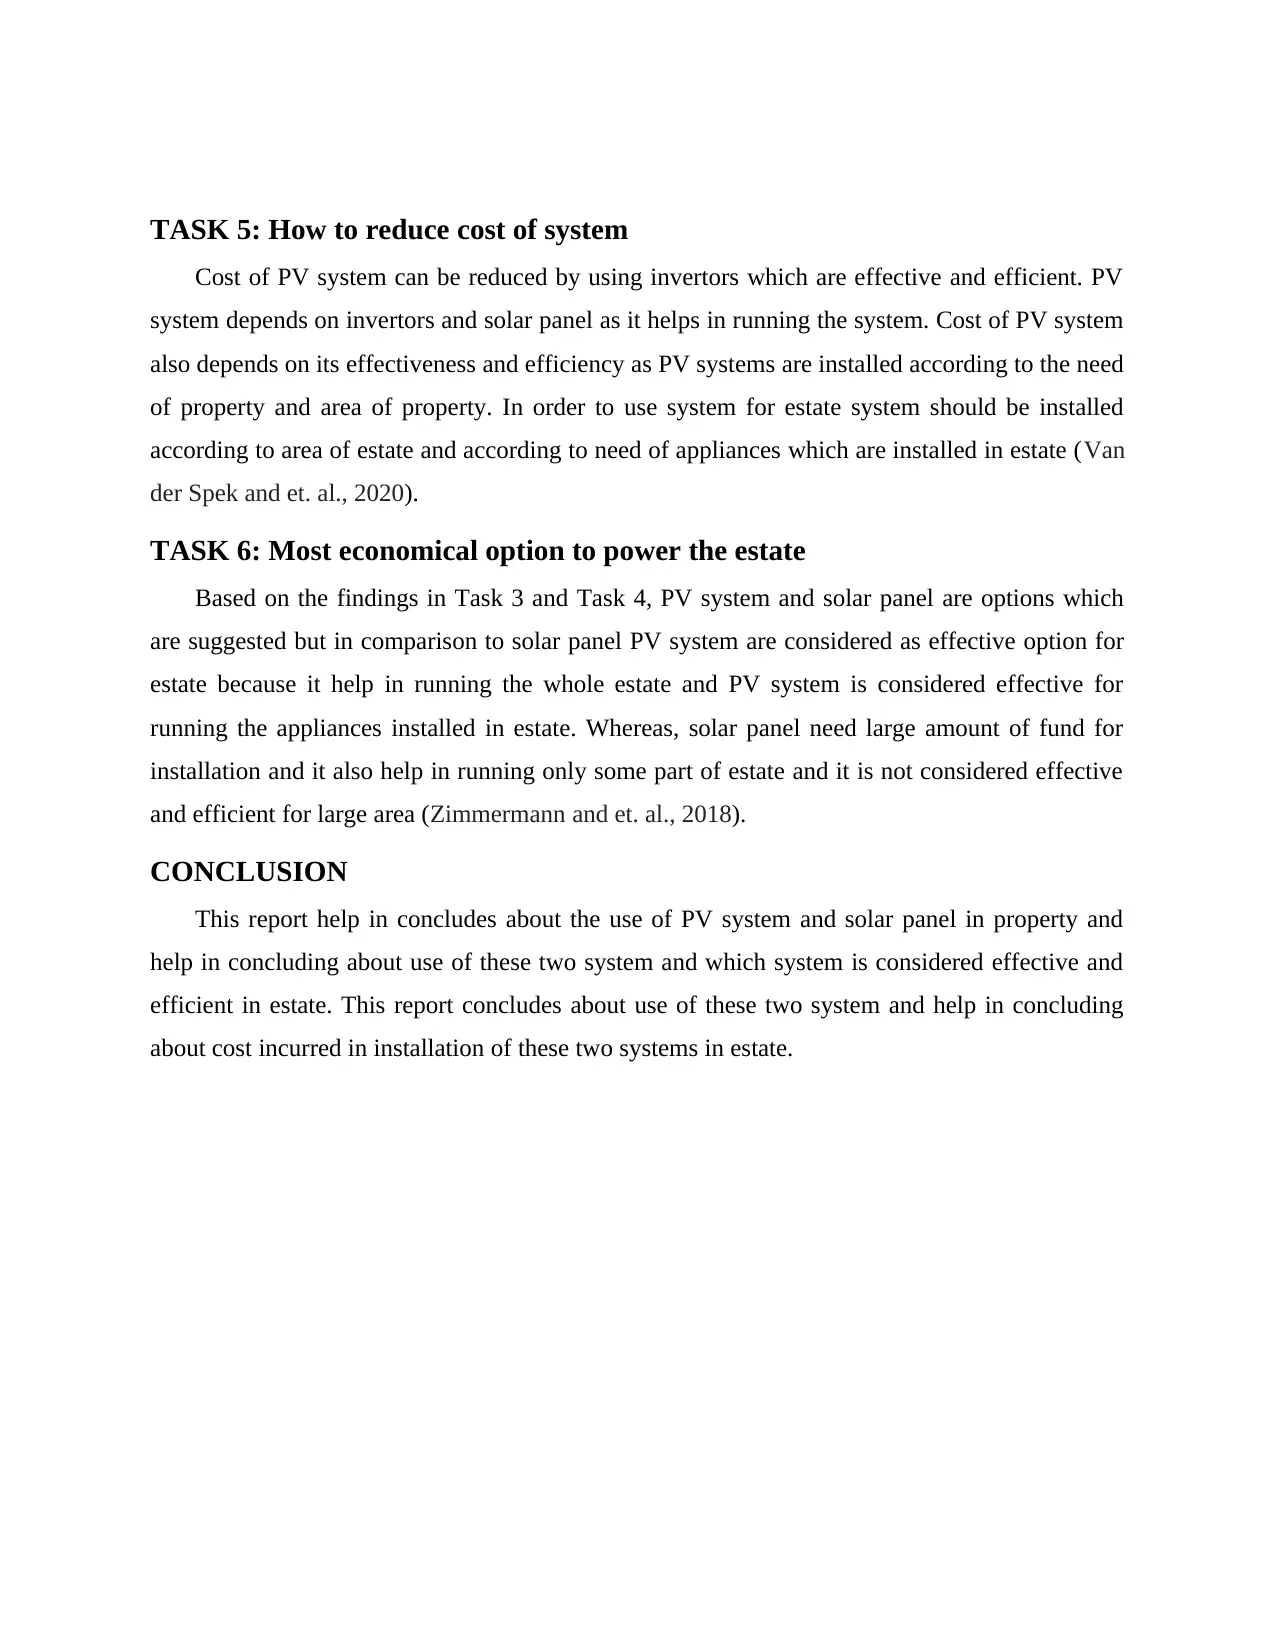
TASK 4: Plot graphs of total investment, Net present value and total customer
savings
Total investment graph
Carbon intensity in south of UK is considered low as it is recorded of 147gCO2/kwh and
carbon intensity of electricity is measured in kilowatt hour of energy consumed. This way carbon
emission from PV system can be analysed.
TASK 4: Plot graphs of total investment, Net present value and total customer
savings
Total investment graph
Net Present Value
Total customer savings
Total customer savings
⊘ This is a preview!⊘
Do you want full access?
Subscribe today to unlock all pages.
Trusted by 1+ million students worldwide
TASK 5: How to reduce cost of system
Cost of PV system can be reduced by using invertors which are effective and efficient. PV
system depends on invertors and solar panel as it helps in running the system. Cost of PV system
also depends on its effectiveness and efficiency as PV systems are installed according to the need
of property and area of property. In order to use system for estate system should be installed
according to area of estate and according to need of appliances which are installed in estate (Van
der Spek and et. al., 2020).
TASK 6: Most economical option to power the estate
Based on the findings in Task 3 and Task 4, PV system and solar panel are options which
are suggested but in comparison to solar panel PV system are considered as effective option for
estate because it help in running the whole estate and PV system is considered effective for
running the appliances installed in estate. Whereas, solar panel need large amount of fund for
installation and it also help in running only some part of estate and it is not considered effective
and efficient for large area (Zimmermann and et. al., 2018).
CONCLUSION
This report help in concludes about the use of PV system and solar panel in property and
help in concluding about use of these two system and which system is considered effective and
efficient in estate. This report concludes about use of these two system and help in concluding
about cost incurred in installation of these two systems in estate.
Paraphrase This Document
Need a fresh take? Get an instant paraphrase of this document with our AI Paraphraser
REFERENCES
Books and Journal
Awan, A. B., 2019. Optimization and techno-economic assessment of rooftop photovoltaic
system. Journal of Renewable and Sustainable Energy. 11(3). p.033501.
de la Calle, A., Bayon, A. and Pye, J., 2020. Techno-economic assessment of a high-efficiency,
low-cost solar-thermal power system with sodium receiver, phase-change material
storage, and supercritical CO2 recompression Brayton cycle. Solar Energy. 199. pp.885-
900.
Kobashi, T., and et. al., 2020. Techno-economic assessment of photovoltaics plus electric
vehicles towards household-sector decarbonization in Kyoto and Shenzhen by the year
2030. Journal of Cleaner Production. 253. p.119933.
Lamagna, M., and et. al., 2021. Techno-economic assessment of reversible Solid Oxide Cell
integration to renewable energy systems at building and district scale. Energy Conversion
and Management. 235. p.113993.
Sick, V., and et. al., 2020. The need for and path to harmonized life cycle assessment and techno‐
economic assessment for carbon dioxide capture and utilization. Energy
technology. 8(11). p.1901034.
Van der Spek, M., and et. al., 2020. Uncertainty analysis in the techno-economic assessment of
CO2 capture and storage technologies. Critical review and guidelines for
use. International Journal of Greenhouse Gas Control. 100. p.103113.
Zimmermann, A., and et. al., 2018. Techno-economic assessment & life-cycle assessment
guidelines for CO2 utilization.

⊘ This is a preview!⊘
Do you want full access?
Subscribe today to unlock all pages.
Trusted by 1+ million students worldwide
1 out of 14
Related Documents


Your All-in-One AI-Powered Toolkit for Academic Success.
+13062052269
info@desklib.com
Available 24*7 on WhatsApp / Email
![[object Object]](/_next/static/media/star-bottom.7253800d.svg)
Unlock your academic potential
Copyright © 2020–2026 A2Z Services. All Rights Reserved. Developed and managed by ZUCOL.