FC301 Statistics: Unemployment Rate Analysis Report (1971-2019)
VerifiedAdded on 2022/08/08
|9
|1692
|27
Report
AI Summary
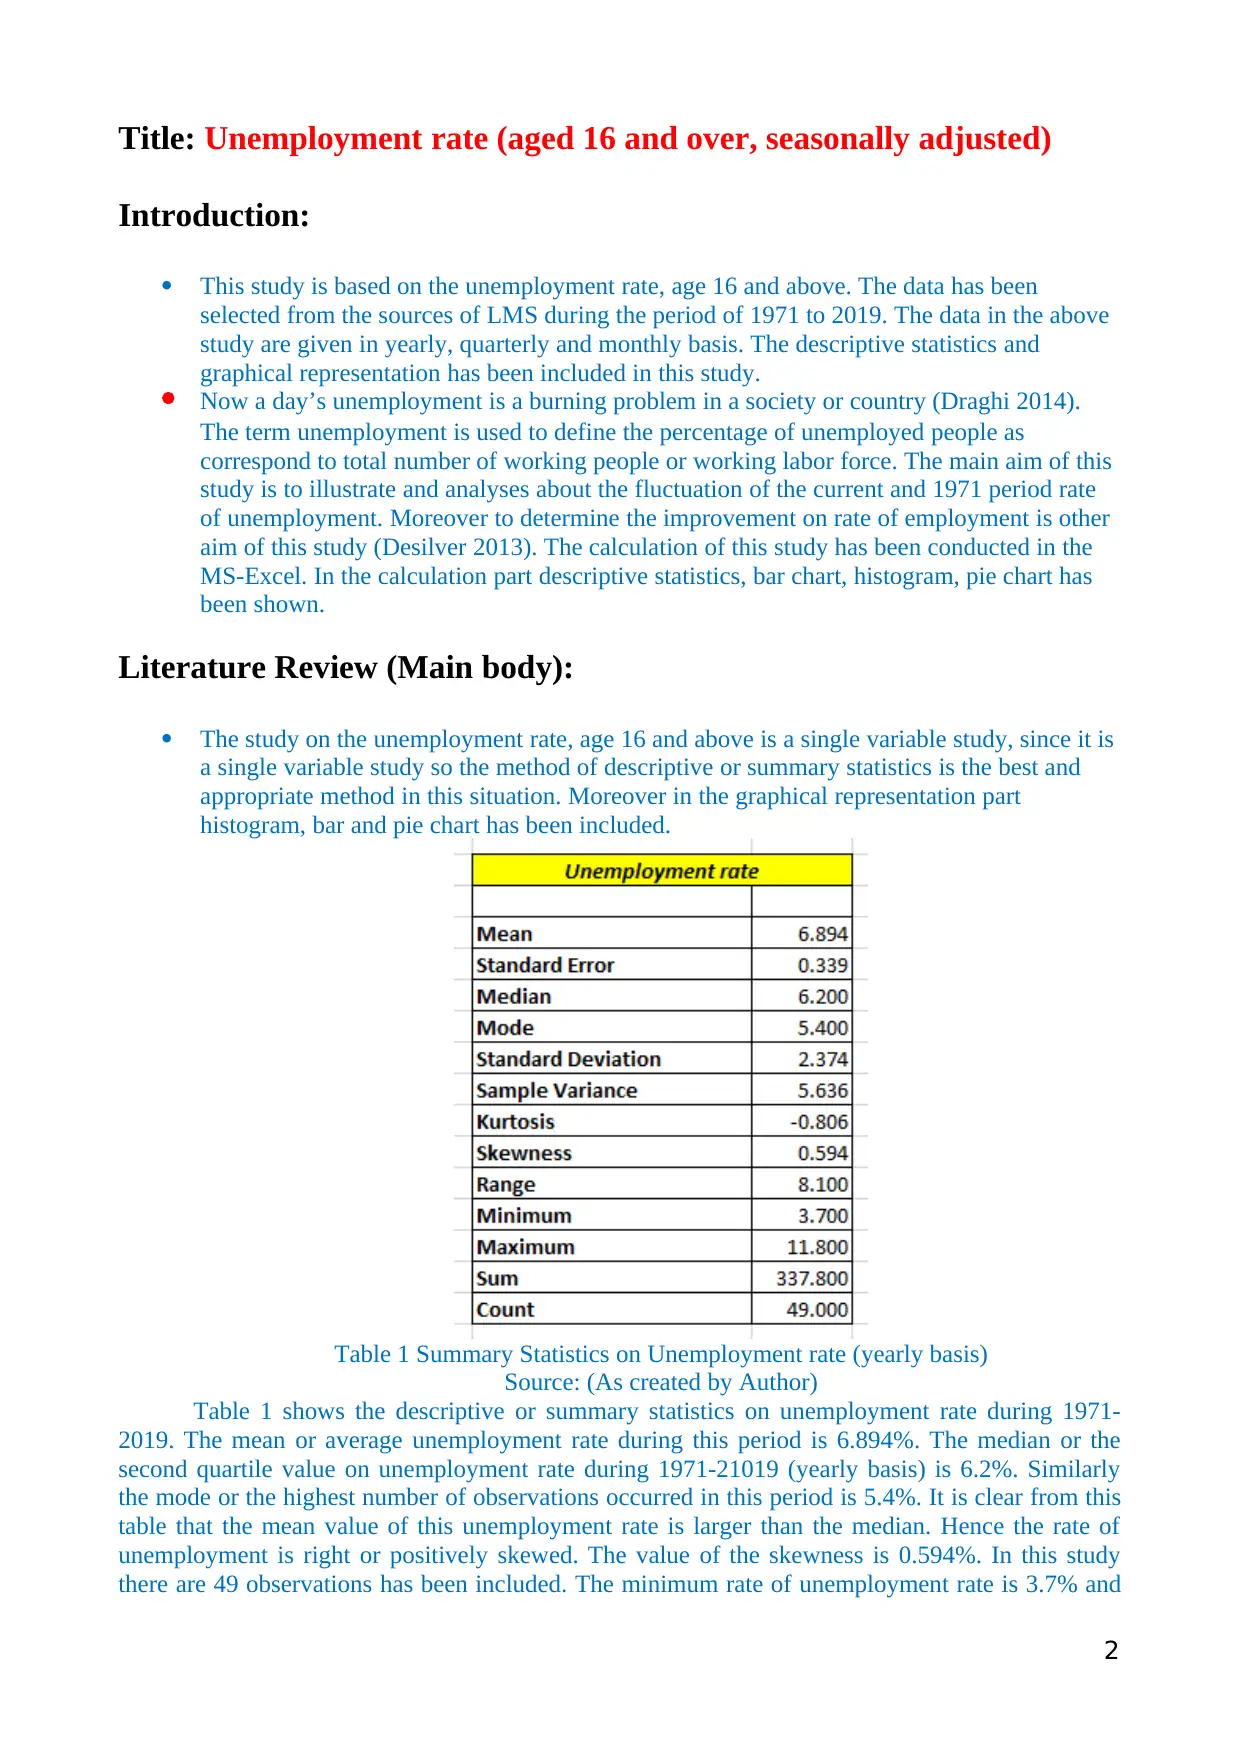
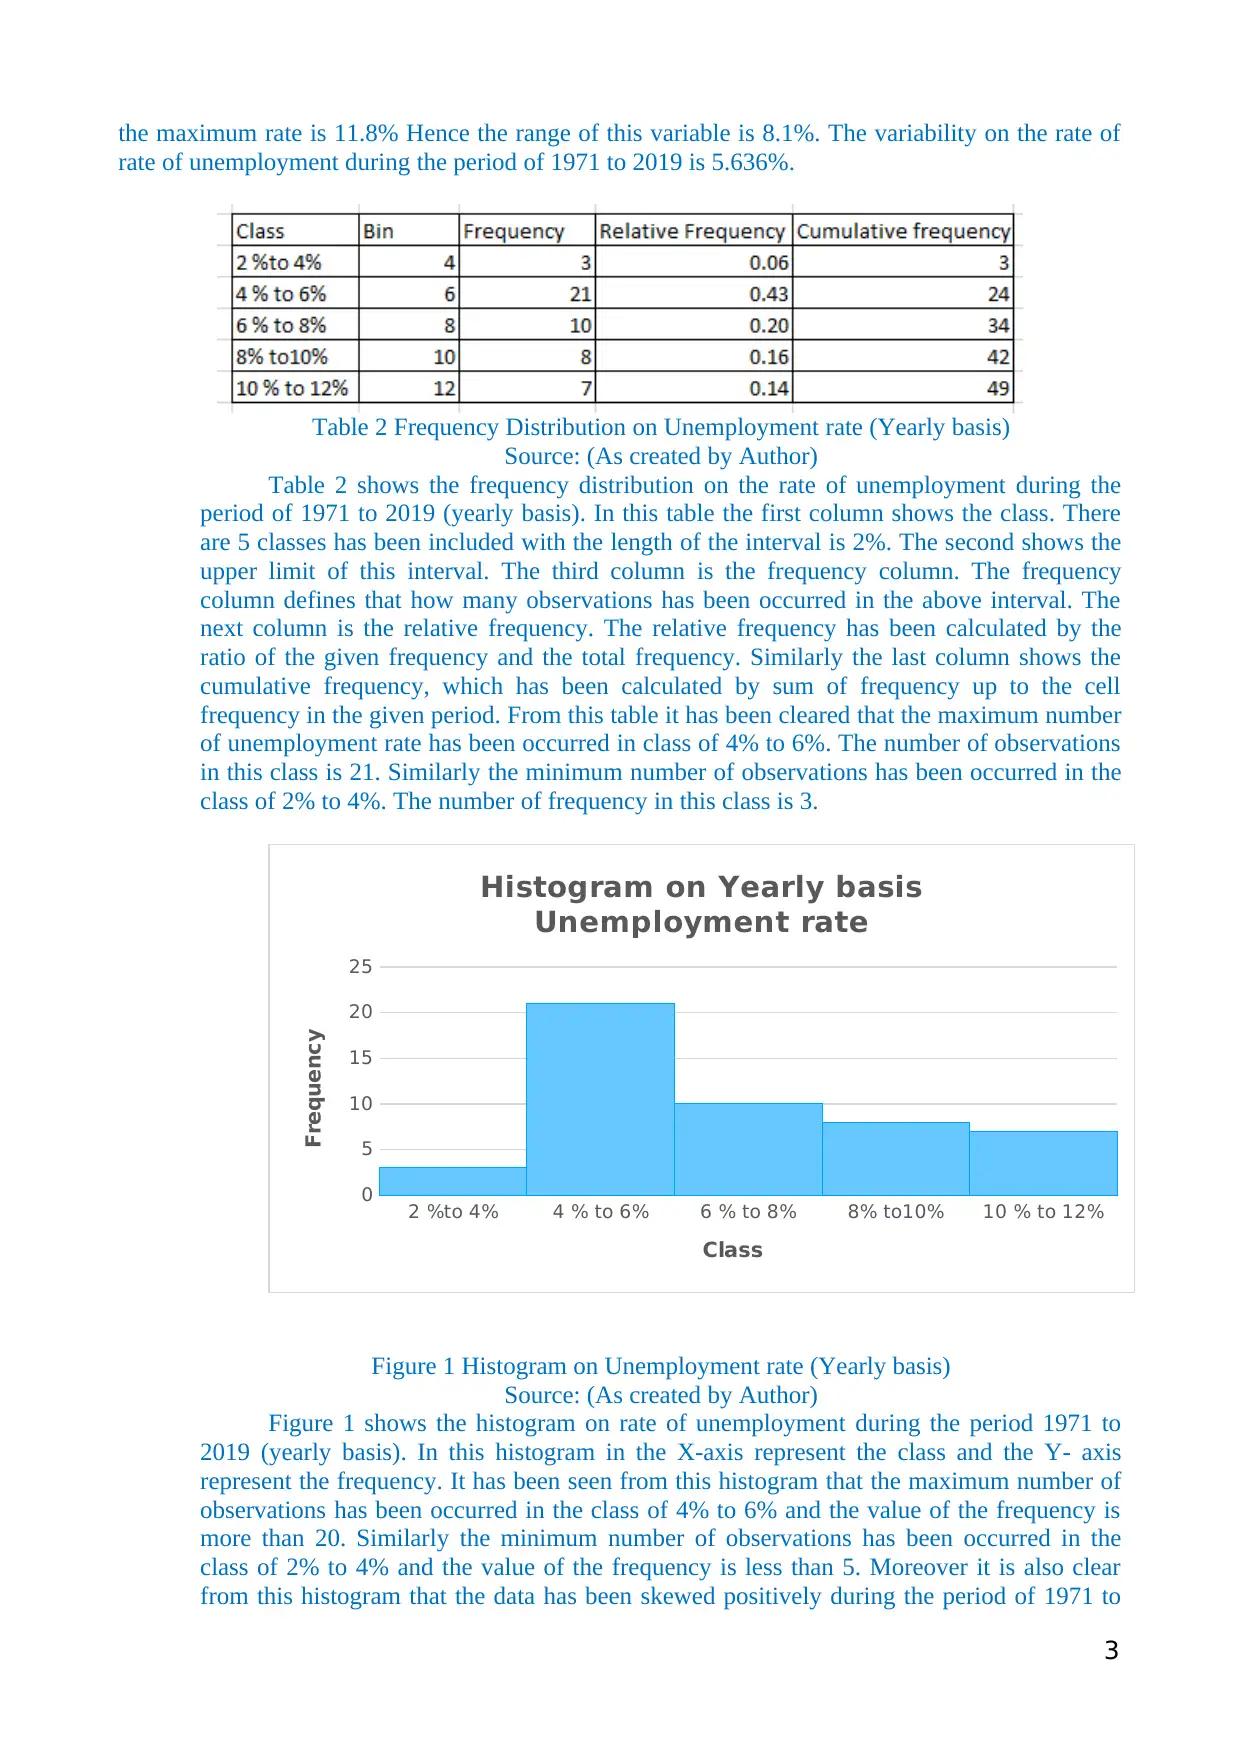
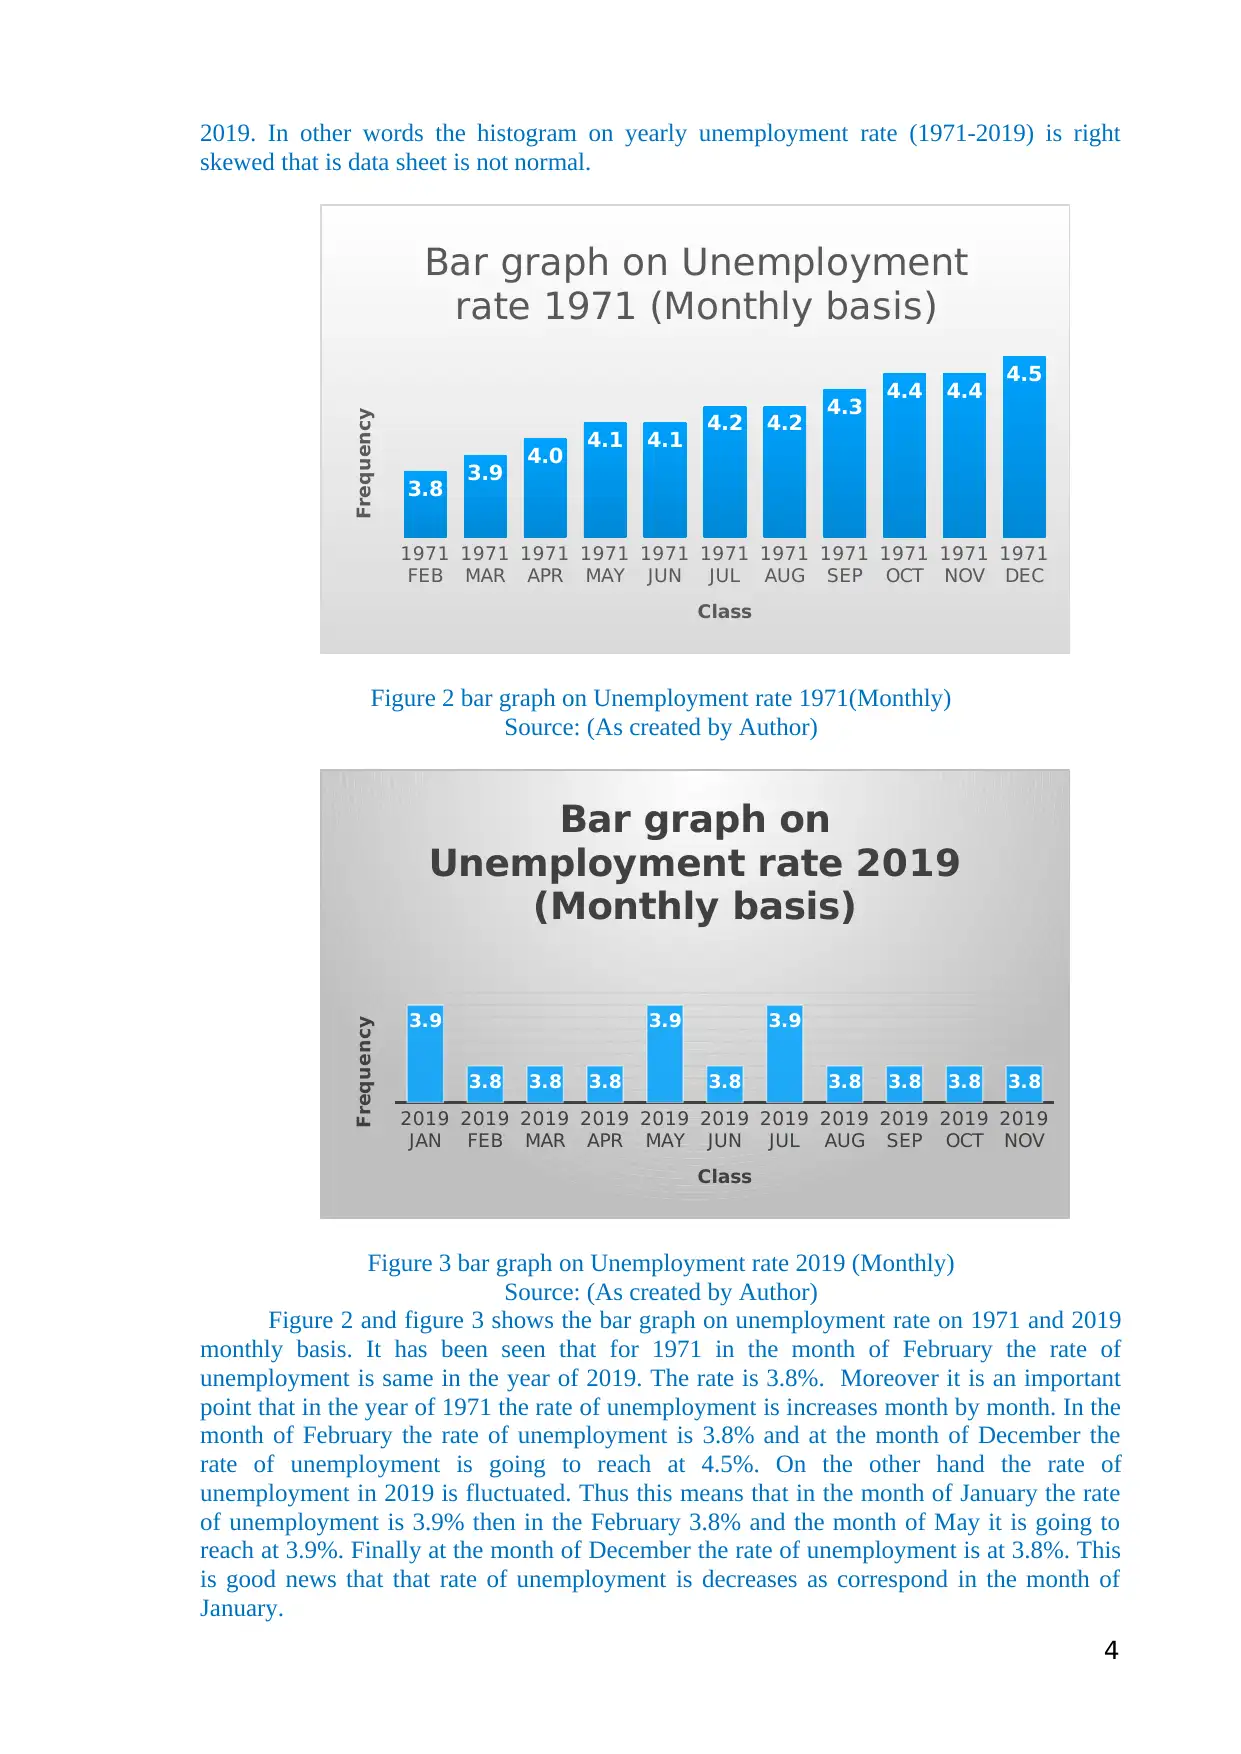
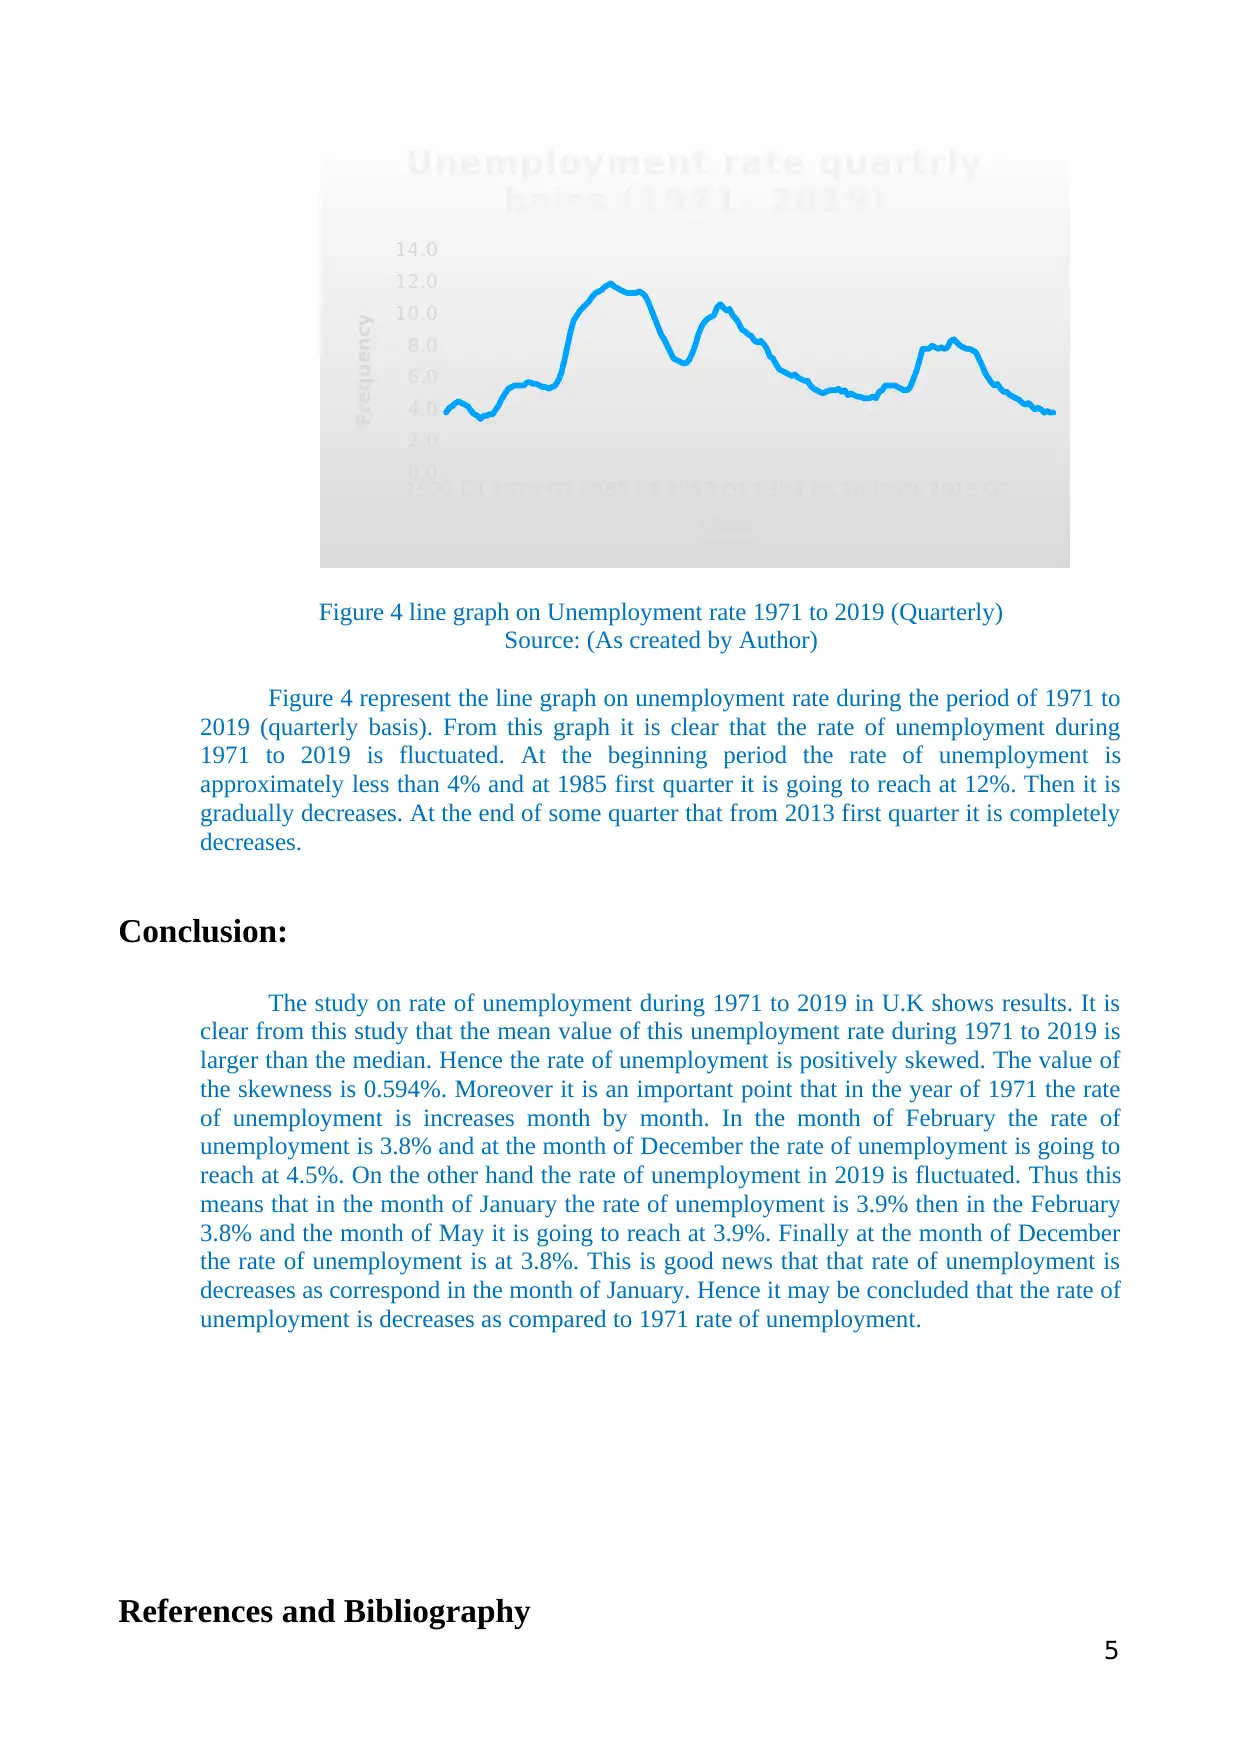
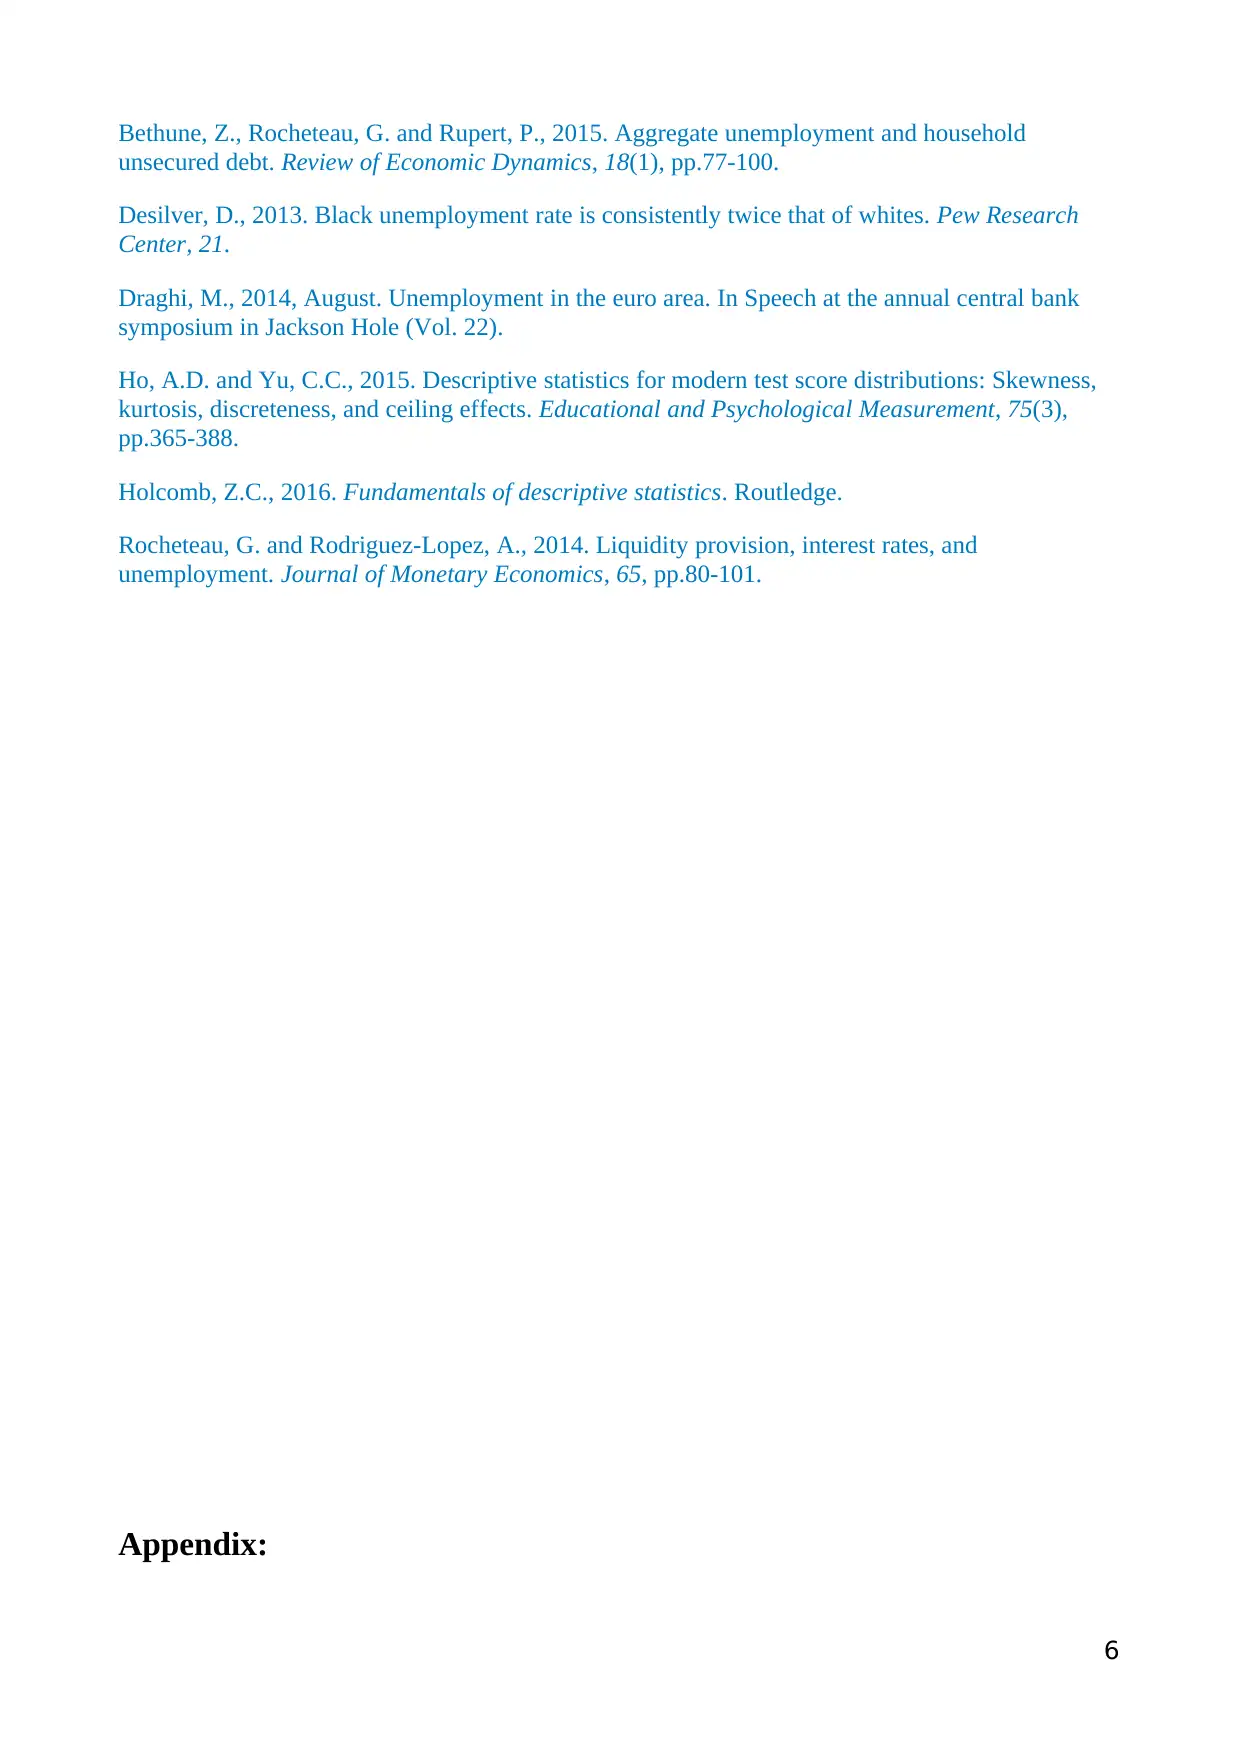
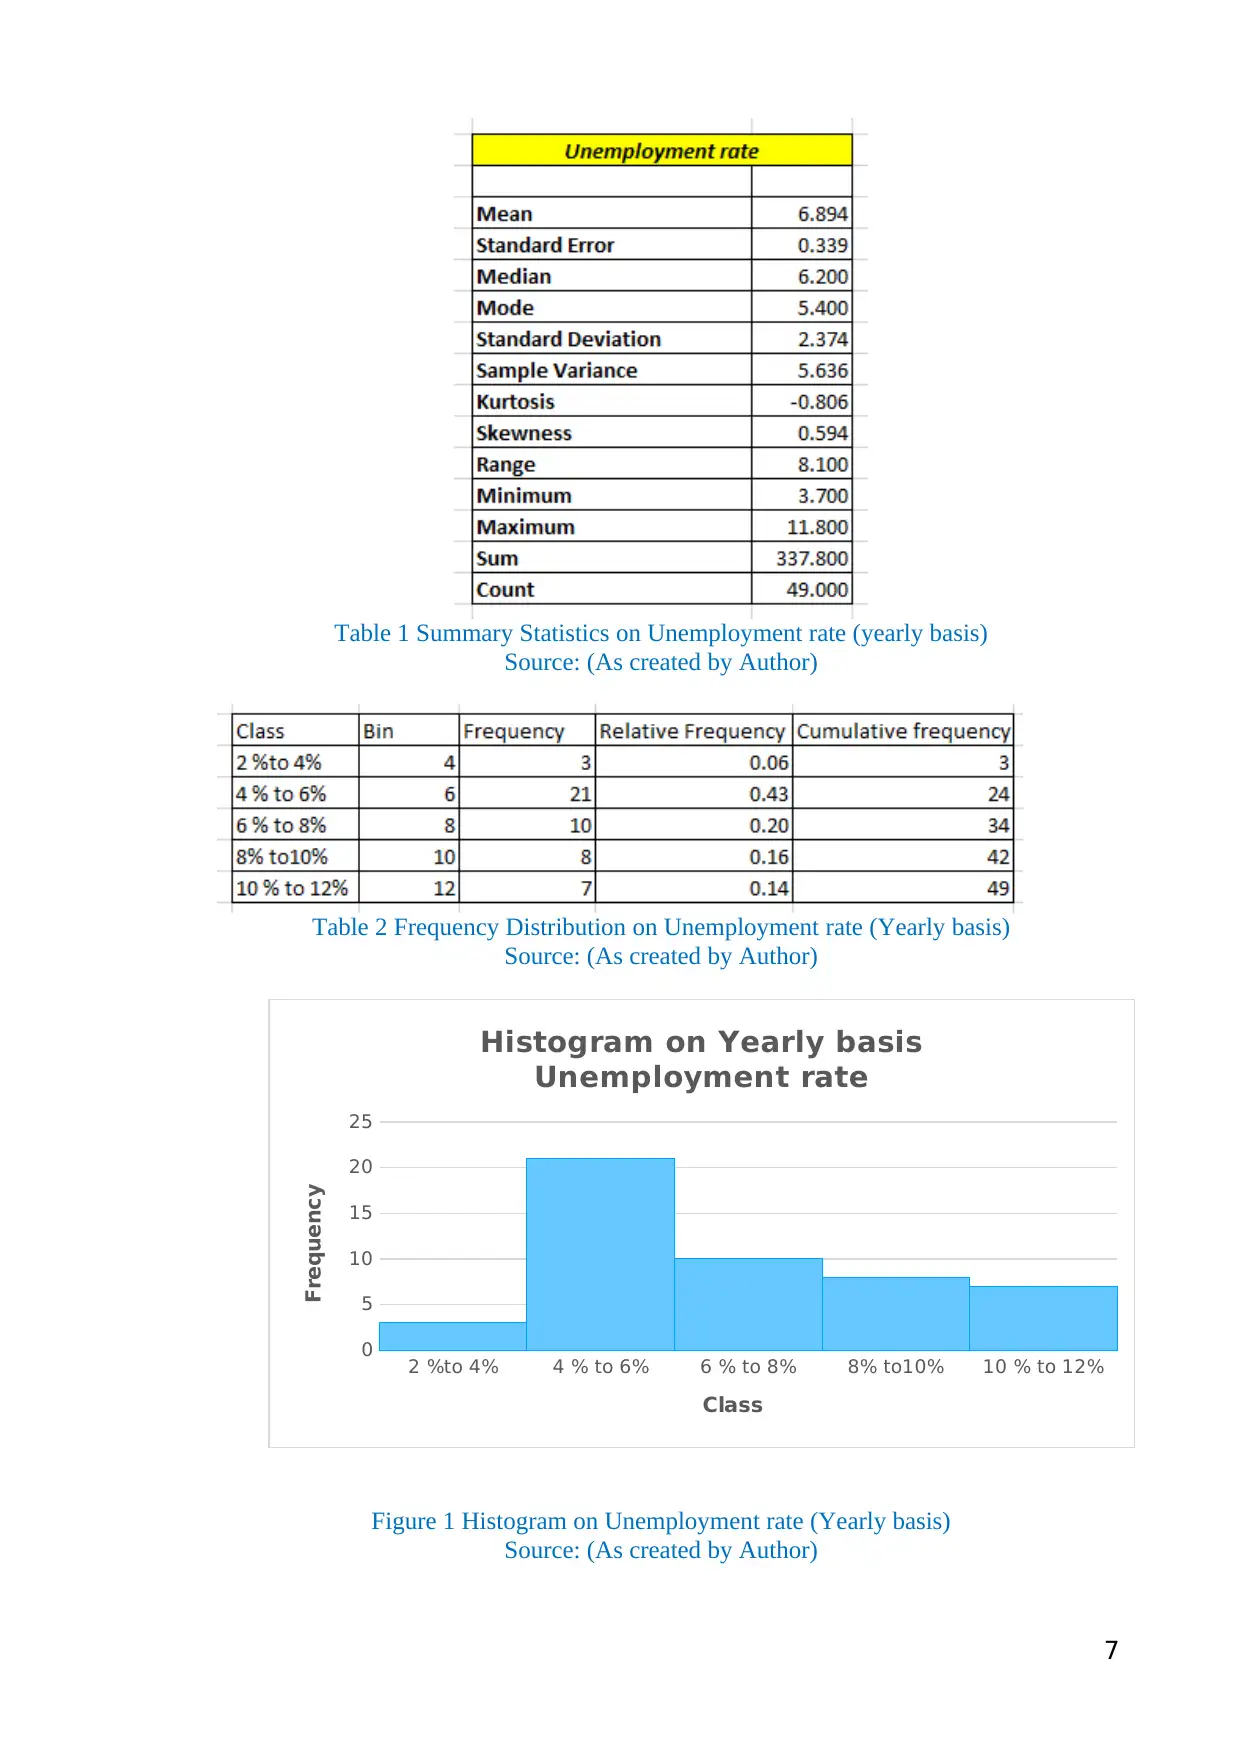
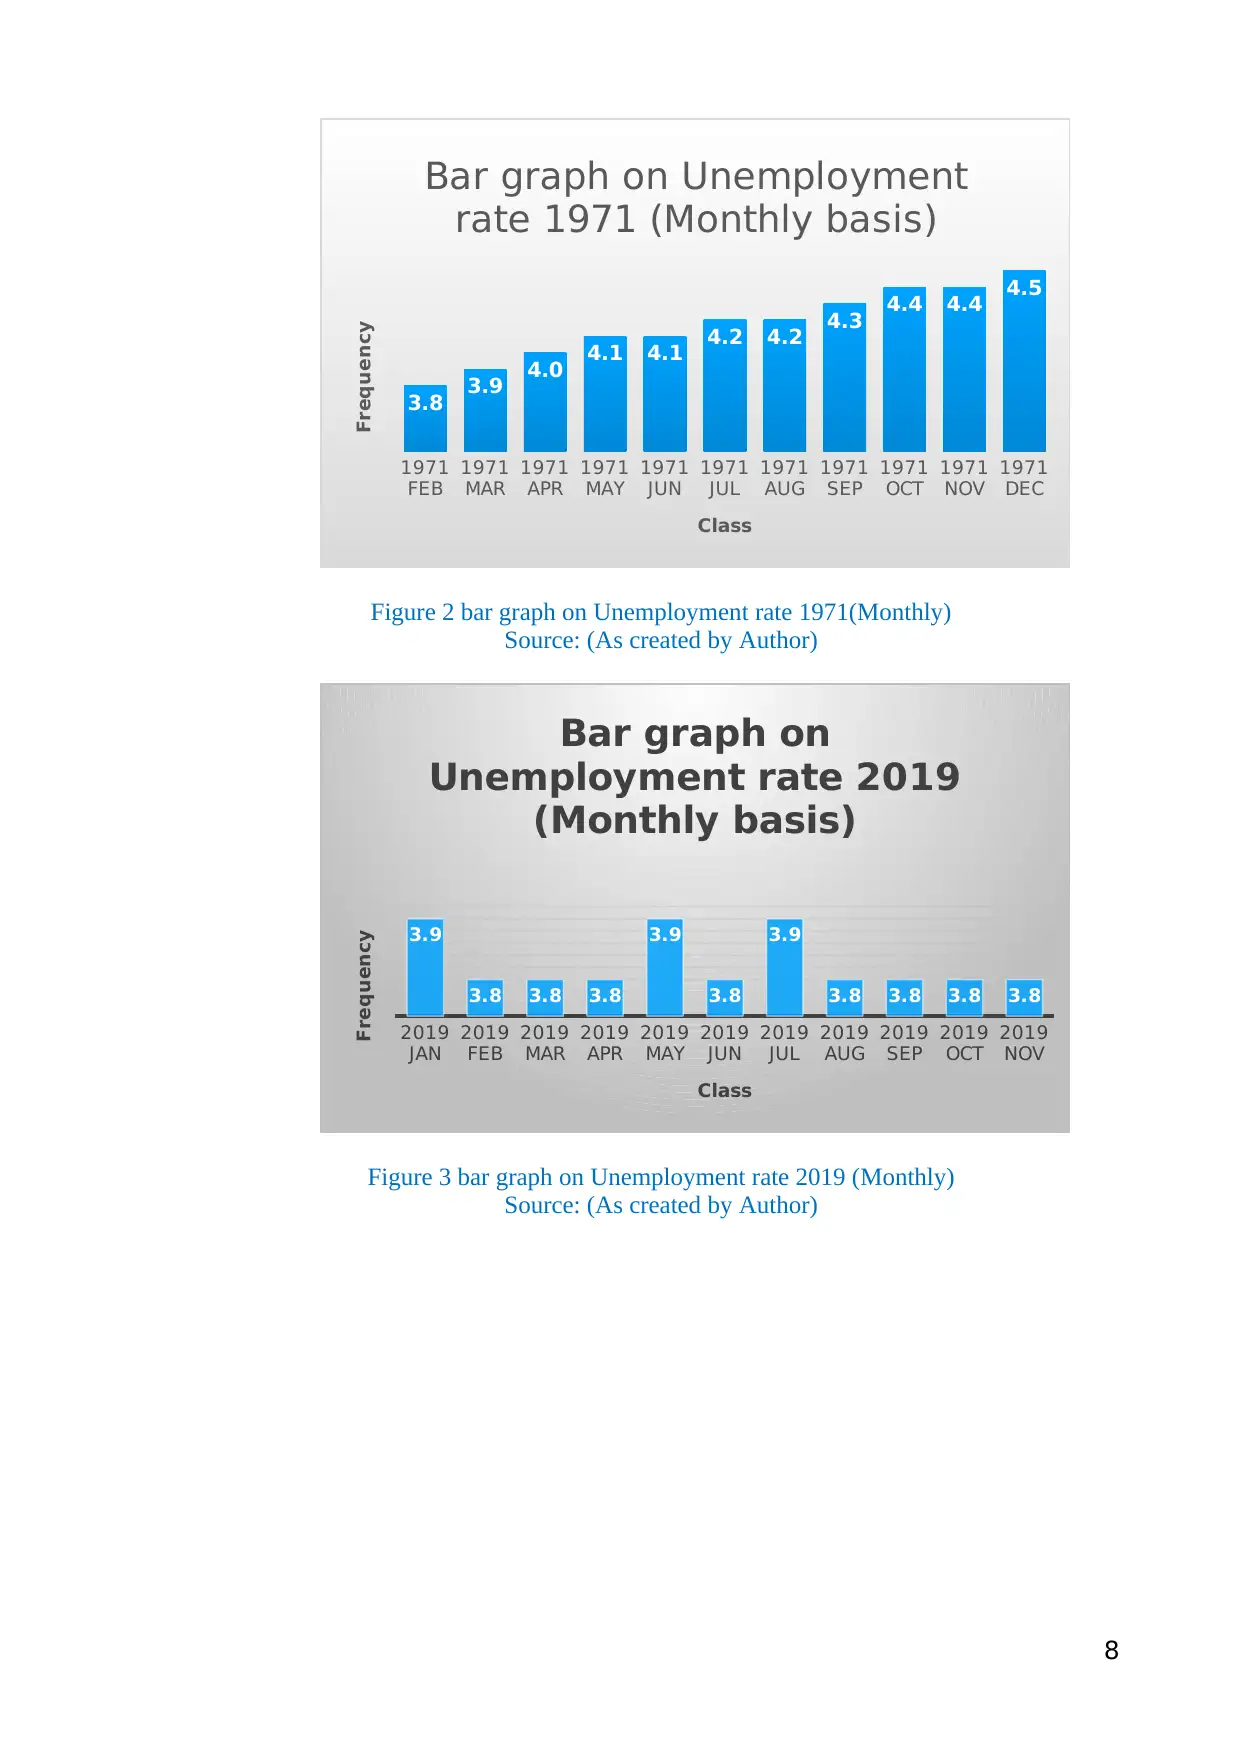
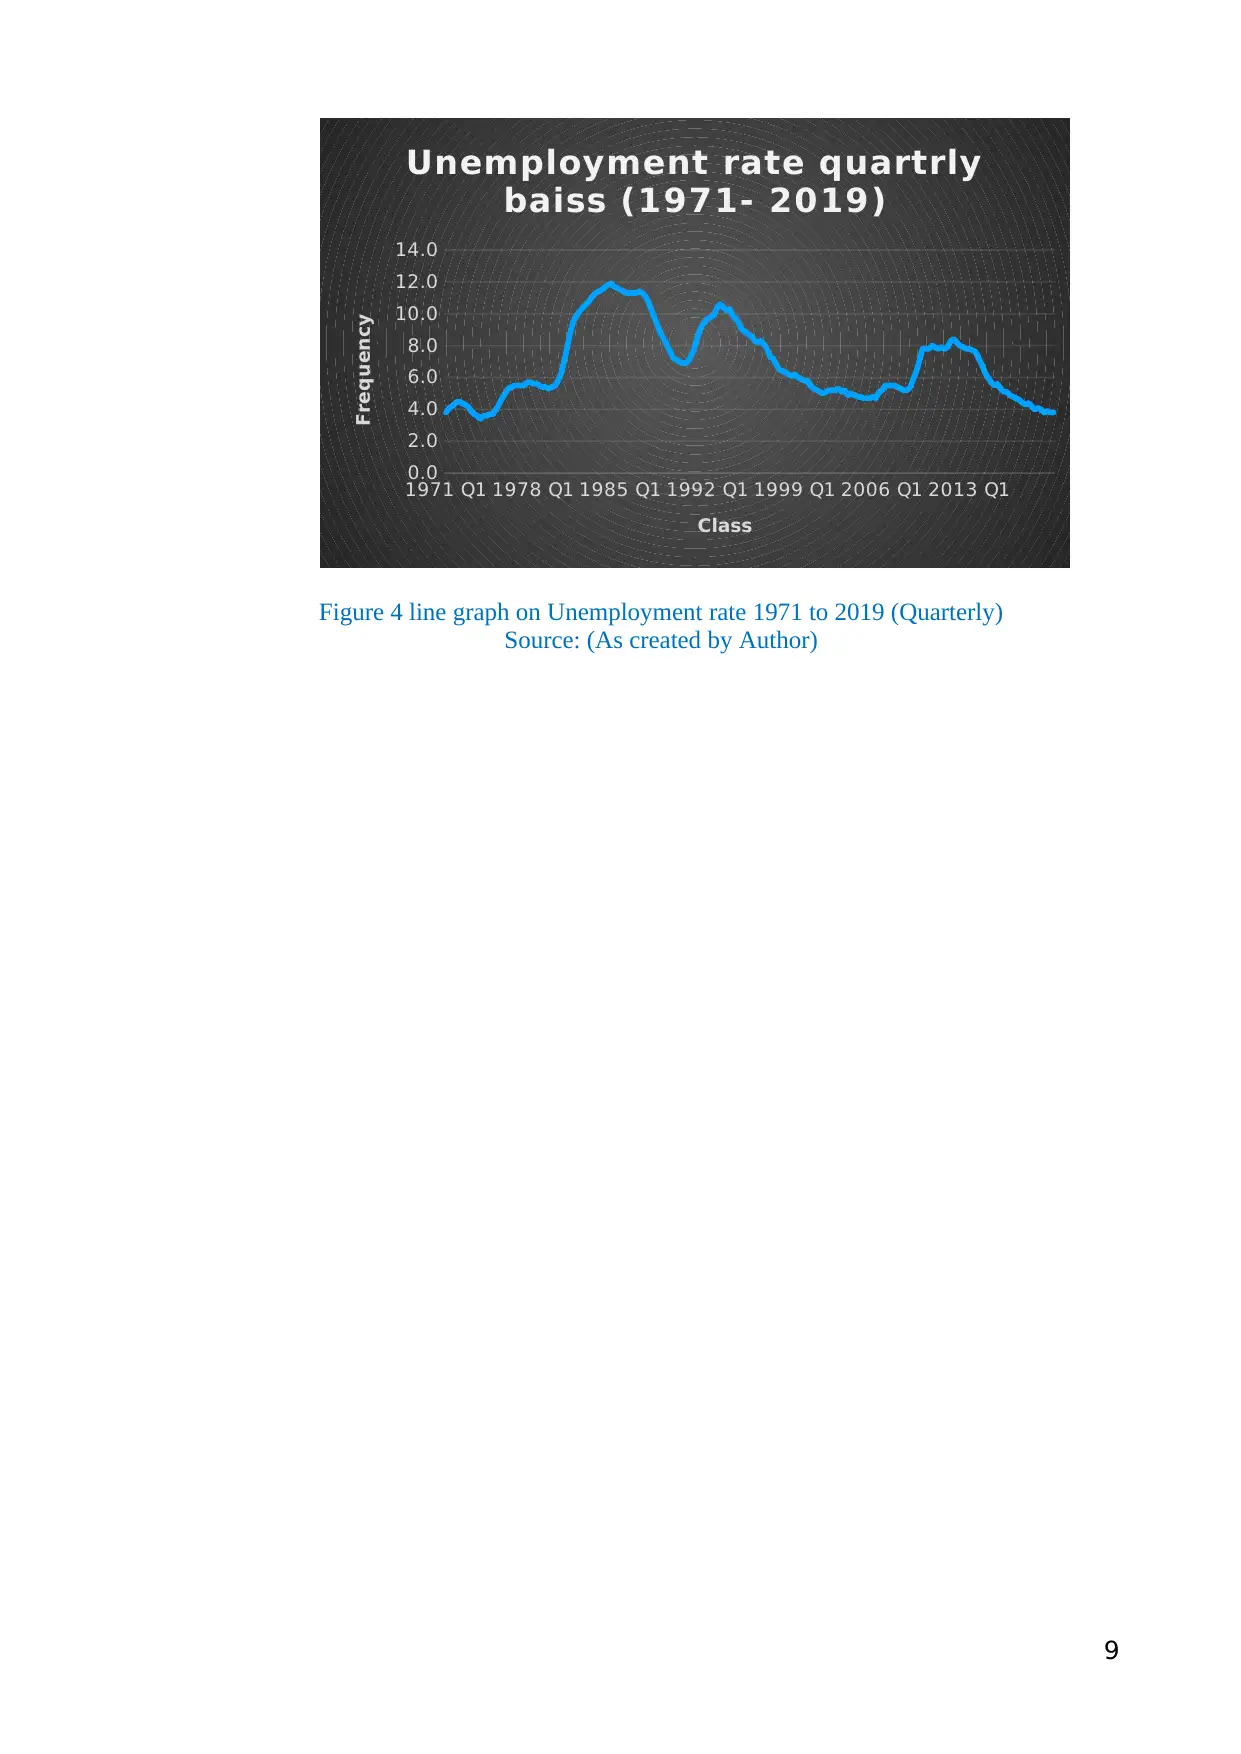
This statistics investigation report analyzes the UK unemployment rate from 1971 to 2019. The study utilizes data from the LMS, presenting yearly, quarterly, and monthly data. The report employs descriptive statistics, including mean, median, mode, skewness, and frequency distributions, to analyze unemployment trends. Graphical representations such as histograms, bar graphs, and line graphs are used to visualize the data and identify fluctuations. The analysis reveals a positive skewness in the unemployment rate, with the mean exceeding the median. The report also compares monthly unemployment rates in 1971 and 2019, highlighting the fluctuating nature of the rate in 2019 compared to the increasing trend in 1971. The quarterly analysis from 1971 to 2019 shows fluctuations in the rate of unemployment, with a peak in 1985 and a decreasing trend from 2013 onward. The report concludes that the rate of unemployment is decreasing as compared to 1971.
1 out of 9
Related Documents


Your All-in-One AI-Powered Toolkit for Academic Success.
+13062052269
info@desklib.com
Available 24*7 on WhatsApp / Email
![[object Object]](/_next/static/media/star-bottom.7253800d.svg)
Copyright © 2020–2026 A2Z Services. All Rights Reserved. Developed and managed by ZUCOL.