Statistical Analysis: Hypothesis Testing and One-Sample T-Test in SPSS
VerifiedAdded on 2023/06/12
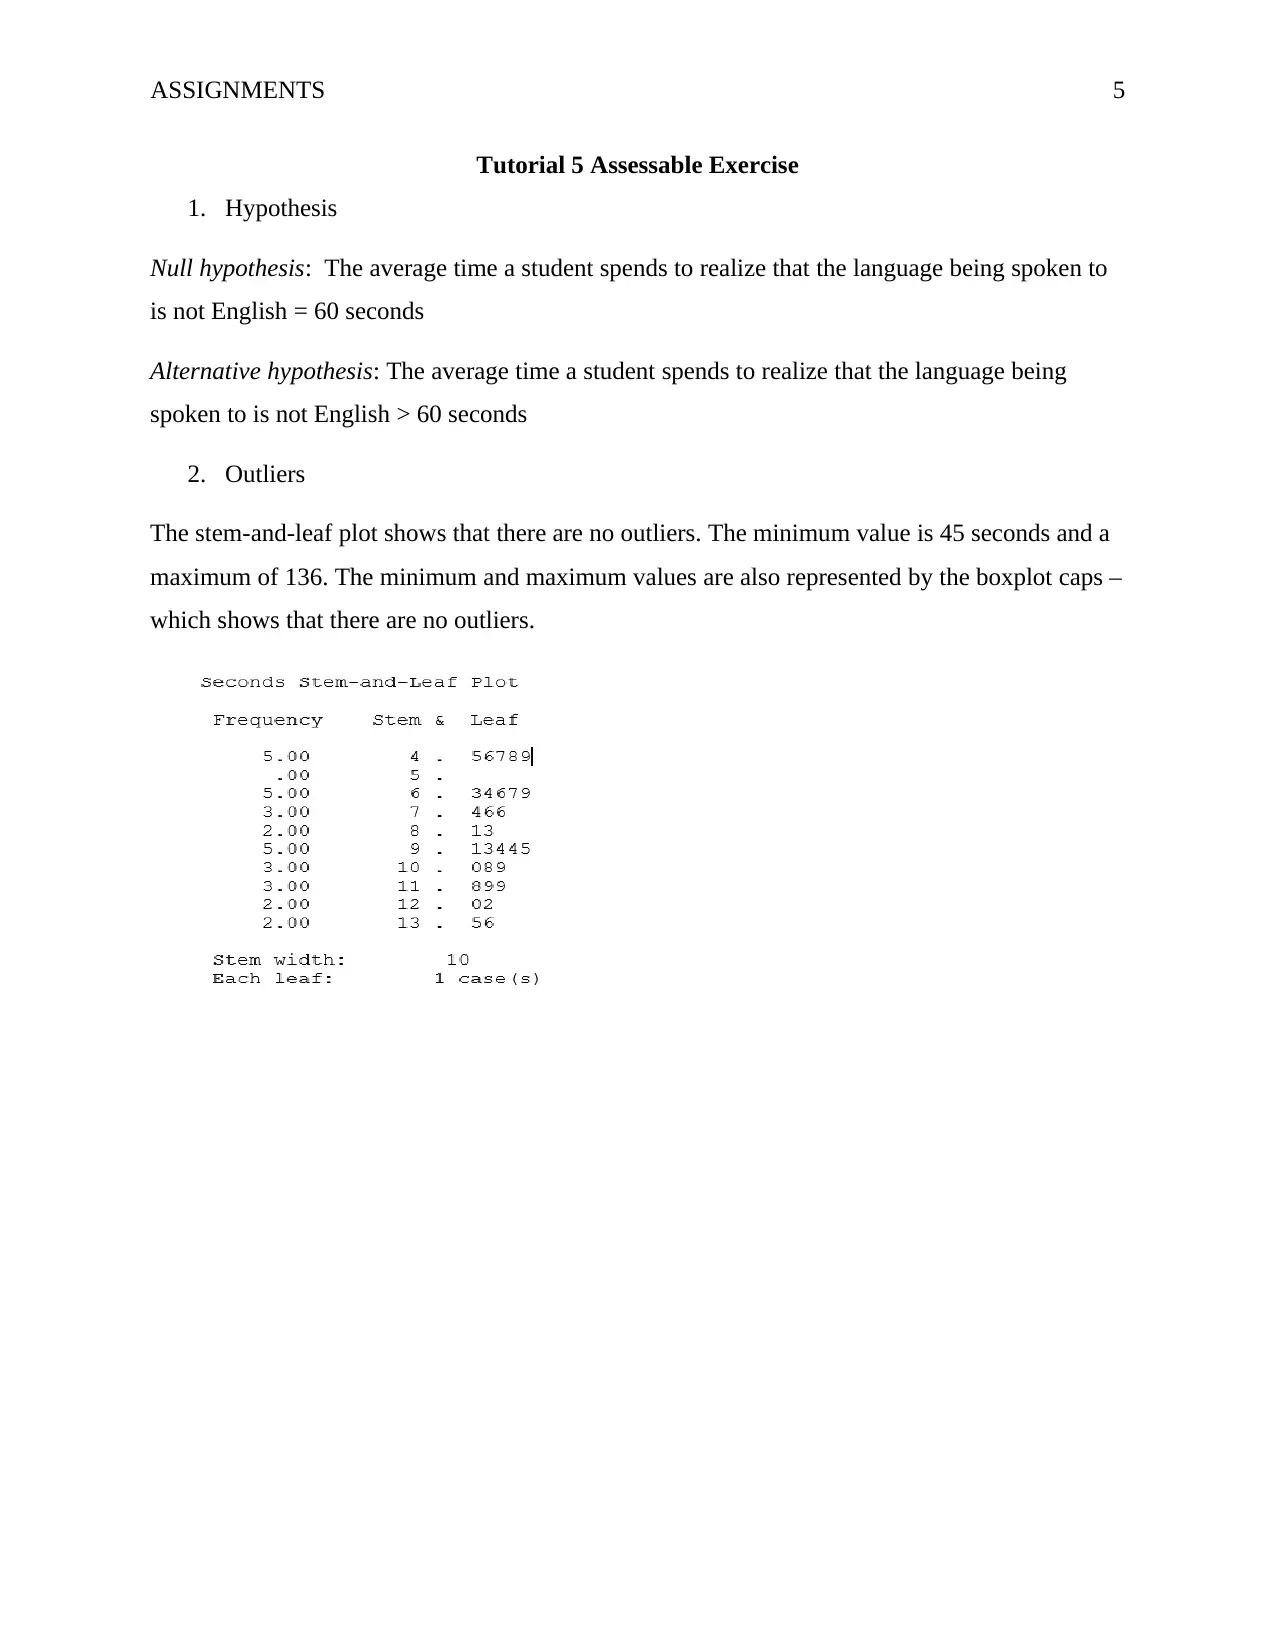
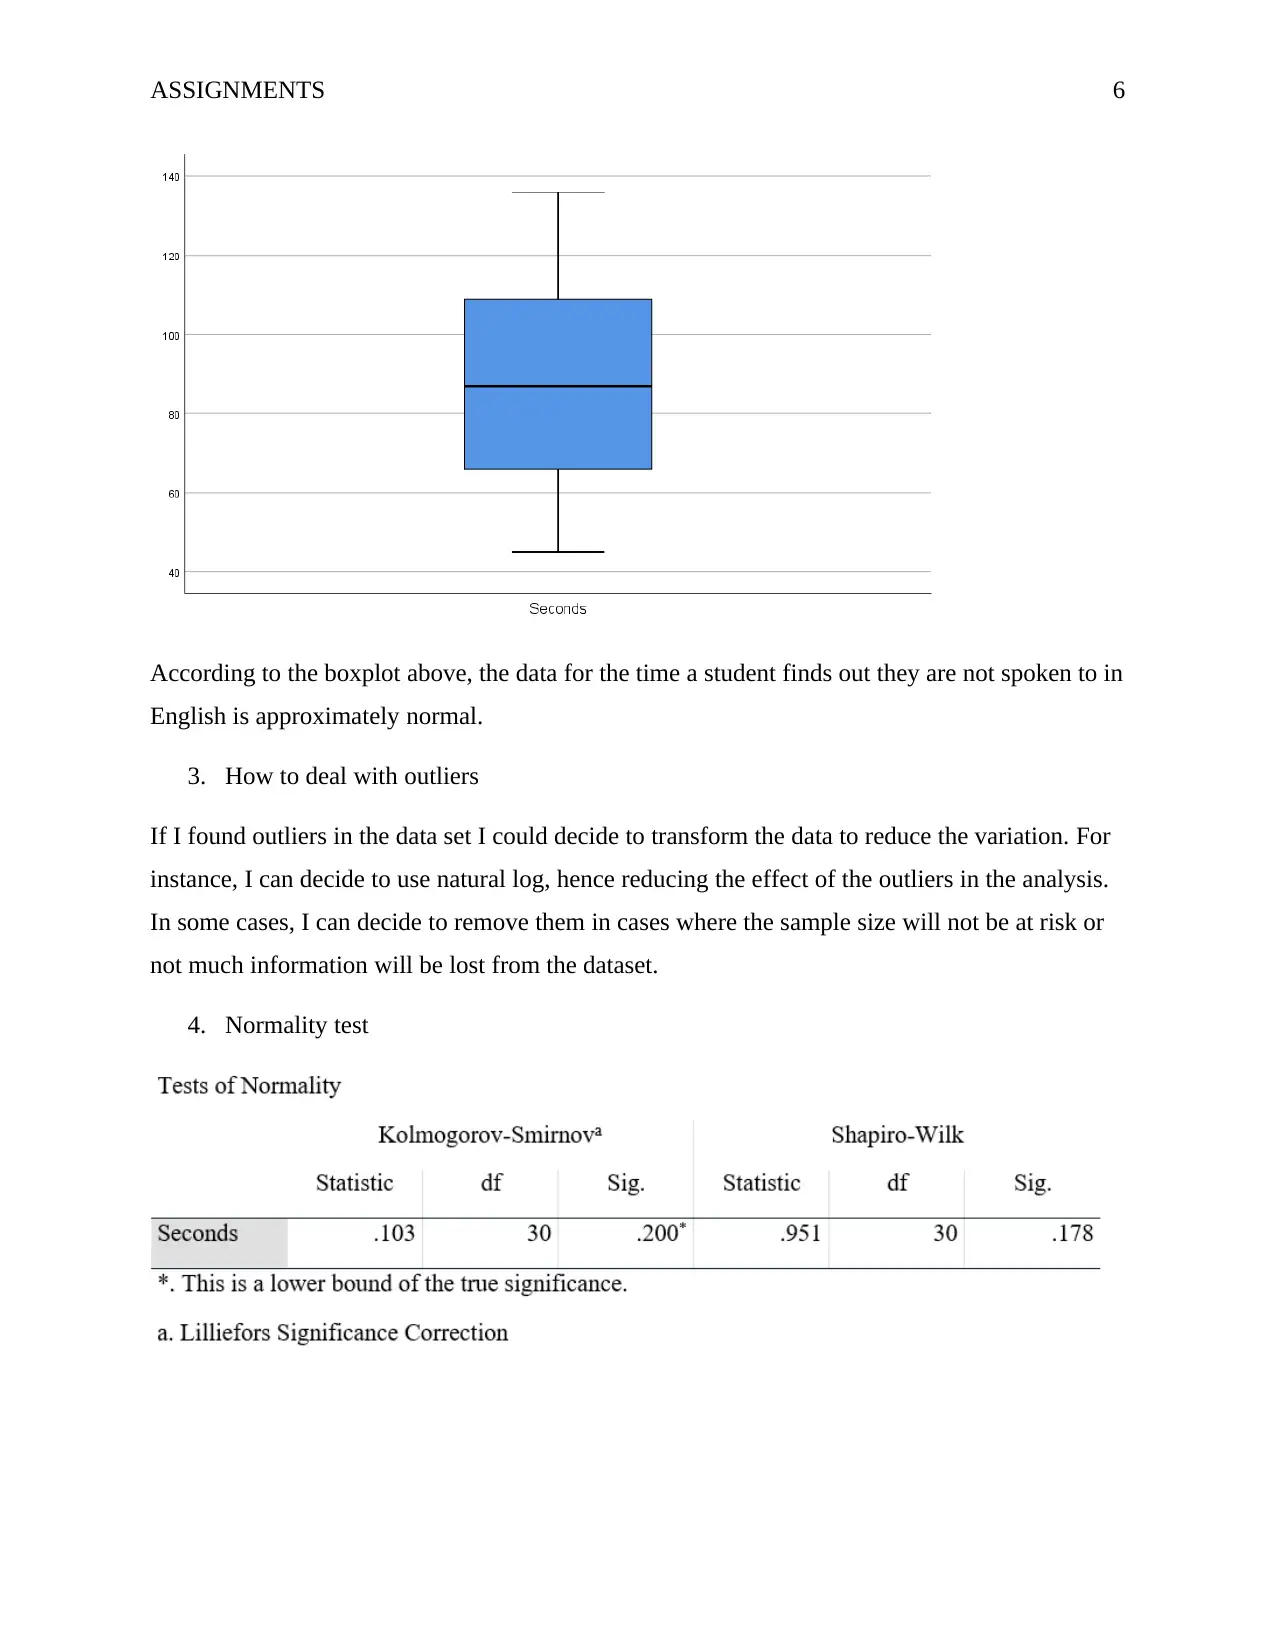
|7
|793
|388
Homework Assignment
AI Summary
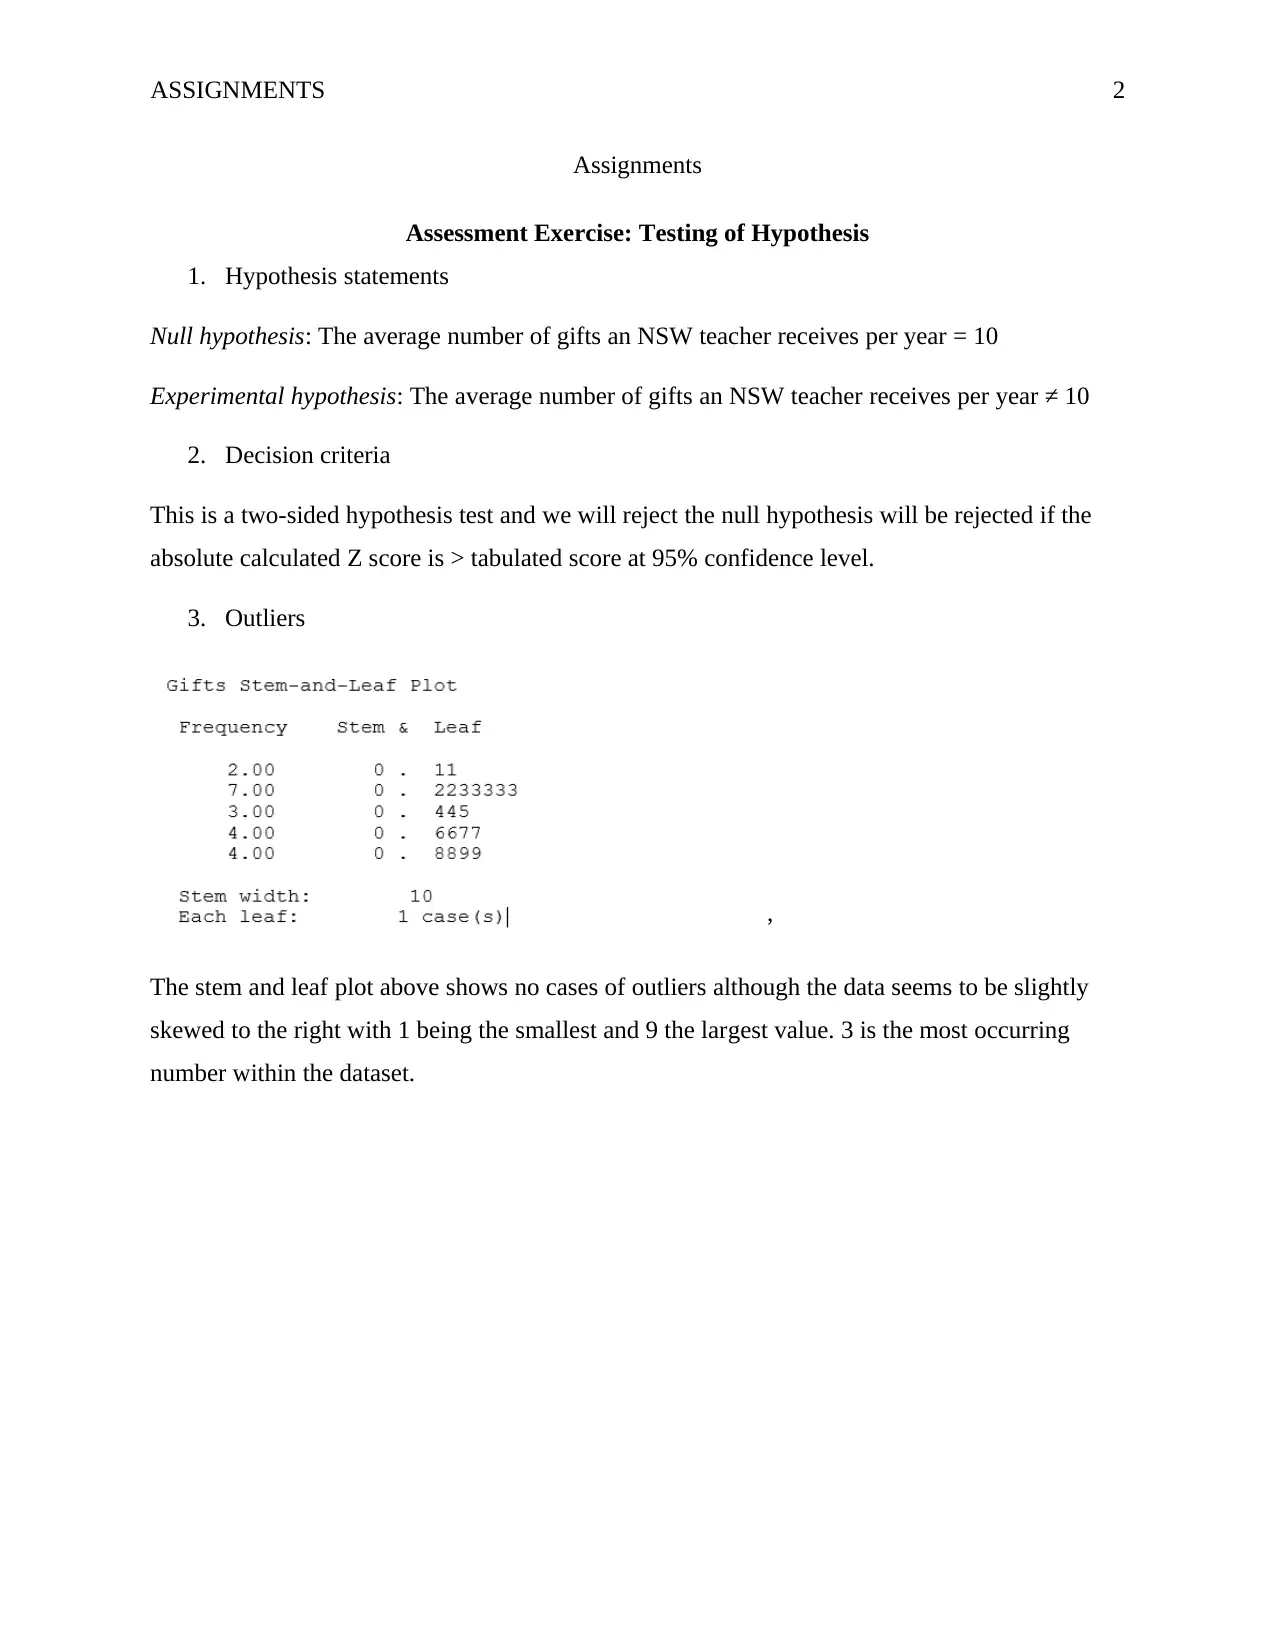
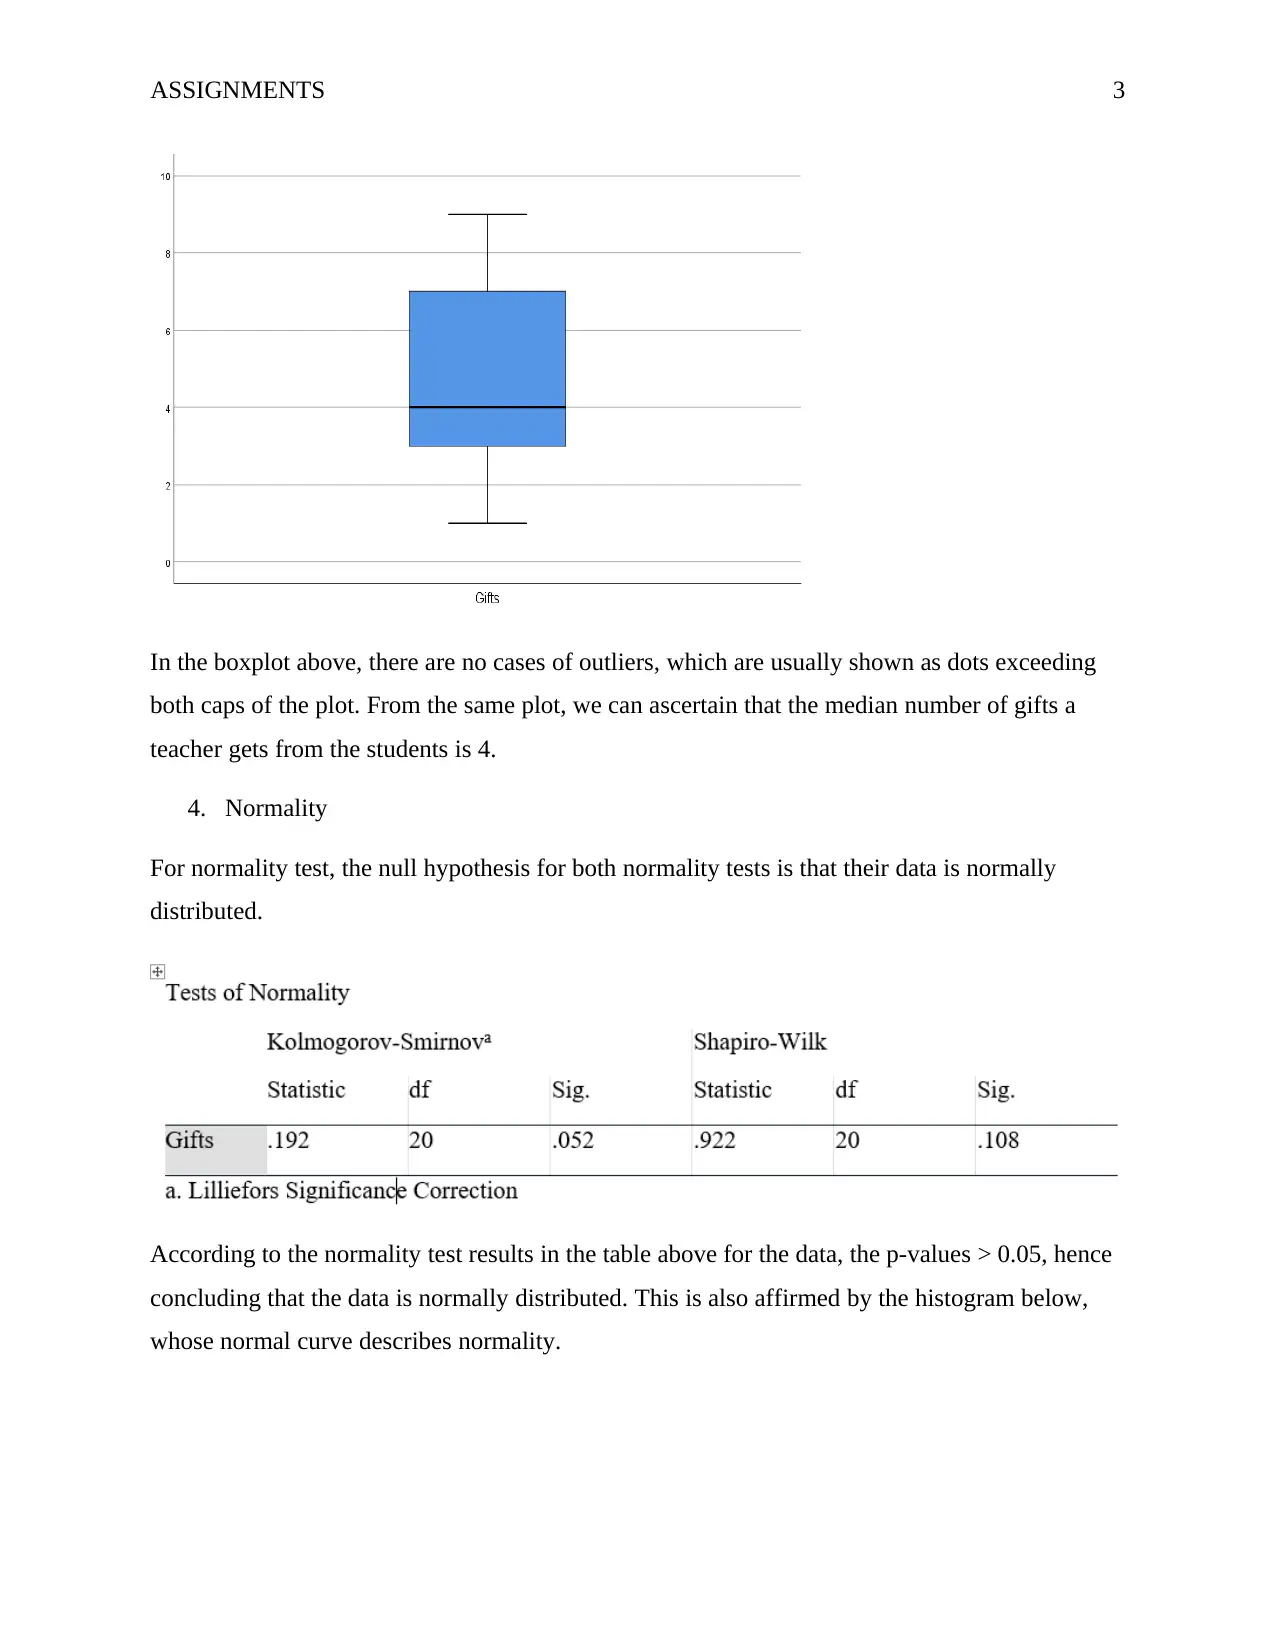
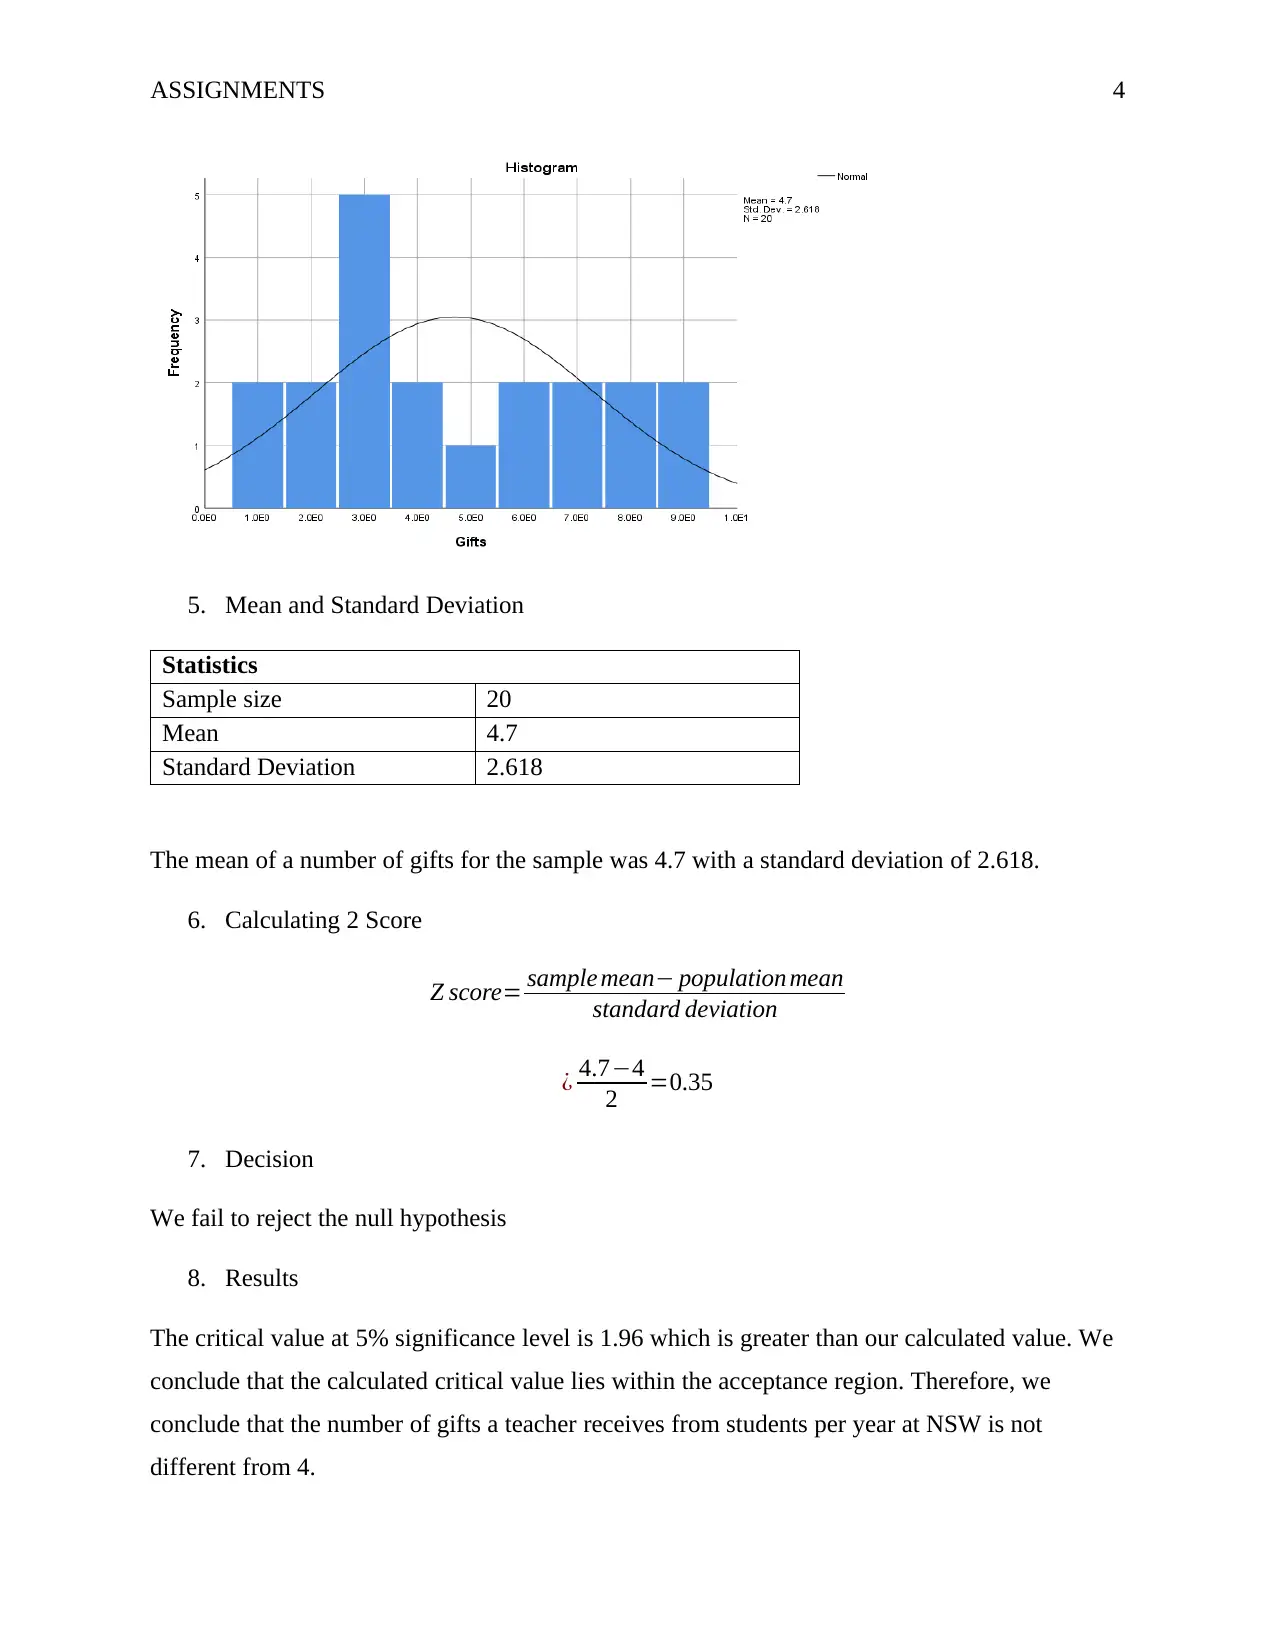
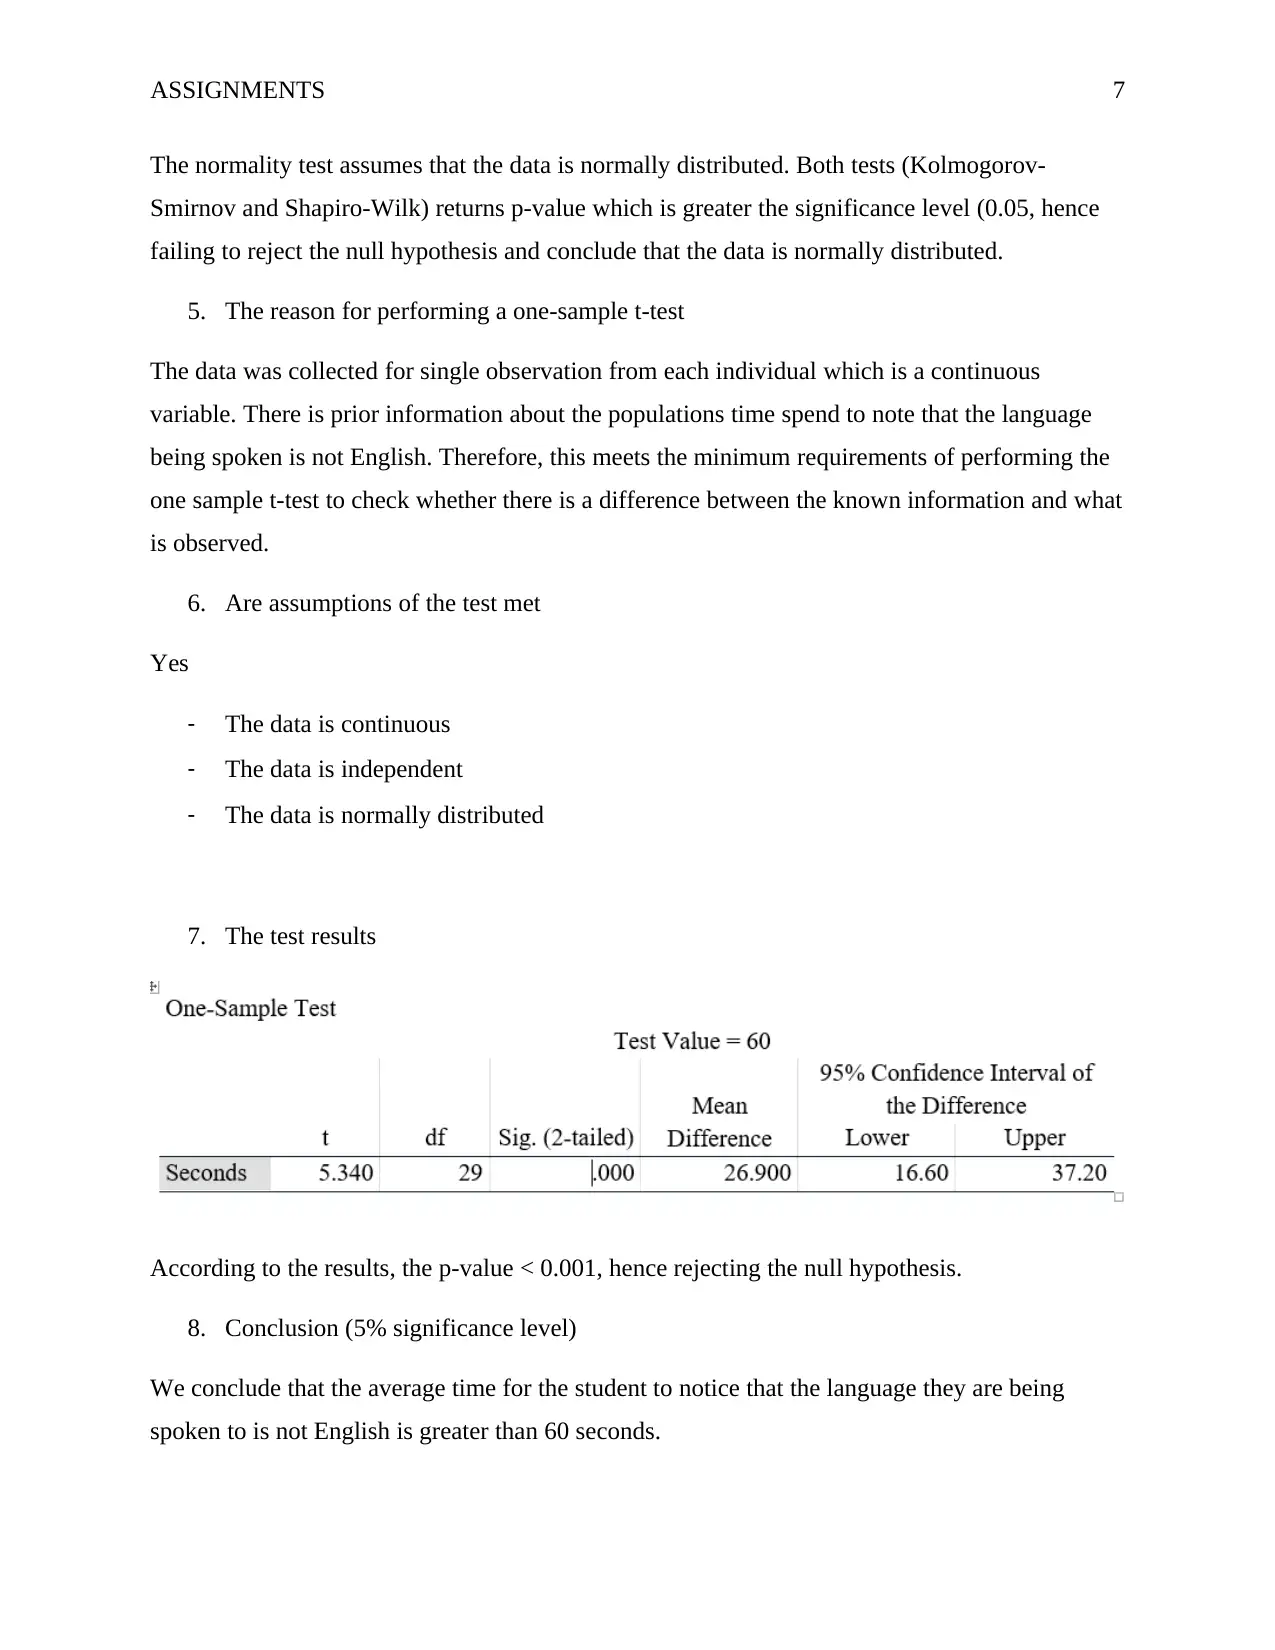
This assignment provides solutions to two statistical exercises involving hypothesis testing. The first exercise tests the hypothesis that the average number of gifts an NSW teacher receives per year is equal to 10, using a two-sided Z-test. The analysis includes outlier detection, normality tests, and the calculation of the Z-score, ultimately concluding that the null hypothesis cannot be rejected. The second exercise uses a one-sample t-test to determine if the average time a student takes to realize that the language being spoken is not English is greater than 60 seconds. The solution discusses how to handle outliers, performs normality tests, justifies the use of a one-sample t-test, and concludes that the average time is indeed greater than 60 seconds based on a significant p-value. The document also includes the assignment brief which provides context for the tutorials and exercises.
1 out of 7
Related Documents


Your All-in-One AI-Powered Toolkit for Academic Success.
+13062052269
info@desklib.com
Available 24*7 on WhatsApp / Email
![[object Object]](/_next/static/media/star-bottom.7253800d.svg)
Copyright © 2020–2026 A2Z Services. All Rights Reserved. Developed and managed by ZUCOL.