logo

Testing Of The Hypothesis docx.

6 Pages1011 Words39 Views
   

Added on  2022-08-13

Testing Of The Hypothesis docx.

   Added on 2022-08-13

ShareRelated Documents
Running head: TESTING OF THE HYPOTHESIS 1
Testing of the Hypothesis
Your Name
Institutional Affiliation
Testing Of The Hypothesis docx._1
TESTING OF THE HYPOTHESIS 2
Testing of the Hypothesis
Using the hypothesis tests, we will conclude that there is a relationship between poor
maintenance facility safety practices and commercial aviation delays. First, we will look at
the study parameters and statistics. Parameters give summary descriptions of a measure of the
target population while the statistic summarizes the measure of the sample population (Lubell
et al., 2012). For our case, the population is the air carrier delay.
A regression analysis of the sample data has to carried out first, and for a regression
analysis to be carried, dependent and independent variables have to be identified. For our
case, the dependent variable is the carrier delay, while the independent variable is the
weather. The independent variable is whether, as reported by the maintenance personnel in
the facility. Weather is known to be the cause of noise due to thunderstorms, and as well
lightnings. Lightning from thunderstorms causes hinderances and this would result in delays.
Noise, on the other hand, interferes with communication and signals. This would result in
delays as well. Therefore, reported noise and lightning is considered to be as a weather delay.
The following tables show the regression analysis a sample data from the airport. The
analysis was obtained from Excel.
SUMMARY OUTPUT
Regression Statistics
Multiple R
0.852437
132
R Square
0.726649
064
Adjusted R
Square
0.724645
056
Standard
Error
1573.562
525
Observation
s 500
ANOVA
df
SS
MS
F Significance F
Regression 1 3284526026
328452602
6
1326.492
196 1.6134E-142
Testing Of The Hypothesis docx._2
TESTING OF THE HYPOTHESIS 3
Residual 499 1235573411
2476099.0
2
Total 500 4520099437
Coefficien
ts
Standard
Error
t Stat P-value Lower 95%
Upper
95%
Intercept 0 #N/A #N/A #N/A #N/A #N/A
141
2.810514
787
0.07716733
9
36.421040
56
1.2119E-
142 2.658901848
2.9621
77
The sample data used for the above regression analysis was 500 cases. From the
regression statistics table, Multiple R represents the correlation coefficients, which measure
the strength of variation between the two variables analyzed. The correlation coefficient
usually lies between the values -1, and 1 (Edwards, 2002). When the correlation has a
positive value, it means that there is a positive relationship between the variables. On the
other hand, a negative value of the correlation coefficient indicates that there is a negative
relationship between the variables. For our case, the correlation coefficient is 0.852437132,
which is positive. This shows that there is a relationship between the carrier delay and the
weather reported by the maintenance personnel.
The R Square from the regression statistics table represents the coefficient of
determination, which acts as an indicator of goodness of fit. The coefficient of determination
illustrates the points that are within the regression line. R Square is more precise in the
ANOVA analysis (Israeli, 2007). In ANOVA analysis, R Square it is the sum of squares (SS),
which is the squared deviation of the initial data from the mean. In our case, the R Square is
0.726649064, and when rounded to two digits becomes 0.73, which is significant. This figure
means that 72% of the values used to calculate the regression fit the model. Therefore, an R
Square of 72% is of a good fit.
Testing Of The Hypothesis docx._3

End of preview

Want to access all the pages? Upload your documents or become a member.

Related Documents
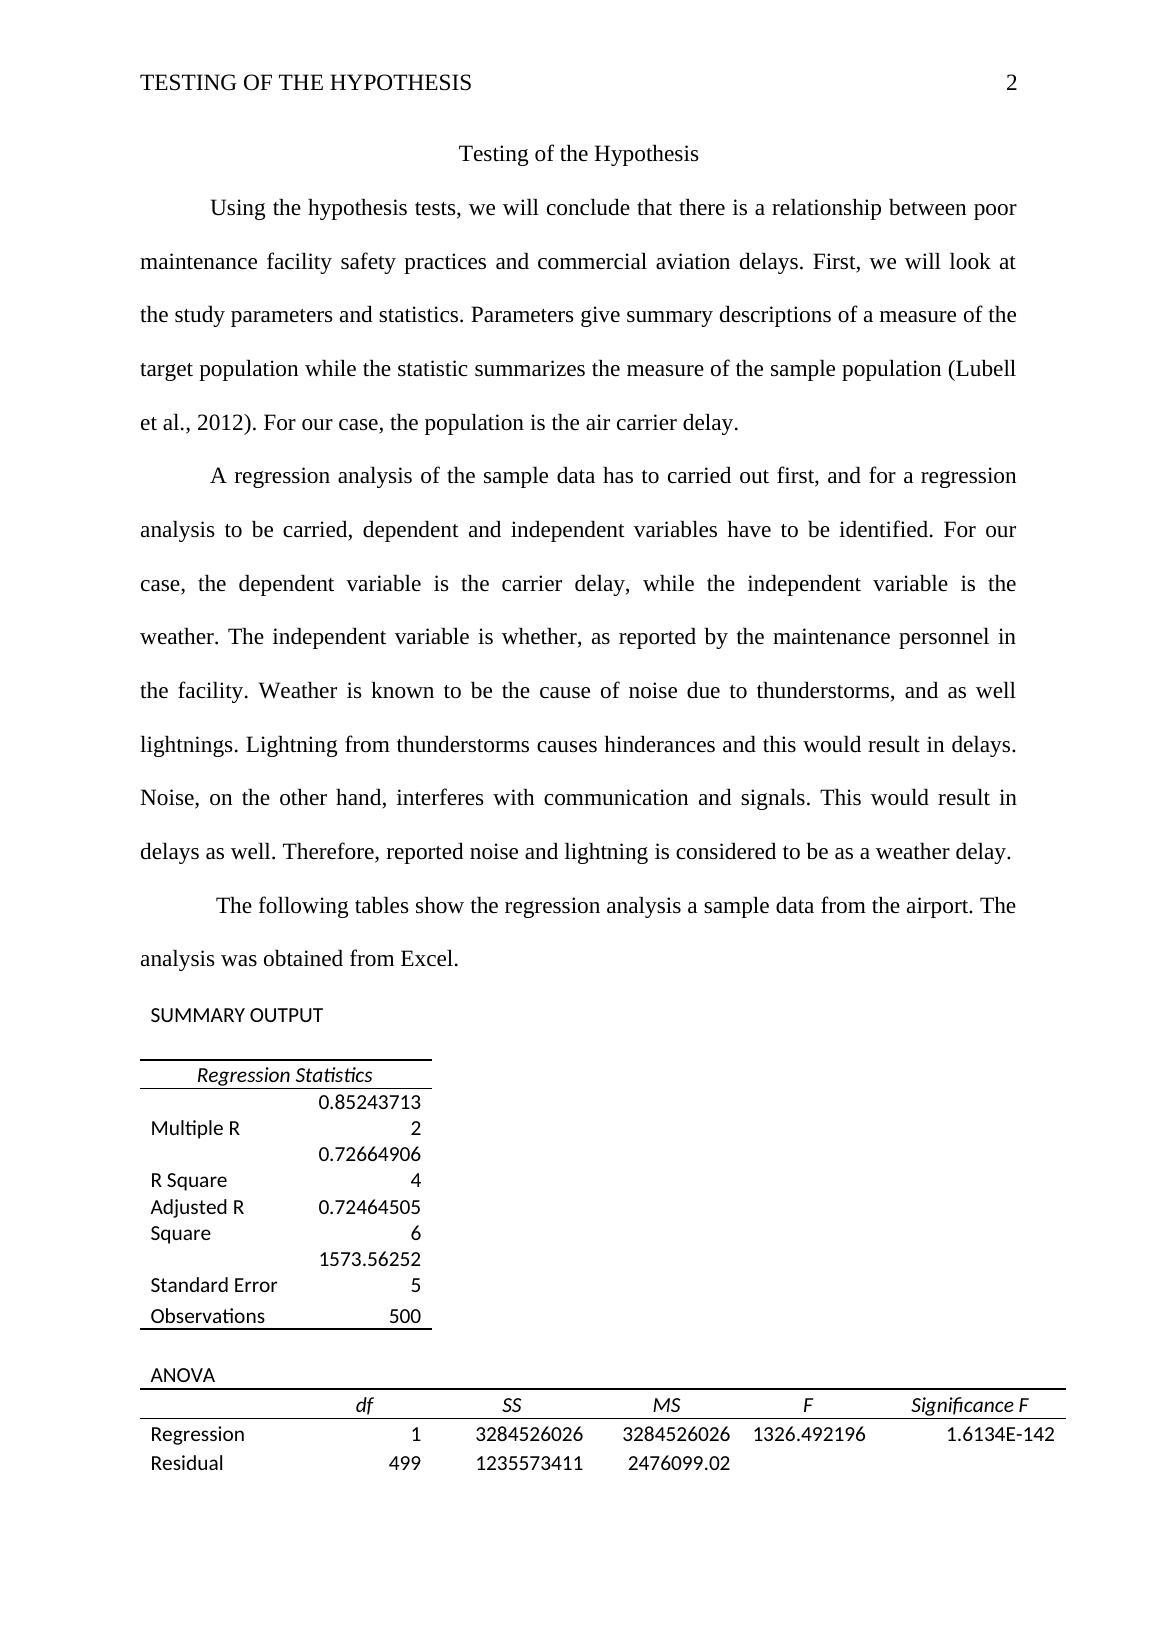
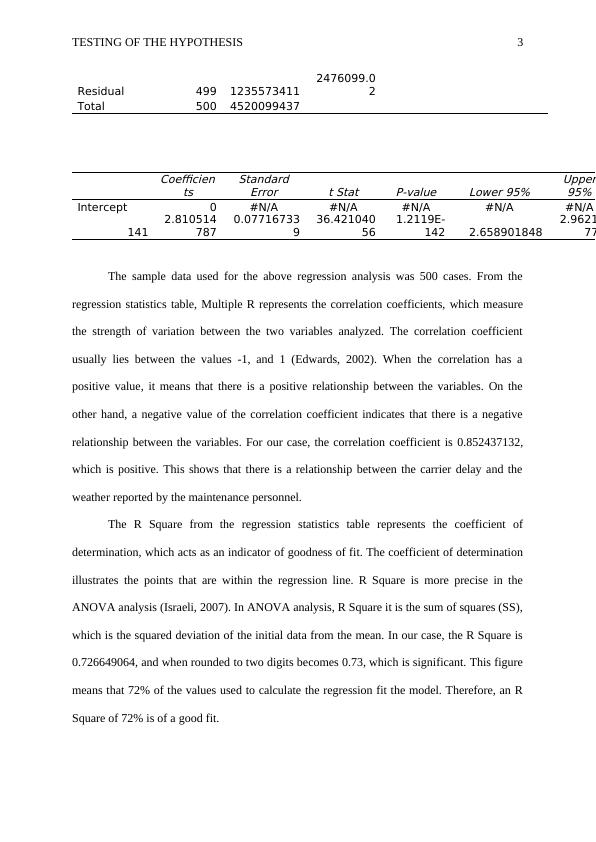
Regression Analysis of Relationship between Annual Income and Credit Card Charges
|7
|1017
|404

Business Statistics: Regression and Correlation Analysis
|9
|1063
|258

Statistical analysis of renovation cost and selling prices on basis of regression equation
|17
|1088
|172

Climate Change and Adaptation Data Analysis
|11
|1702
|202

Statistics: Descriptive Analysis, Hypothesis Tests, and Interval Prediction
|18
|1122
|41

Analysis of Click Sales Data
|11
|1213
|79