ProductsLogo
LogoStudy Documents
LogoAI Grader
LogoAI Answer
LogoAI Code Checker
LogoPlagiarism Checker
LogoAI Paraphraser
LogoAI Quiz
LogoAI Detector
PricingBlogAbout Us
logo

Analysis of Recession and Crisis Management

Verified

Added on  2020/09/08

|134
|35972
|38
AI Summary
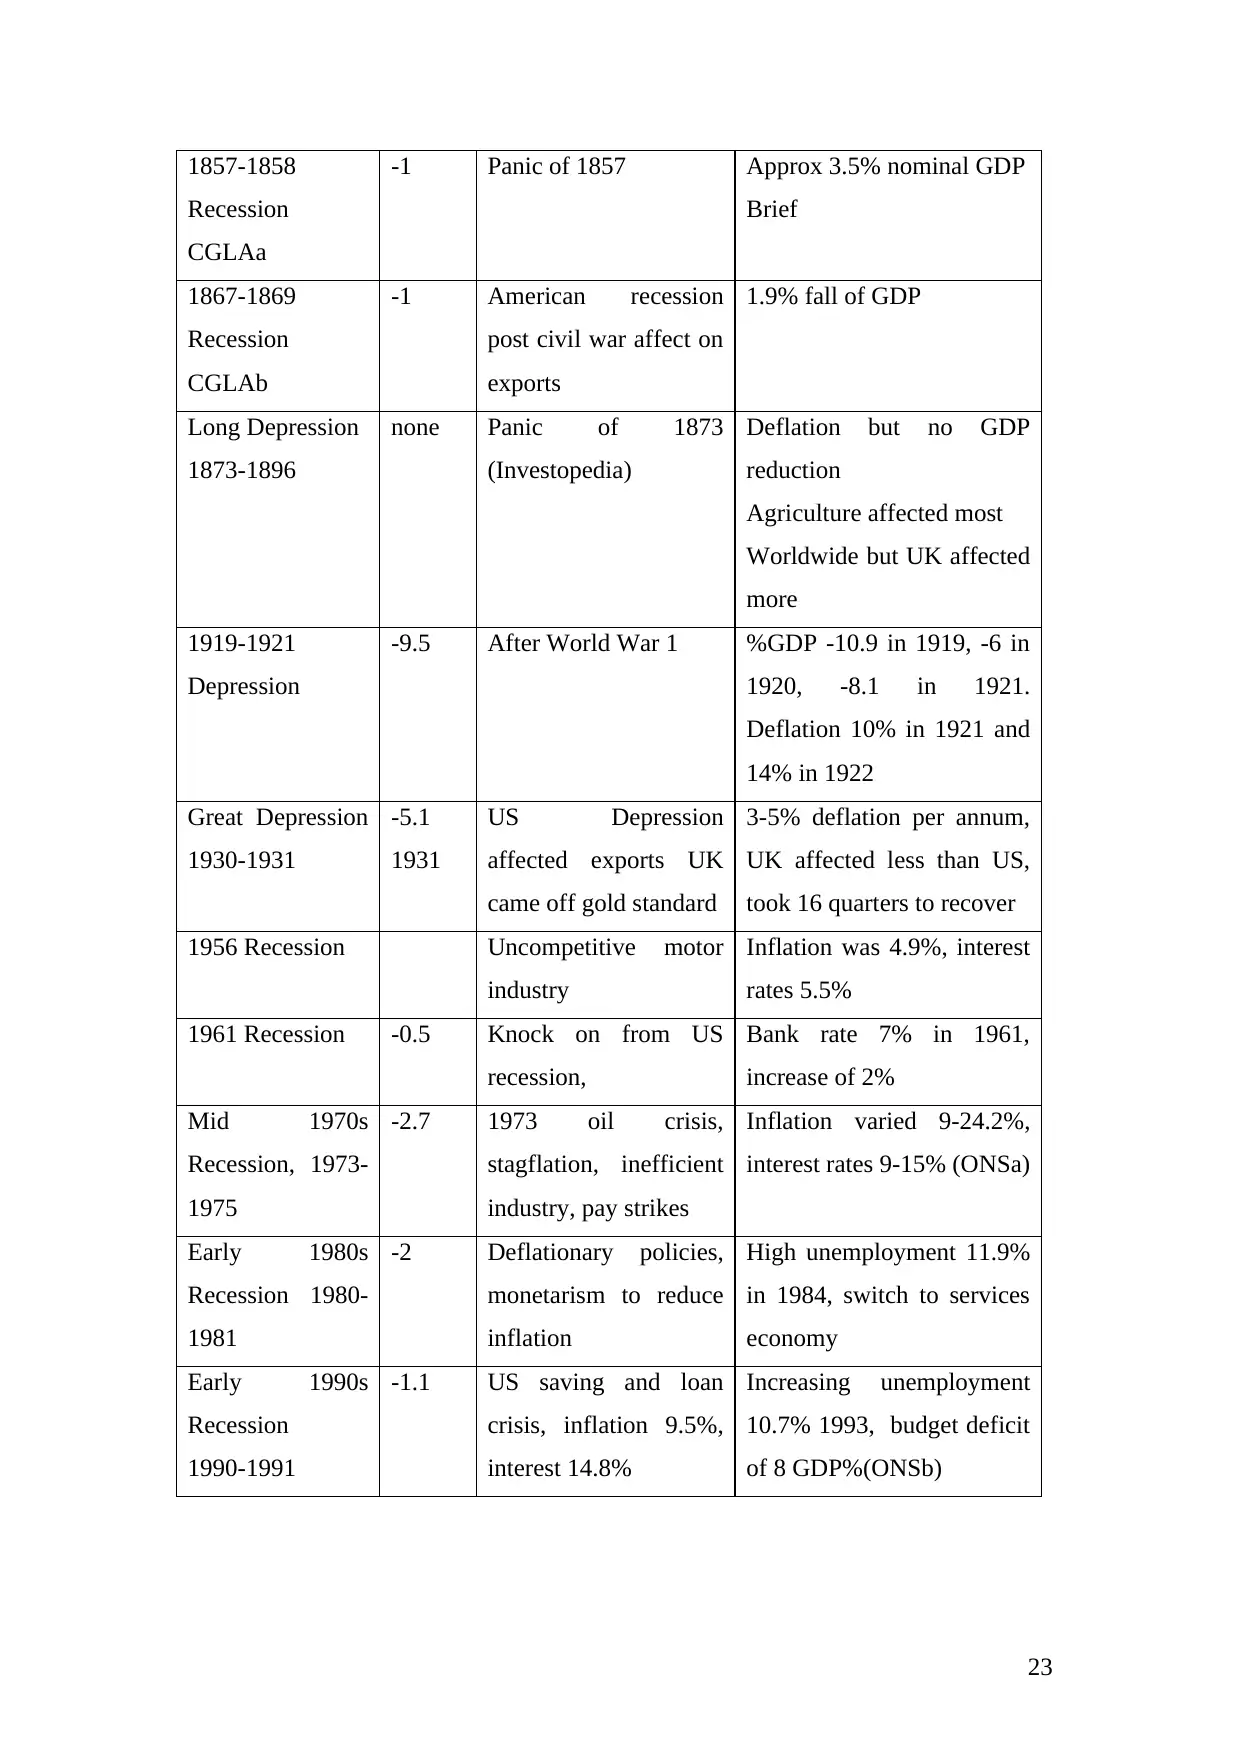
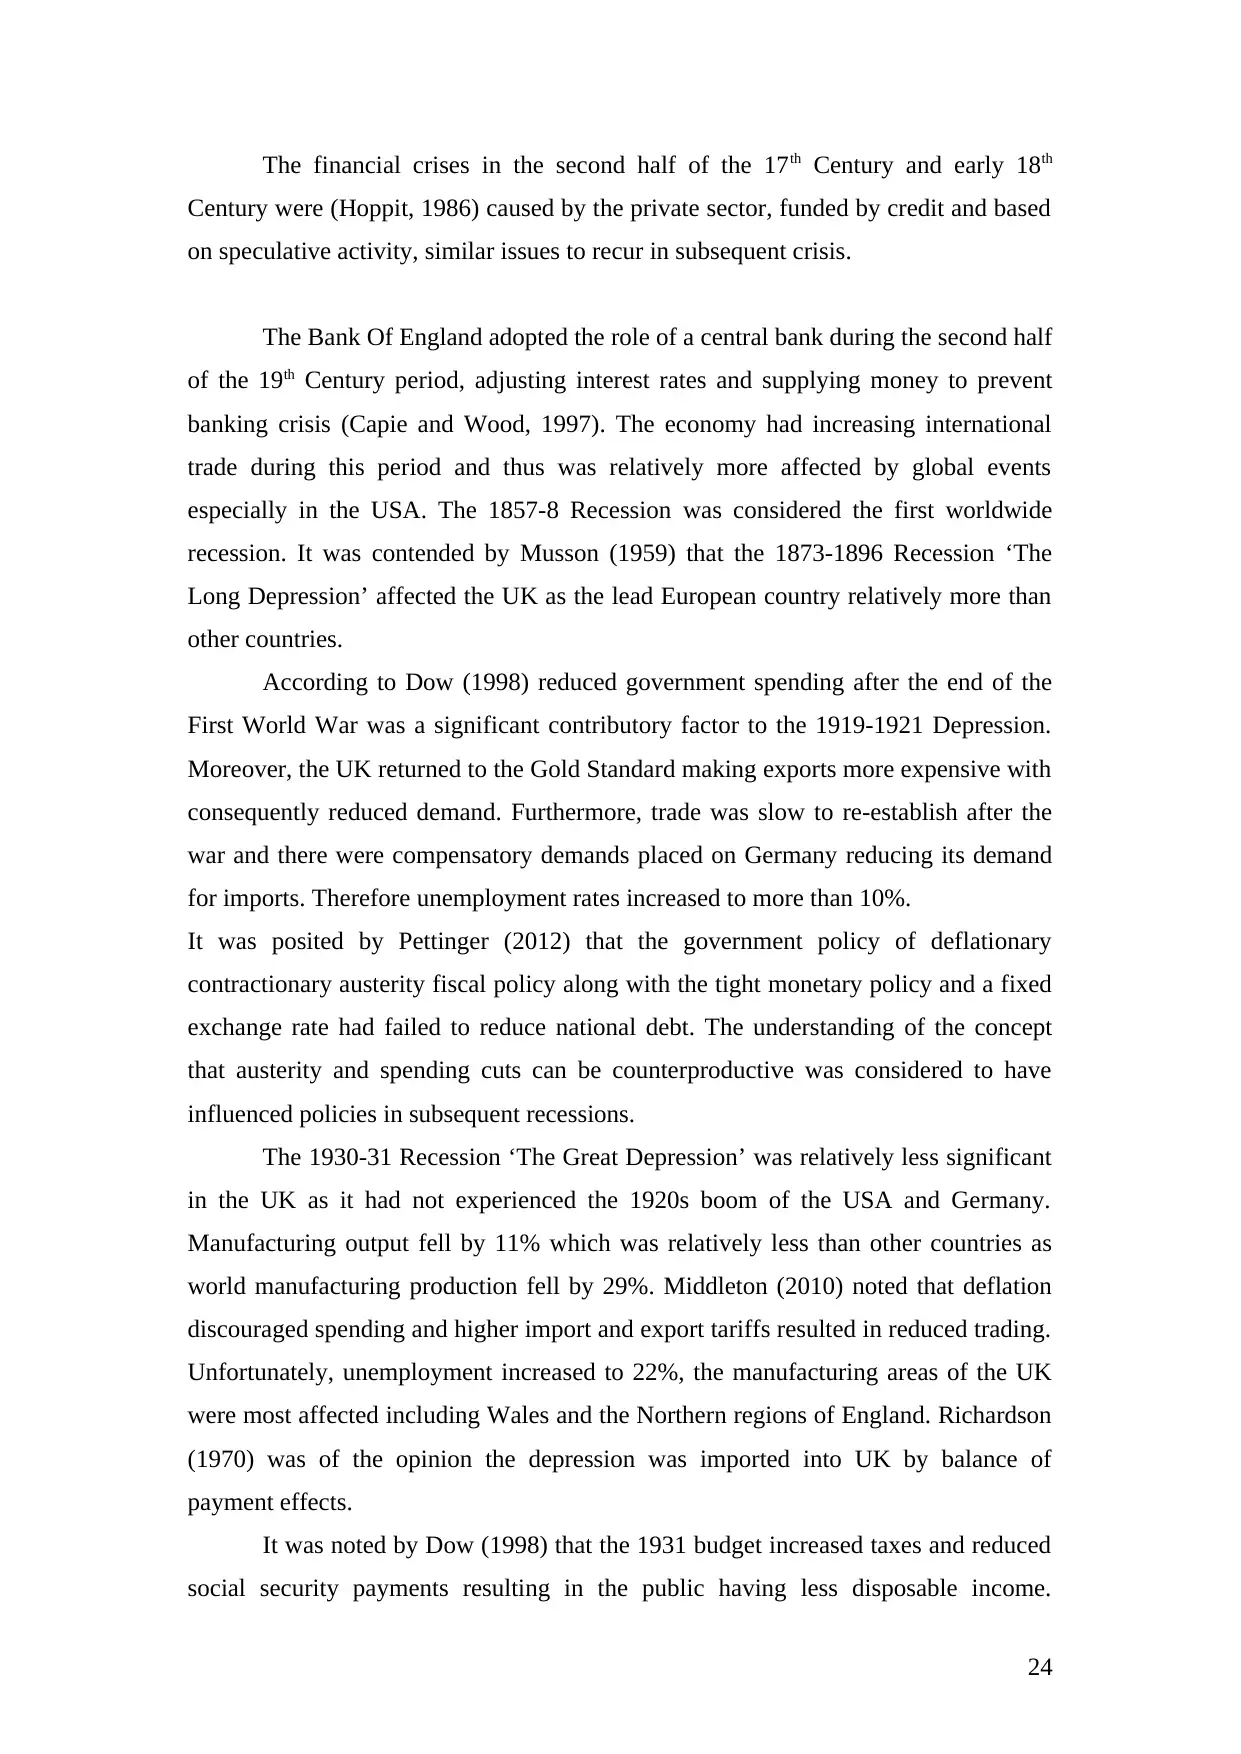
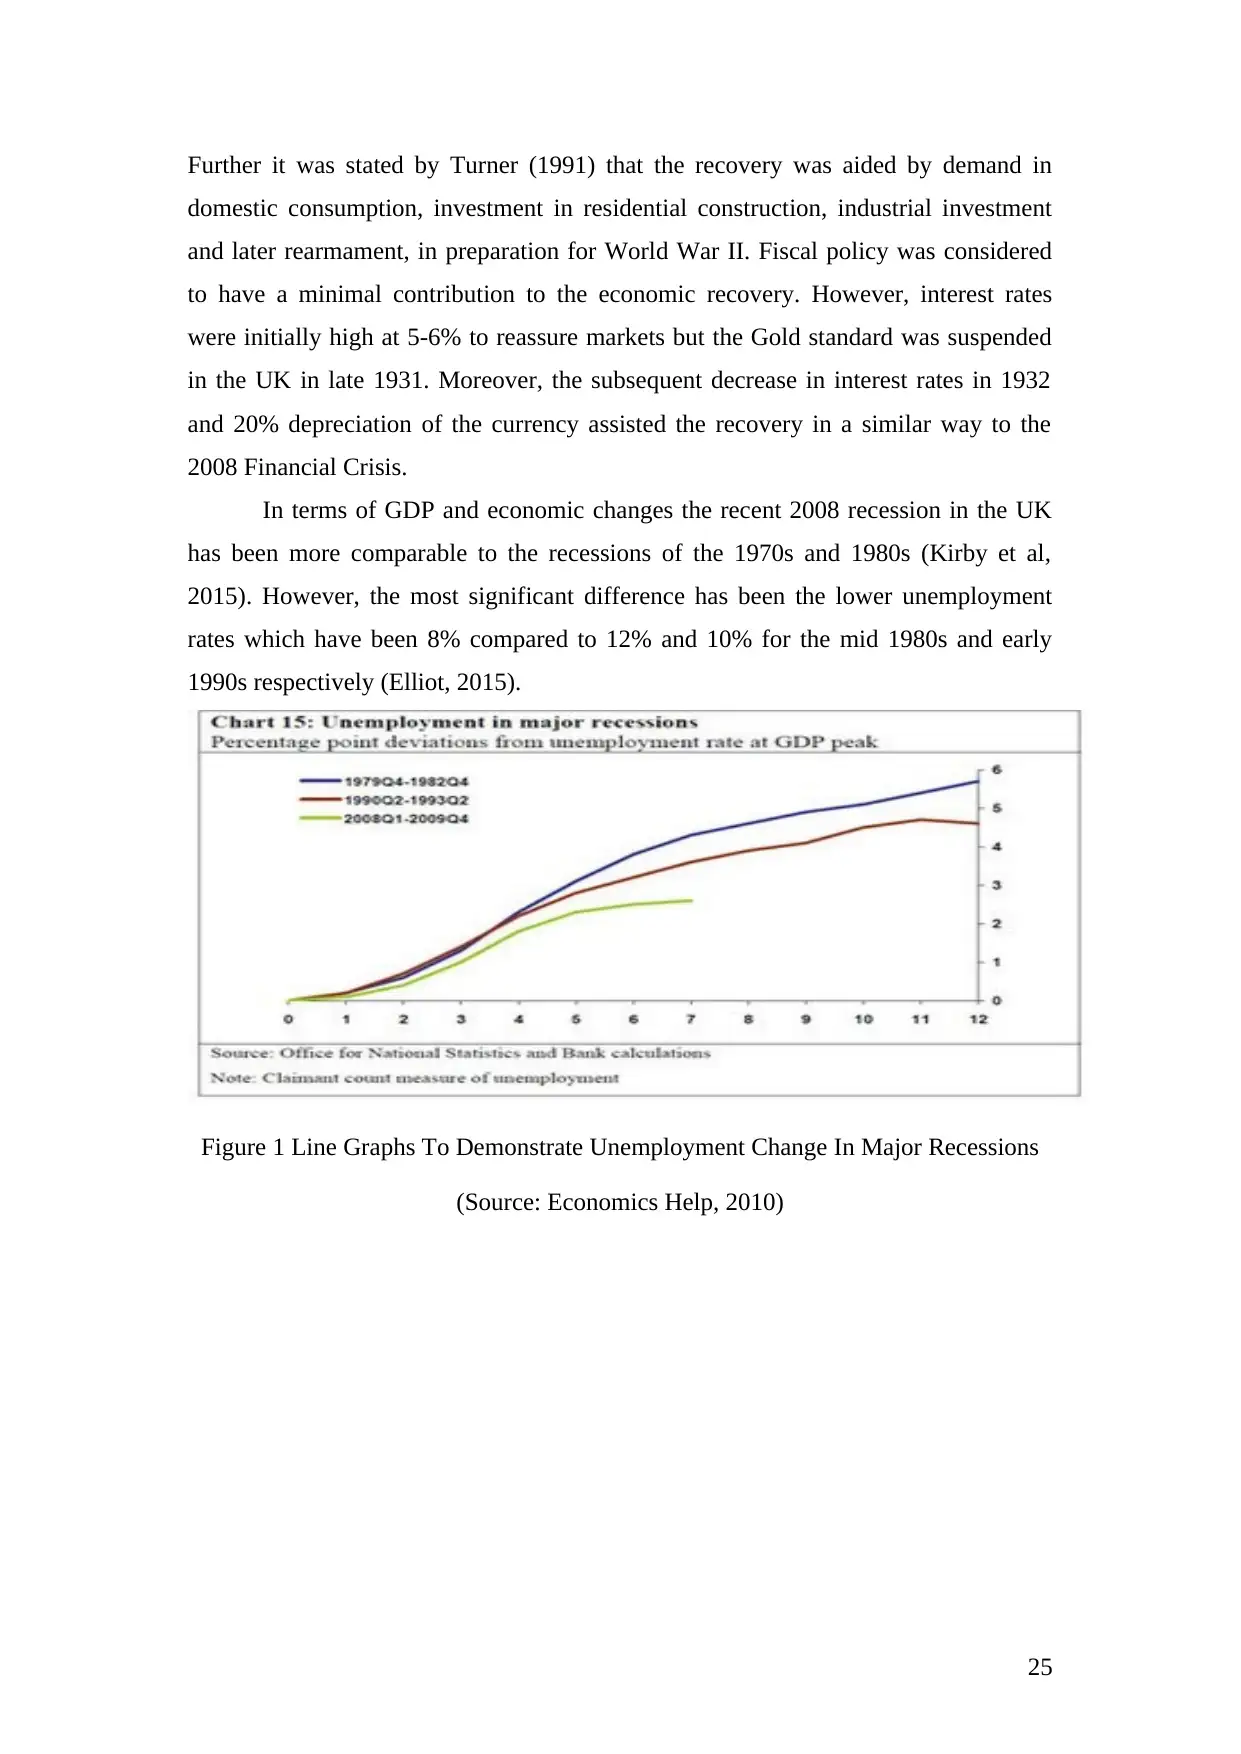
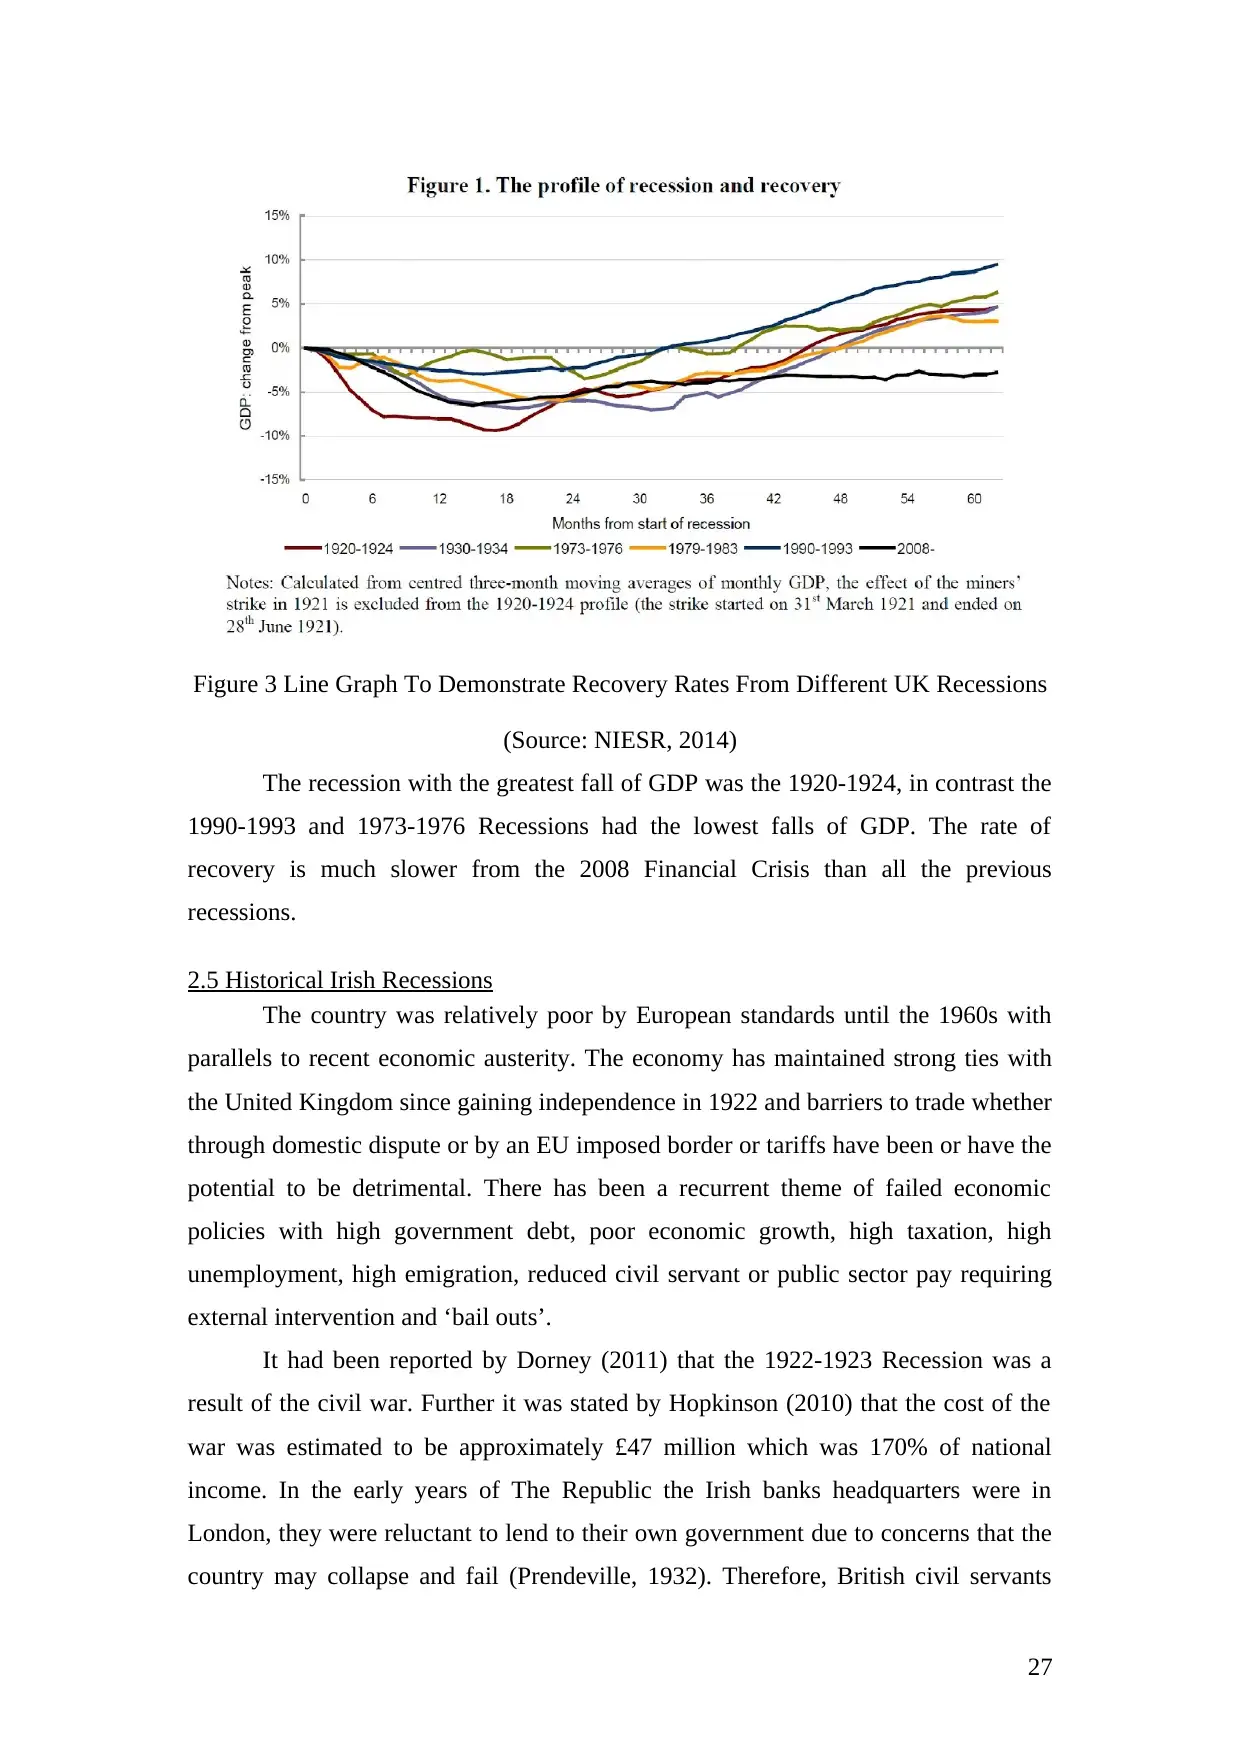
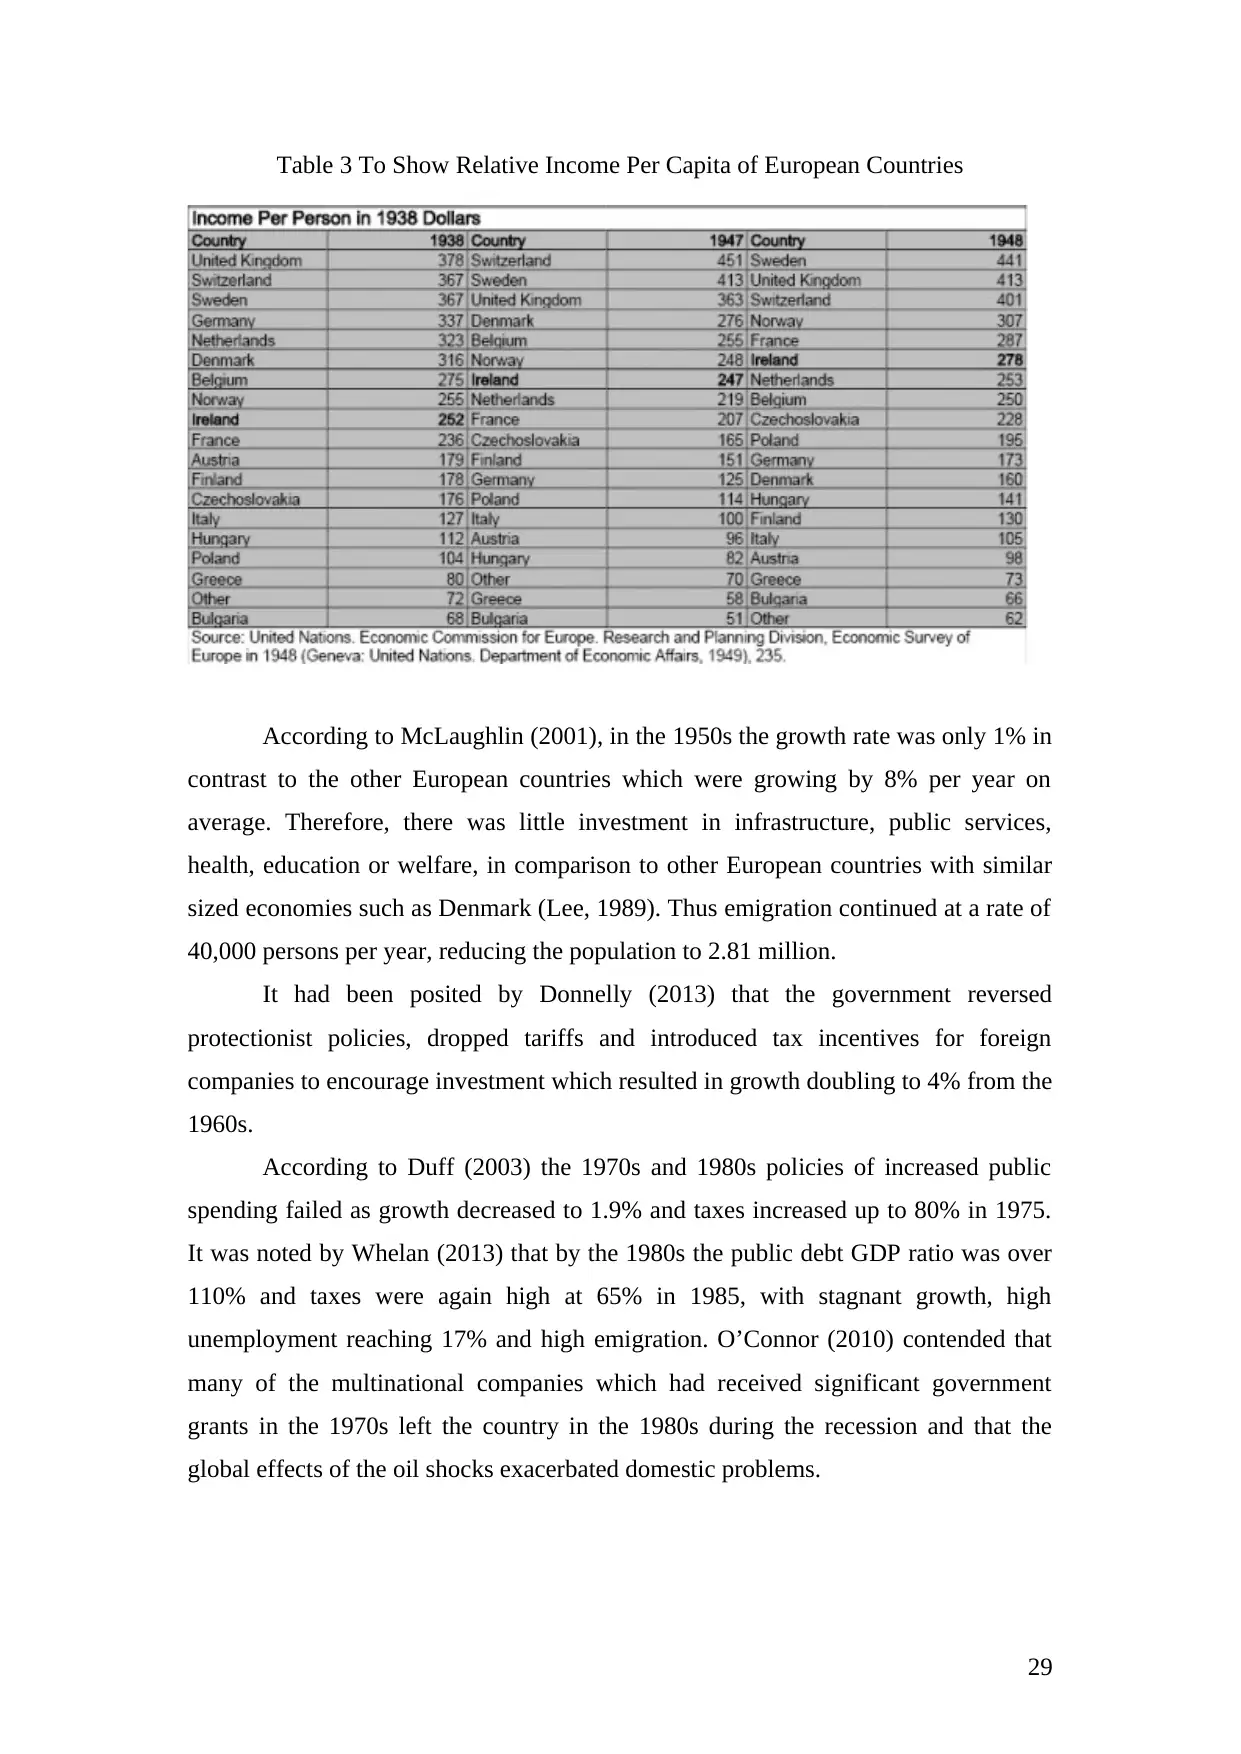
This assignment requires an in-depth examination of recession and crisis management. It involves analyzing the causes, effects, and responses to economic downturns in various countries, including the United States and the United Kingdom. The assignment also delves into specific events such as the Great Depression, the Irish Sovereign Debt Crisis, and the 2007-2008 Global Financial Crisis. Additionally, it explores policies and interventions implemented by governments to mitigate these crises, including fiscal measures, monetary policy, and social housing initiatives. The assignment aims to provide a nuanced understanding of recession and crisis management, highlighting key lessons for policymakers and researchers.

Contribute Materials

Your contribution can guide someone’s learning journey. Share your documents today.
Document Page
Recessions and Opportunity:
The 2008 Financial Crisis Revisited – What Are
The Business Investment Opportunities in 2017?
1

Secure Best Marks with AI Grader

Need help grading? Try our AI Grader for instant feedback on your assignments.
Document Page
Dissertation Declaration
Statement of Originality and Authenticity
I confirm that the dissertation I am submitting is an original and authentic
piece of work compiled by myself that satisfies the university rules and regulations
with respect to Plagiarism and Collusion. I further confirm that I have fully referenced
and acknowledged all material incorporated as secondary resources in accordance
with the Harvard system.
I also clarify that I have taken a copy of the dissertation, which I will retain
until after the Board of Examiners have published the results, and which I will make
available on request of pursuance of any appropriate aspect of the making and
modernisation of the work within the university regulations.
2
Document Page
Acknowledgement
I would like to acknowledge the help of my family which has given me much
support. I also want to acknowledge the help of my rental manager and my accountant
for business advice.
3
Document Page
Abstract
Purpose - Motivation for the project was to be able to integrate elements of
the program and study a topic in depth. The purpose of the research was to examine
previous recessions including the 2008 Financial Crises to identify patterns and
investment business opportunities in 2017.
Design/Methodology/Approach- This research uses an empirical strategy with
a phenomenological orientation and an inductive approach. Literature regarding
previous recessions was examined and compared to the 2008 Financial Crisis which
was critically analysed to determine business opportunities. Secondary quantitative
data was collected from government publications, government agencies, academic
journals/publications, trade associations, internet based databases, university based
databases, syndicate based databases, business press, media companies, internet,
TV/radio, local private sources and personal networking.
Secondary quantitative data was analysed in the form of descriptive statistics
in the form of area charts, bar charts, line graphs, map charts and area graphs to
demonstrate trends. Macro environmental factors, including regional markets,
services and alternative investments were considered. The methodology was
analytical, with a critical assessment of collected secondary information and data to
develop a theory and strategic business model for which the risks, strengths and
weaknesses were examined.
Findings - The research supports a business strategy of investment in
residential property in Northern Ireland specifically Londonderry/Derry. Properties
remain between 50-70% of peak 2007 values therefore would be expected to increase
significantly in value in the next decade. Expected rental and capital gain yields in
2017 are likely to be greater than alternative investments such as shares, bonds or
cash deposit accounts.
Londonderry/Derry has been identified as an especially good market as
property values in this area have been slower to increase in value than in the larger
capital cities such as Dublin and Belfast. There are relatively more repossessed
properties available in this city which can be purchased below market value.
Moreover, estate agency fees and performance are more competitive in this city at
10% plus vat of rent. Furthermore, social tenants rent unfurnished properties and
rental yields of 8-10% can still be achieved in 2017. Risks or threats such as interest
4

Paraphrase This Document

Need a fresh take? Get an instant paraphrase of this document with our AI Paraphraser
Document Page
rate increases, government tax legislation regarding buy to let mortgages can be
mitigated by buying a limited number of properties mortgage free.
5
Document Page
Contents
Page
Title Page 1
Dissertation Declaration 2
Acknowledgement 3
Abstract 4-5
Contents 7-8
List of Figures 9-10
List of Tables 11
List of Abbreviations 12
6
Document Page
Table of Contents
CHAPTER 1: INTRODUCTION................................................................................13
1.1 Background of the study....................................................................................13
1.2 Aim.....................................................................................................................13
1.3 Overview and relevance of past literature..........................................................13
1.4 Objectives...........................................................................................................14
1.5 Methodology Overview.....................................................................................14
1.6 Scope..................................................................................................................14
1.7 Structure of the Report.......................................................................................15
1.8 Conclusion..........................................................................................................15
CHAPTER 2: LITERATURE REVIEW.....................................................................16
2.1 Introduction........................................................................................................16
2.2 Definition of Recession and Financial Crisis.....................................................16
2.2.1 Recession.....................................................................................................16
2.2.2 Depression...................................................................................................16
2.2.3 Financial Crisis............................................................................................16
2.2.4 Challenges in The Application of Definitions............................................17
2.3 Historical USA Recessions............................................................................17
2.4 Historical UK Recessions..................................................................................22
2.5 Historical Irish Recessions.................................................................................27
2.6 2008 Financial Crisis USA.................................................................................30
2.7 2008 Financial Crisis UK...................................................................................31
2.8 2008 Financial Crisis Republic Of Ireland.........................................................34
2.9 Mortgage Lending And The 2008 Financial Crisis.......................................36
2.9 Conclusion..........................................................................................................38
CHAPTER 3: RESEARCH METHODOLOGY.........................................................40
3.1 Introduction........................................................................................................40
3.2 Research Philosophy..........................................................................................41
3.2.1 Positivism research philosophy...................................................................42
3.2.2 Interpretivism research philosophy.............................................................42
3.3 Research approach.............................................................................................43
3.3.1 Deductive research approach......................................................................43
3.3.2 Inductive research approach........................................................................44
3.4 Research type: Quantitative and qualitative.......................................................45
3.4.1 Quantitative research...................................................................................45
3.4.2 Qualitative research.....................................................................................45
3.5 Data collection...................................................................................................46
3.5.1 Primary data................................................................................................46
3.5.2 Secondary data............................................................................................46
3.6 Data analysis......................................................................................................47
3.7 Reliability and Validity of Data.........................................................................49
3.8 Ethical Issues......................................................................................................50
3.9 Limitation of the study.......................................................................................50
3.10 Conclusions......................................................................................................51
CHAPTER 4: DATA ANALYSIS...............................................................................52
4.1 Introduction........................................................................................................52
4.2 Results................................................................................................................52
4.2.1 UK Property Prices.....................................................................................52
7

Secure Best Marks with AI Grader

Need help grading? Try our AI Grader for instant feedback on your assignments.
Document Page
4.2.2 Regional Property Prices........................................................................56
4.2.3 Northern Ireland Property Market..........................................................58
4.2.4 UK Housing Tenure....................................................................................60
4.2.5 Republic Of Ireland Property Market.........................................................63
4.2.6 Repossessions..............................................................................................65
4.2.7 Interest Rates...............................................................................................70
4.2.8 Stock Market Shares versus Property.........................................................73
4.2.9 Precious Metals...........................................................................................82
CHAPTER 5: DISCUSSION.......................................................................................84
5.1 Introduction........................................................................................................84
5.2 Residential Property...........................................................................................84
5.2.1 UK Residential Property Prices..................................................................84
5.2.1.1 Introduction..............................................................................................84
5.2.1.2 Long Term Trends.............................................................................84
5.2.1.3 Factors Affecting Housing Market...........................................................84
5.2.1.4 1990s Property Crash...............................................................................85
5.2.1.5 2008 Property Crash.................................................................................85
5.2.1.6 Regional Variations..................................................................................86
5.2.1.7 Northern Ireland.......................................................................................86
5.2.1.8 Housing Tenure........................................................................................88
5.2.2 Republic Of Ireland Property Prices...............................................................88
5.2.3 Property Repossessions...................................................................................90
5.2.4 Northern Ireland Buy To Let Market.............................................................91
5.2.4.1 Tenure......................................................................................................91
5.2.4.2 Rental Incomes.........................................................................................92
5.2.4.3 Estate Agent Fees.............................................................................92
5.2.4.4 Londonderry/Derry................................................................................92
5.3 Alternative Investment Opportunities................................................................93
5.3.1 Commercial Property..................................................................................93
5.3.2 Cash Deposit Accounts and Interest Rates..................................................94
5.3.3 Comparison Of Stock Market and Shares versus Property.........................94
5.3.4 Bonds and Gilts......................................................................................96
5.3.5 Precious Metals......................................................................................97
5.4 Political Factors..................................................................................................97
5.4.1 UK Tax Reforms.........................................................................................97
5.4.2 Republic Of Ireland Taxation......................................................................97
5.4.3 Limited Company........................................................................................98
5.4.4 Brexit...........................................................................................................98
5.4.5 Political Party Changes.................................................................................100
CHAPTER 6: CONCLUSION................................................................................101
CHAPTER 7: PERSONAL DEVELOPMENT/STATEMENT................................104
REFERENCES...........................................................................................................105
8
Document Page
LIST OF FIGURES
Figure 1 Line Graphs To Demonstrate Unemployment Change In Major Recessions25
Figure 2 Line Graph To Demonstrate UK Unemployment Rate From 1972-2012.....26
Figure 3 Line Graph To Demonstrate Recovery Rates From Different UK Recessions
......................................................................................................................................27
Figure 4Line Graph To Demonstrate Unemployment In Ireland 1960-2017..............34
Figure 5Line Graph To Demonstrate Government Debt And Interest 1982-2017......35
Figure 6 Bar Chart and Line Graph To Demonstrate USA Subprime Volume and
Share 1994-2007..........................................................................................................37
Figure 7 Chart To Demonstrate Layers of the Business Environment........................46
Figure 8 Area Graph To Demonstrate UK House Prices Since 1952..........................49
Figure 9 Area Graph To Demonstrate UK House Price % Change Growth 1993-2015
......................................................................................................................................50
Figure 10Line Graph To Demonstrate Real UK House Prices 1975-2015..................50
Figure 11 Line Graph To Demonstrate UK Average House Price To Earnings Ratio
1954-2014....................................................................................................................51
Figure 12 Line Graph To Demonstrate UK Average House Price To Earnings Ratio
1986-2016....................................................................................................................52
Figure 13 Line Graph To Demonstrate Consumer Price Index CPI and Rent CPI
2005-2016....................................................................................................................52
Figure 14Bar Chart To Demonstrate UK Regional House Prices in 2015..................53
Figure 15 Line Graphs To Compare London and Northern Ireland House Prices From
2005-2015....................................................................................................................56
Figure 16 Line Graphs To Compare London and Northern Ireland House Prices From
2005-2015....................................................................................................................56
Figure 17 Line Graphs To Compare Northern Ireland, Republic of Ireland and UK
Residential Property Prices 2005-2015........................................................................57
Figure 18 Bar Chart To Demonstrate UK Trends in Tenure From 1918 to 2014........58
Figure 19 Line Graphs To Demonstrate Proportion Of Local Authority Dwellings In
The Different Countries Of The UK 1991-2007..........................................................59
Figure 20 Line Graphs To Demonstrate UK Home Ownership By Age Group..........59
Figure 21 Line Graphs To Demonstrate Trends in UK House Building 1949-2013...60
Figure 22 Area Chart To Demonstrate House Prices in Republic Of Ireland 1975-2016
......................................................................................................................................61
Figure 23 Bar Chart To Demonstrate House Building In Republic Of Ireland 1991-
2015..............................................................................................................................61
Figure 24 Line Graphs To Demonstrate Ratio Of House Prices To Income and House
Completions in Republic Of Ireland 1985-2015..........................................................62
Figure 25 Line Graphs To Demonstrate USA Delinquency and Foreclosure Rates
1990-2016....................................................................................................................62
Figure 26 Bar Chart To Demonstrate Number of UK Repossessions 1988-2012.......63
Figure 27 Map Chart To Demonstrate Northern Ireland Repossessions By Council
District 2005-2011.......................................................................................................65
Figure 28Line Graph To Demonstrate Number Of Repossessions in Republic Of
Ireland 2012-2015........................................................................................................67
Figure 29 Line Graph To Demonstrate Bank Of England Base Rate 1985-2017........68
Figure 30 Line Graphs To Demonstrate UK Base, Bank and Mortgage Interest Rates
1980-2014....................................................................................................................68
Figure 31 Line Graphs To Demonstrate Base Rates and Inflation in UK 2003-2017. 69
9
Document Page
Figure 32 Line Graph To Demonstrate ECB European Central Bank Interest Rates
1999-2017....................................................................................................................69
Figure 33 Line Graphs To Demonstrate Irish Interest Rates For Housing Loans 2003-
2016..............................................................................................................................70
Figure 34 Line Graph To Demonstrate US House Prices Since 1900.........................71
Figure 35 Line Graph To Demonstrate Inflation Adjusted US House Prices Since
1900..............................................................................................................................72
Figure 36 Line Graphs To Demonstrate USA Federal Housing Finance Agency House
Price Changes 1991-2015............................................................................................73
Figure 37Line Graphs To Demonstrate US Housing vs Stock Market Appreciation
1900-2010....................................................................................................................74
Figure 38 Bar Chart To Demonstrate Components Of 50 Year US Stock Market
Return 1920-1960.........................................................................................................75
Figure 39 Line Graph To Demonstrate Long Term Trend FTSE All Share 1920-2013
......................................................................................................................................75
Figure 40 Line Graph To Demonstrate Growth In The UK FTSE All Share 1946-2013
......................................................................................................................................76
Figure 41 Line Graph To Demonstrate Growth In The UK FTSE 100 Index 1984-
2013..............................................................................................................................76
Figure 42 Line Graphs To Demonstrate Real Growth In The UK FTSE 100 Index
1988-2013....................................................................................................................77
Figure 43 Line Graphs To Demonstrate Appreciation In UK Property and Stock
Market 1985-2015........................................................................................................78
Figure 44 Line Graph To Demonstrate UK FTSE PE Price to Earnings Ratio 1993-
2017..............................................................................................................................79
Figure 45 Line Graphs To Demonstrate Comparison Between UK Stock Market
(FTSE100), US Stock Market (S&P 500) and Gold 1984-2015..................................79
10

Paraphrase This Document

Need a fresh take? Get an instant paraphrase of this document with our AI Paraphraser
Document Page
LIST OF TABLES
Table 1 To Show Historical USA Business Cycles and Recessions Since 1882.........18
Table 2 To Show The Main Recessions Affecting The UK........................................22
Table 3 To Show Relative Income Per Capita of European Countries........................29
Table 4 Summary of Major UK Tax Changes Post Crisis...........................................32
Table 5 Summaries Key Forces That Influence Business in the Macro-environment.46
Table 6 To Demonstrate UK Regional Changes In House Prices In 2008 Recession. 54
Table 7 Line Graphs To Demonstrate Regional House Price To Earnings Ratios 2000-
2015..............................................................................................................................55
Table 8 To Demonstrate Number Of UK Buy To Let and Owner Occupied
Repossessions 2008-2016............................................................................................63
Table 9 To Demonstrate Northern Ireland Property Repossessions Completed By
Council District 2007-2016..........................................................................................65
Table 10 To Compare UK Share and Property Return 1985-2014..............................77
Table 11 To Compare UK Share and Property Return 2000-2014..............................78
11
Document Page
LIST OF ABBREVIATIONS
CAPE Cyclical Adjusted Price to Earnings Ratio
CPI Consumer Price Index
DIS Deferred Interest Scheme
DUP Democratic Unionist Party
ERM European Exchange Rate Mechanism
FDIC Federal Deposit Insurance Corporation
Fed Federal Reserve System
FICO score Fair, Isaac and Company
FOMC Federal Open Market Committee
FSCS Financial Services Compensation Scheme
GDP Gross Domestic Profit
HMMS Homeowner Mortgages Support System
HMO House of Multiple Occupancy
IMF International Monetary Fund
ISA Individual Savings Account
LTV Loan to value ratio
LVR Loan to value ratio
MARP Mortgage Arrears Resolution Process
MBS Mortgage Backed Securities
MPC Monetary Policy Committee
MSCI Morgan Stanley Capital International
NBER National Bureau Of Economic Research
OECD Organisation For Economic Co-operation and Development
RIC Royal Irish Constabulary
RGDP Real Gross Domestic Product
P/E Price- Earnings ratio
PRSI Pay Associated Social Insurance
UK United Kingdom
US United States
USA United States of America
USC Universal Social Charge
WTO World Trade Organisation
12
Document Page
CHAPTER 1: INTRODUCTION
1.1 Background of the study
Recession can be defined as a cyclical contraction, which in turn, results in
economic slowdown. It negatively affects economy and often occur due to widespread
decline in the spending level. Recessions cause misery for many including those who
become unemployed or bankrupt but they provide opportunities for savvy investors
looking for high returns (Farrow, 2009). High quality impartial financial advice is
invaluable but difficult to resource. Moreover, financial advisors only give advice on
products they are marketing rather than general advice (Reddan, 2017). These
products have similar risks to direct investments but less reward as commission is
subtracted.
Asset managers can take 5-10% commission per year or a generous fixed
hourly fee of approximately £120/hour for offering generic advice to diversify risk
into a range of different products including shares, residential property, commercial
property, overseas property, domestic property and bonds (Dunkley, 2014).
Furthermore, there are additional transaction and management fees.
Estate agents are usually only prepared to give advice regarding purchases in
the limited territory where they practice which is usually a town and the immediate
surrounding area or a subsection of a larger city. Moreover, they are reluctant to give
definitive advice as they understand that they cannot accurately forecast the future.
1.2 Aim
The purpose of this research was to evaluate previous recessions and critically
analyse the 2008 Financial Crisis to consider patterns and opportunities for
investment business opportunities in 2017.
1.3 Overview and relevance of past literature
Economic downturns and recessions occur on a cyclical basis and present
business opportunities. This research has evaluated historical recessions and then
critically analysed the contributory causes, magnitude, recovery and remedies of the
2008 Financial Crises. Business investment strategies and opportunities have been
explored in 2017.
13

Secure Best Marks with AI Grader

Need help grading? Try our AI Grader for instant feedback on your assignments.
Document Page
1.4 Objectives
The primary aim of the research is to examine previous recessions and
critically analyse the 2008 Financial Crises in order to identify investment business
opportunities. This aim will be achieved by examining previous recessions to identify
patterns, critically analysing the 2008 Financial Crisis and investment opportunities in
2017. The primary aim will be accomplished by achieving several research objectives
which are outlined below.
To review previous recessions and identify patterns.
To critically analyse the causes, effects, remedies and recovery of the 2008
Financial Crisis.
To identify strategic investment business opportunities which have occurred as
a result of the 2008 Financial Crisis.
To review and analyse regional property markets.
To evaluate alternative opportunity investment strategies.
To consider macroeconomic and other factors to determine an optimal
business strategy.
To determine the strengths, weaknesses, opportunities and threats of the
proposed business investment strategy.
1.5 Methodology Overview
Selecting the best research methodology is important since it will determine
the results and outcomes. An empirical strategy has been used with phenomenological
inductive orientation. An inductive approach was adopted to provide the flexibility to
allow consideration of all investment opportunities as directed by the data and
information. Secondary data was collected from a range of sources including
journals/academic publications, business press, media, local and National
Government Organisations. An analytical approach was utilised to evaluate both
secondary quantitative data and qualitative information which has been processed to
make conclusions and recommendations.
1.6 Scope
The research depends in the main on secondary data and information due to
limitations of time and finance resources. The markets and economies in the UK and
Republic Of Ireland are analysed as these are most relevant to the author’s
14
Document Page
circumstances but the USA as the World lead economy has been considered for
comparison purposes.
1.7 Structure of the Report
The report is divided into 5 main chapters. A brief description of these
chapters is given below:
Chapter 1: Introduction
This chapter gives a quick overview about the aim and purpose of the
research, why there is need for research and a framework for the analysis and
outcomes. The background of the research topic is included in the first chapter.
Chapter 2: Literature Review
This has given detailed information about the research topic. Critical analysis
has been done of the literature from books, journals and internet sources.
Chapter 3: Research Methodologies
This chapter focuses on different approaches of research methodologies and
tools that can be used by the researcher. Primary and secondary data types and
different models are analysed. A final research strategy is selected in this chapter.
Chapter 4: Data Analysis
This chapter analyses the secondary quantitative data of the results in the form
of tables, line graphs, area charts, map charts and bar charts.
Chapter 5: Discussion
The data is processed into information and critically analysed. Macro
environmental and other factors are reviewed
Chapter 6: Conclusions
The research and its findings have been drawn together to develop conclusions
in this chapter and recommendations are made.
1.8 Conclusion
Recessions often present business opportunities. The literature review of the
2008 Financial Crisis compared it to previous recessions and provided additional
information to clarify the direction and subject areas for further research to be
undertaken. The literature review included the USA because as the lead economy it
influences the world economy and it is where the 2008 Financial Crisis originated.
The Republic of Ireland and the UK are reviewed as they are most relevant to the
author’s circumstances.
15
Document Page
CHAPTER 2: LITERATURE REVIEW
2.1 Introduction
In this chapter an overview of how recessions and financial crises have been
defined and characterised is given. The internet search engines including the Arden
university discovery service search engine which has EBSCO access were used to
access information. The library was used to comprehensively search secondary
sources including electronic databases, electronic journals, electronic books and
newspaper articles.
Literature relevant to previous recessions in the Republic of Ireland, UK and
USA were discussed to determine the causative factors, consequences, remedies and
business opportunities in order to compare with the recent recession and establish
patterns. The causes, consequences and recovery of the 2008 Financial Crisis are
critically analysed in order to identify business opportunities.
2.2 Definition of Recession and Financial Crisis
2.2.1 Recession
Recession is defined (Oxford, 2017a) “as a period of temporary economic
decline during which trade and industry activity are reduced, generally identified as a
fall of GDP in two successive quarters”.
2.2.2 Depression
A depression is less clearly defined but is a more significant economic
downturn than a recession. One definition includes a decline of real GDP exceeding
10% (Economist, 2008) or a recession lasting 2 or more years (Businesscycles, 2017).
Other definitions vary the durations and how the duration is defined from either the
end of the decline or close to baseline levels of recovery (NBER, 2012).
Depression can also be defined as a substantial and sustained shortfall of the
ability to purchase goods relative to the amount using current resources and
technology (Columbia, 2012).
2.2.3 Financial Crisis
A financial crisis could be defined in different ways. Eichengreen and Bordo
(2002, p.62) define a financial crisis “For an episode to qualify as a banking crisis, we
16

Paraphrase This Document

Need a fresh take? Get an instant paraphrase of this document with our AI Paraphraser
Document Page
must observe either bank runs, widespread bank failures and the suspension of
convertibility of deposits into currency such that the latter circulates at a premium
relative to deposits (a banking panic), or significant banking sector problems
(including but not limited to bank failures) resulting in the erosion of most or all of
banking system collateral that are resolved by a fiscally underwritten bank
restructuring.”
Moreover, publications by the IMF (2009), Reinhart and Roghoff (2009b)
have discussed that financial crises usually induce a sharp recession which lasts for
approximately 2 years. Furthermore, the consequences are that recovery and
deleveraging of debt is delayed because consumption, private investment and credit
flows are slow to improve. Further, they demonstrate that unemployment continues to
rise after the economy has started to grow.
2.2.4 Challenges in The Application of Definitions
These definitions have limitations as significant downturns may not be
included in each of the definitions. Using this definition for a recession the USA
recession of 1914 would be excluded even though bond markets were closed.
Moreover, the 1945 crisis would be excluded despite being the second deepest
recession of the 20th century behind the Great Depression and associated with a very
weak recovery.
Barro and Jin (2011) defined the 4 GDP disasters in the USA being those with
troughs in 1914, 1921, 1933 and 1947. Reinhart and Roghoff (2009a) included 23 of
the 27 (table 1) cycles discussed here as financial crisis excluding 1899, 1923, 1953
and 1960.
2.3 Historical USA Recessions
It had been noted by Freidman and Swartz (1963) that a large contraction was
followed by a large expansion and a mild contraction by a mild expansion.
Furthermore, Zarnowitz (1992) discussed how the pre World War II recessions which
were associated with banking panics were more severe than average and followed by
rapid recoveries.
Bordo and Haubrich (2017) discuss the pattern and speed of recovery
comparing the United States recessions since 1882. The financial crises prior to the
Federal Deposit Insurance Corporation (FDIC) in 1934 were banking panics caused
17
Document Page
by a desire for liquidity and usually were short lived lasting months. Moreover, since
1934 financial crises have tended to be insolvency related, lasting years, requiring
government and FDIC intervention.
Table 1 To Show Historical USA Business Cycles and Recessions Since 1882
Peak Trough Crisis
Date
Contractio
n
RDP
Change
Recover
y
RDP
Change
Contraction
%
Recovery
%
March
1882
May
1885
June
1884
2.59 5.14 3.15 6.25
March
1887
April
1888
No -3.36 2.32 -3.75 2.70
July 1890 May
1891
No -1.03 13.27 -1.05 13.72
January
1893
June
1894
May
1893
-12.38 17.21 -11.09 17.33
Decembe
r 1895
June1897 October
1896
1.67 4.86 1.41 4.04
June
1899
Decembe
r 1900
No 2.92 15.39 2.10 10.88
Septembe
r 1902
August
1904
No 3.34 31.37 2.09 19.23
May
1907
June
1908
October
1907
-24.13 23.54 -11.82 13.08
January
1910
January
1912
No -7.71 11.55 3.61 5.22
January
1913
Decembe
r 1914
August
1914
-19.38 24.28 -8.33 11.39
August
1918
March
1919
No -28.86 43.67 -8.34 -16.66
January
1920
July
1921
No -7.66 33.28 -3.42 15.39
May July No -13.99 12.32 5.43 4.54
18
Document Page
1923 1924
October
1926
Novembe
r 1927
No -3.78 26.84 -1.26 9.08
August
1929
March
1933
October
1930
-99.95 87.64 -31.60 40.51
May
1937
June
1938
No -21.96 27.52 -6.96 9.37
February
1945
October
1945
No -122.94 -49.97 -19.25 9.69
Novembe
r 1948
October
1949
No -3.86 40.02 0.81 8.36
July 1953 May
1954
No -15.96 48.43 -2.53 7.88
August
1957
April
1958
No -21.95 46.31 -3.15 6.86
April
1960
February
1961
No -4.04 42.22 -0.54 5.62
Decembe
r 1969
Novembe
r 1970
No -1.80 50.50 -0.16 4.45
Novembe
r 1973
March
1975
1973-
1975
-42.00 88.90 -3.18 6.96
January
1980
July
1980
No -35.10 61.00 -2.23 3.96
July 1981 Novembe
r 1982
1982-
1984
-42.40 153.42 -2.64 9.81
July 1990 March
1991
1988-
1991
-29.09 23.25 -1.36 1.10
March
2001
Novembe
r 2001
No -21.92 57.71 0.73 1.90
Decembe
r 2007
June
2009
Septembe
r 2008
Notes Related To Table 1
19

Secure Best Marks with AI Grader

Need help grading? Try our AI Grader for instant feedback on your assignments.
Document Page
Calculations are based on Bordo and Haubrich (2010), Balke and Gordon (1986),
Eichengren and Bordo (2002), Lopez-Salido and Nelson (2010), Gordon and Tallman
(2016), Wikipedia(a).
The dates used are based on those ascertained by the National Bureau of
Economic Research (NBER). RGDP is in 1972 US$. Recoveries by duration of
contraction after the trough.
NBER identifies 11 business cycles from 1880-1913 in the period before the
Federal Reserve when the United States was using the Gold Standard as it did not
have a central bank. In essence, three were financial crises (1882-1887, 1893-1894,
1907-1908) and in all three the recovery was faster than the downturn. These were
similar themes to the recent financial crisis in that banking runs and subsequent
failures were due to institutions having a low ratio of capital to risk. Moreover, there
was reckless lending and external intervention by government or private syndicates
was required.
Wicker (2000) was of the opinion the 1882-1885 Recession was due to a
banking panic and stock market crash after the collapse of a brokerage firm Grant and
Ward in May 1884. Moreover, the banking crisis was subsequently resolved by the
issuing of clearing house loan certificates. Further it was stated by Walton (1997) that
US treasury quasi-central government intervention with capital and gold inflows
assisted the recovery.
According to Timberlake (1997) the US economy was under deflationary
pressure by falling gold prices with uncertainty about silver and the 3 May 1893 stock
market crash precipitated a banking panic. This was managed by issuing of loan
certificates and the suspension of withdrawals from bank deposits and The Belmont
Morgan syndicate assisted in the 1894-1895 recovery to rescue the US treasury gold
reserves from a silver induced run.
It was contended by Bruner (2009) that the stock market crash and banking
panic of October 1907 was induced by a run on small trust banks which had minimal
cash reserves. The crisis was resolved by injection of money by the government into
New York banks and by JP Morgan purchasing city bonds. Freidman and Schwartz
(1963) discussed how the onset of World War I in 1914 resulted in a banking crises
and recession. Moreover, Silber (2007) consider how The Federal Reserve was
formed in 1914 in response to avoid or minimise further banking crises.
20
Document Page
From the period 1914-1945 there were 3 severe business cycle downturns and several
minor cycles. Most of the recoveries were at least as rapid as the downturns with the
exception being the Great Contraction of 1929 to 1933.
The Great Depression started in August 1929 and the major stock market crash
in October 1929 resulted in a downturn with several banking panics (Hamilton, 1987).
The consensus among most economists is that the Great Depression could have been
avoided by policy changes after the downturn. Fundamentally, The Fed failed to
counter the contraction in the money supply causing prices to fall by 25% and bank
runs resulting in thousands of banks failing. In contrast during the 2008 Financial
Crisis there has been an aggressive policy to stimulate the economy.
There have been many comparisons between the 2008 Financial Crises and
events in the 1930s and the onsets were similar but the Great Depression had a
relatively drastic effect on the economy as GDP was reduced by 27% from 1929 to
1933 and unemployment increased from 3.2% to 25.2% (Lamont, 2010). In terms of
GDP and unemployment the recent recession was rather more similar to the
recessions since 1945.
Roesch (1975) demonstrates how since 1945 there have been fewer stock
market crashes, recessions have generally been shorter and recoveries longer. In this
regards there were only 4 periods that met the definition of financial crises during this
time period. Furthermore, the two longest and deepest of were in 1973 and 1981.
However, the Fed was reluctant to stimulate interest rates despite inflation being
much higher than in the recent recession. In common with the 2008 Financial Crisis
there were significant increases in oil prices at the start of these recessions.
Fundamentally, the 1973 Recession was mainly caused by quadrupling of oil
prices during the ‘First Oil Shock’, unfortunately controls on wage prices prevented
adjustments and unemployment increased to 8.6% (Lopez-Salido and Nelson, 2010).
Moreover, it was exacerbated by the minor banking crisis which resulted in Franklin
National Bank failing and the in debt German Herstatt Bank stressing other banks
when it was liquidated. However, The Federal Open Market Committee (FOMC)
intervened by increasing money aggregates resulting in a relatively rapid recovery
which began in April 1975 (Roesch, 1975).
According to Lopez-Salido and Nelson (2010) the 1981 Recession to the Fed
Central Bank was contributed by the interest rate increase from 14.7% to 19.1%
between March and June 1981 in an attempt to reduce inflation. Consequently,
21
Document Page
inflation was reduced from 10% in 1981 to 4% in 1983 but at the cost of
unemployment which increasing from 7.2% to 10.8% with a subsequent 3% fall of
GDP. Moreover, the collapse of oil prices and the Latin America Debt Crisis
contributed to the banking crisis which required bail outs for Penn Square Bank in
1982 and Continental Illinois in 1984. Therefore, the Fed had to take measures and
policies of easing to prevent widespread defaults.
Comparably the 1991 and 2001 recessions were mild and brief although there
was high and increasing unemployment during the recoveries. Lopez-Salido and
Nelson (2010) posit that deregulation and careless real estate lending contributed to
the savings and loan crisis from 1988-1991 resulting in many savings and loan
associations ‘thrifts’ being liquidated. The 1991 Recession was attributed to The
Federal Open Market Committee (FOMC) cutting the funding rates in November
1990 in order to reduce inflation from 6.1%. Hence unemployment increased peaking
at 7.75% in June 1992 and house prices subsequently fell by approximately 13%.
Labonte (2010) demonstrated that in all recessions since 1945 residential
investment fell relatively more than business investment and occurred before the
decline in GDP. Moreover, he was of the opinion this was due to its sensitivity to
tightening of credit conditions. Furthermore, the recent depression was the only
recession since 1945 to affect house prices which fell by 15% in contrast to residential
investment which fell by more than 50%.
2.4 Historical UK Recessions
Table 2 To Show The Main Recessions Affecting The UK
Name and Dates %Real
GDP
Chang
e
Causes Additional Information
(Wikipedia b)
Post Napolean
Depression
(Caine and
Hopkins2003)
Post war readjustment
22

Paraphrase This Document

Need a fresh take? Get an instant paraphrase of this document with our AI Paraphraser
Document Page
1857-1858
Recession
CGLAa
-1 Panic of 1857 Approx 3.5% nominal GDP
Brief
1867-1869
Recession
CGLAb
-1 American recession
post civil war affect on
exports
1.9% fall of GDP
Long Depression
1873-1896
none Panic of 1873
(Investopedia)
Deflation but no GDP
reduction
Agriculture affected most
Worldwide but UK affected
more
1919-1921
Depression
-9.5 After World War 1 %GDP -10.9 in 1919, -6 in
1920, -8.1 in 1921.
Deflation 10% in 1921 and
14% in 1922
Great Depression
1930-1931
-5.1
1931
US Depression
affected exports UK
came off gold standard
3-5% deflation per annum,
UK affected less than US,
took 16 quarters to recover
1956 Recession Uncompetitive motor
industry
Inflation was 4.9%, interest
rates 5.5%
1961 Recession -0.5 Knock on from US
recession,
Bank rate 7% in 1961,
increase of 2%
Mid 1970s
Recession, 1973-
1975
-2.7 1973 oil crisis,
stagflation, inefficient
industry, pay strikes
Inflation varied 9-24.2%,
interest rates 9-15% (ONSa)
Early 1980s
Recession 1980-
1981
-2 Deflationary policies,
monetarism to reduce
inflation
High unemployment 11.9%
in 1984, switch to services
economy
Early 1990s
Recession
1990-1991
-1.1 US saving and loan
crisis, inflation 9.5%,
interest 14.8%
Increasing unemployment
10.7% 1993, budget deficit
of 8 GDP%(ONSb)
23
Document Page
The financial crises in the second half of the 17th Century and early 18th
Century were (Hoppit, 1986) caused by the private sector, funded by credit and based
on speculative activity, similar issues to recur in subsequent crisis.
The Bank Of England adopted the role of a central bank during the second half
of the 19th Century period, adjusting interest rates and supplying money to prevent
banking crisis (Capie and Wood, 1997). The economy had increasing international
trade during this period and thus was relatively more affected by global events
especially in the USA. The 1857-8 Recession was considered the first worldwide
recession. It was contended by Musson (1959) that the 1873-1896 Recession ‘The
Long Depression’ affected the UK as the lead European country relatively more than
other countries.
According to Dow (1998) reduced government spending after the end of the
First World War was a significant contributory factor to the 1919-1921 Depression.
Moreover, the UK returned to the Gold Standard making exports more expensive with
consequently reduced demand. Furthermore, trade was slow to re-establish after the
war and there were compensatory demands placed on Germany reducing its demand
for imports. Therefore unemployment rates increased to more than 10%.
It was posited by Pettinger (2012) that the government policy of deflationary
contractionary austerity fiscal policy along with the tight monetary policy and a fixed
exchange rate had failed to reduce national debt. The understanding of the concept
that austerity and spending cuts can be counterproductive was considered to have
influenced policies in subsequent recessions.
The 1930-31 Recession ‘The Great Depression’ was relatively less significant
in the UK as it had not experienced the 1920s boom of the USA and Germany.
Manufacturing output fell by 11% which was relatively less than other countries as
world manufacturing production fell by 29%. Middleton (2010) noted that deflation
discouraged spending and higher import and export tariffs resulted in reduced trading.
Unfortunately, unemployment increased to 22%, the manufacturing areas of the UK
were most affected including Wales and the Northern regions of England. Richardson
(1970) was of the opinion the depression was imported into UK by balance of
payment effects.
It was noted by Dow (1998) that the 1931 budget increased taxes and reduced
social security payments resulting in the public having less disposable income.
24
Document Page
Further it was stated by Turner (1991) that the recovery was aided by demand in
domestic consumption, investment in residential construction, industrial investment
and later rearmament, in preparation for World War II. Fiscal policy was considered
to have a minimal contribution to the economic recovery. However, interest rates
were initially high at 5-6% to reassure markets but the Gold standard was suspended
in the UK in late 1931. Moreover, the subsequent decrease in interest rates in 1932
and 20% depreciation of the currency assisted the recovery in a similar way to the
2008 Financial Crisis.
In terms of GDP and economic changes the recent 2008 recession in the UK
has been more comparable to the recessions of the 1970s and 1980s (Kirby et al,
2015). However, the most significant difference has been the lower unemployment
rates which have been 8% compared to 12% and 10% for the mid 1980s and early
1990s respectively (Elliot, 2015).
Figure 1 Line Graphs To Demonstrate Unemployment Change In Major Recessions
(Source: Economics Help, 2010)
25

Secure Best Marks with AI Grader

Need help grading? Try our AI Grader for instant feedback on your assignments.
Document Page
Figure 2 Line Graph To Demonstrate UK Unemployment Rate From 1972-2012
(Source: Pettinger, 2013)
The 1973-1974 Recession was a global recession caused by the ‘oil price
shock’. It was the opinion of Elliot (2012) that the UK was affected relatively more
than similar economies because of domestic industrial disputes such as miner strikes
and high inflation.
The 1980-1982 Recession was regarded by Hill et al (2010) to be caused by
the government monetary policies to increase interest rates to reduce inflation, with
tightened fiscal policy of increased taxes and restricted government spending.
The 1990-1992 Recession was caused by high interest rates, falling house
prices and lower consumer spending after the relative boom from 1986-1990. Thus,
the government was forced to decrease interest rates to reduce inflation despite having
joined the ERM (Hill et al, 2010).
26
Document Page
Figure 3 Line Graph To Demonstrate Recovery Rates From Different UK Recessions
(Source: NIESR, 2014)
The recession with the greatest fall of GDP was the 1920-1924, in contrast the
1990-1993 and 1973-1976 Recessions had the lowest falls of GDP. The rate of
recovery is much slower from the 2008 Financial Crisis than all the previous
recessions.
2.5 Historical Irish Recessions
The country was relatively poor by European standards until the 1960s with
parallels to recent economic austerity. The economy has maintained strong ties with
the United Kingdom since gaining independence in 1922 and barriers to trade whether
through domestic dispute or by an EU imposed border or tariffs have been or have the
potential to be detrimental. There has been a recurrent theme of failed economic
policies with high government debt, poor economic growth, high taxation, high
unemployment, high emigration, reduced civil servant or public sector pay requiring
external intervention and ‘bail outs’.
It had been reported by Dorney (2011) that the 1922-1923 Recession was a
result of the civil war. Further it was stated by Hopkinson (2010) that the cost of the
war was estimated to be approximately £47 million which was 170% of national
income. In the early years of The Republic the Irish banks headquarters were in
London, they were reluctant to lend to their own government due to concerns that the
country may collapse and fail (Prendeville, 1932). Therefore, British civil servants
27
Document Page
were drafted to manage the Irish Department Of Finance reducing the government
expenditure from £42 to £28 million in 3 years from 1923 to 1926 with measures
which included reducing civil servants wages. The Republic Of Ireland agreed in
1925 to give up its territorial claims to Northern Ireland (Dail, 1925) to be relieved of
its UK debt.
Dunphy (1995) highlighted that in 1932 wealth was not evenly distributed, 1%
owned 9% of wealth, 11% owned 69% and 21% owned 100%, therefore 79% had no
assets and were living on the bare subsistence level. Consequently 75,000 Irish
citizens emigrated annually in the late 1930s.
The Irish and Northern Irish economies suffered significantly from the Anglo-
Irish trade war which started in 1932 and lasted until 1938 (BBC, 2017). In essence,
Britain imposed a 20% import duty and livestock quotas as a penalty for unpaid loans,
Ireland responded by imposing import duties on British goods (Emergency imposition
of duties order, 1932). Moreover, 90% of Irish agriculture exports went to Britain and
Ireland was dependant on Britain for coal imports. Furthermore, it was stated by
O’Rouke (1991) that the Irish economy lost £48,000,000 and almost collapsed. Hence
unemployment increased from 29,000 to 138,000 from 1931 to 1935 with an increase
in emigration.
Dunphy (1995) considers how an ineffective policy of low spending and low
taxation was adopted and continued unsuccessfully by the Fianna Fail party into the
1950s resulting in poor growth. Lee (1989) outlines the situation of the dire state of
the economy at that time reporting that a bail out loan of £36 million Marshal aid at
an interest rate of 2%. Irish income per capita was one of the highest in Western
Europe when the country gained independence from the United Kingdom in 1922 and
then dropped behind in the 1950s.
28

Paraphrase This Document

Need a fresh take? Get an instant paraphrase of this document with our AI Paraphraser
Document Page
Table 3 To Show Relative Income Per Capita of European Countries
According to McLaughlin (2001), in the 1950s the growth rate was only 1% in
contrast to the other European countries which were growing by 8% per year on
average. Therefore, there was little investment in infrastructure, public services,
health, education or welfare, in comparison to other European countries with similar
sized economies such as Denmark (Lee, 1989). Thus emigration continued at a rate of
40,000 persons per year, reducing the population to 2.81 million.
It had been posited by Donnelly (2013) that the government reversed
protectionist policies, dropped tariffs and introduced tax incentives for foreign
companies to encourage investment which resulted in growth doubling to 4% from the
1960s.
According to Duff (2003) the 1970s and 1980s policies of increased public
spending failed as growth decreased to 1.9% and taxes increased up to 80% in 1975.
It was noted by Whelan (2013) that by the 1980s the public debt GDP ratio was over
110% and taxes were again high at 65% in 1985, with stagnant growth, high
unemployment reaching 17% and high emigration. O’Connor (2010) contended that
many of the multinational companies which had received significant government
grants in the 1970s left the country in the 1980s during the recession and that the
global effects of the oil shocks exacerbated domestic problems.
29
Document Page
2.6 2008 Financial Crisis USA
The USA has the largest economy in the world in terms of purchasing power
parity with $16.2 trillion in 2012 (Banks et al, 2014) and the highest GDP per capita
at $51,708. The recession started in December 2007 with the collapse of the housing
market reducing the value of mortgage backed securities hence the equity in the
banking system (Bordo and Haubrich, 2017). Moreover, in 2008 the US government
had to support mortgage backed securitised agencies Freddie Mac and Fannie May
and The Fed assisted the failing investment bank Bear Stearns in March 2008.
Furthermore, Lehman Brothers was in a similar situation in September 2008 but did
not receive assistance because the government wanted to prevent moral hazard. The
collapse of Lehman brothers was followed in a similar manner by Washington Mutual
Bank in the US, Northern Rock, Bradford and Bingley in the UK. Bordo and Landon-
Lane (2012) were of the opinion that this precipitated the liquidity panic. Heztel
(2012) posited that the tight monetary policy of the Fed in late 2007 and early 2008
was a significant contributory factor. Iyanatul and Sher (2011) contended that it was
the most severe recession since the Great Depression with RGDP decreased by 5%
and unemployment increased to 10.8%. Furthermore, what started off in the United
States subprime segment of the housing market spread, by mid 2008 the European
Union and Japan were in recession and by 2009 the world was in recession. Most
economic advisors and finance experts appear not to have been aware of the potential
for such a course of events despite evident warning signs.
Krugman (2009) is critical of his economist professional colleagues “blindness
to the very possibility of catastrophic failures in a market economy’. According to
Galbraith (2009) collusion and groupthink mentality by academics especially in the
prestigious American universities resulted in avoidance of alternative possibilities.
Bezemer (2009) indicated how 12 economists and analysts had predicted the
course of events based on the level of private debt. Moreover, he considers in
retrospect the ingredients were apparent which included the toxic mixture of large
deficits in the advanced economies such as United States and United Kingdom.
Furthermore, these were being financed by the savings of emerging economies and oil
exporting countries.
Immergluck (2009) was of the opinion that there were a number of
contributing factors which included risk taking behaviour, overemphasis on yield, lax
monetary policy and financial regulation. Turner (2009a) highlighted the
30
Document Page
underestimation of risk liability of the complex mortgage financed securities linked to
the United States housing market and the lack of liquidity. Moreover, he discusses
how the banking sector had become increasingly deregulated and credit had become
more readily available.
Government policy makers made efforts to avoid the mistakes made from
previous recessions by reducing interest rates, nationalising banks, injection of credit
into financial markets and increasing spending with a fiscal stimulus package. It was
the opinion of Weller (2012) that the $1 trillion stimulus package prevented a 1930s
type collapse of the banking system. Moreover, he noted how the financial markets,
economy and labour markets responded quickly to each measure.
However, Iyanatul and Sher (2011) consider The Federal Reserve’s monetary
policy which was to reduce rates from 5.25% in early in 2007 to close to zero in
January 2009 more beneficial. In their opinion the massive fiscal stimulus package
resulted in only moderate growth at approximately 2% well below the rate of
contraction.
2.7 2008 Financial Crisis UK
The UK is a relatively large European economy with a GDP per capita
favourable to the other G7 countries at $36,333. The UK’s economy was reduced by
5% from 2007 to 2009 and borrowing had increased significantly (Emmerson and
Tetlow, 2015). It had been indicated by Kirby et al (2015) that the severity of the
recession in terms of fall in GDP was similar to that seen in the early 1980s and
1970s, larger than the contraction in the 1990s but less than that of the 1920s and
1930s. According to Banks et al (2014) the contraction of real GDP by 7.2% was the
largest since the war and the greatest contraction was in the financial services sector
which contracted from 10% GDP at the peak to 6.8% at the end of 2013. The UK
economy was growing at an average rate of 5.4% for the decade prior to the 2007
recession which was favourable to the G7 average of 4.7%.
It was noted by Blundell et al (2014) that employment was much less affected
than previous recessions despite a relatively large fall in output. Moreover,
employment fell by 2.2%, compared to 9.3% in the 1980s and 3.6% in the 1990s.
Pessoa and Van Reenen (2014) demonstrated how the 16-29 years age group had the
greatest reduction in employment of 6%. Moreover, in the public sector below
inflation wage settlements have been imposed and in the private sector workers had
31

Secure Best Marks with AI Grader

Need help grading? Try our AI Grader for instant feedback on your assignments.
Document Page
agreed to wage reductions rather than risk redundancy. Furthermore, there was a
decrease in real wages relative to consumer price inflation by 10.2%.
Further it was stated by Riley and Chote (2014) how the devaluation of
sterling mitigated against pre-crisis predictions by assisting exports. The sterling euro
exchange dropped to 1.09 in January 2009 from 1.51 in January 2007 (Bank Of
England, 2009). Jones and Richardson (2014) reported how £134 billion had been
added to the economy by the government with 2 banks being nationalised, equity
being injected into other banks and loans given to the financial services industry to
help compensate savers.
Emmerson and Tetlow (2015) discuss how the incumbent labour government
had fiscally stimulated the economy by increasing social security payments, reducing
the VAT rate and increasing investment in capital projects. However, they consider
how the election of the conservative liberal democrat coalition government in 2010
resulted in relatively more significant tightening of the fiscal measures. Moreover,
Tetlow (2013) analysed the reduction of borrowing from a post war high of 10% GDP
and that most of the measures involved spending cuts rather than tax rises.
The Monetary Policy Committee of The Bank Of England reduced the base
rate of interest from 5.75% to 0.5% between December 2007 and March 2009.
Quantitative easing with £375 billion gilts being purchased by July 2012 also assisted
the recovery.
Barnett et al (2014) discussed how the rate of growth of the UK economy after
the 2008 Financial Crisis was relatively more affected than the USA and other
European countries. Grice described the recovery (Chan, 2015) as the sharpest
downturn and slowest recovery on record.
Table 4 Summary of Major UK Tax Changes Post Crisis
Tax Stream Measures Effect on
revenues as
%GDP 2015-
2016
VAT Increased from 17.5% to 20% +0.7
Social
insurance
contributions
Increase employee, employer and self employed
rates by 1%.
Increased contribution payments by employers who +0.8
32
Document Page
offer pension benefits
Social
insurance
contributions
Increase threshold at which employees and
employers start paying contributions
Abolish employer contributions for under-21s and
for apprentices under the age of 25
–0.5
Income tax New 45% top rate on incomes above £150,000 +0.9
Reduce limits for tax-free pension contributions
Reduce tax relief on pension contributions for those
on incomes above £150,000
Increase tax rate on dividend income by
7.5 percentage points
+0.9
Income tax Increase tax-free personal allowance
Make part of tax-free personal allowance
transferable between spouses
Reduce income tax rate on savings income and raise
annual limit for contributions to tax-favoured
savings vehicles
–0.8
Fuel duties Cut nominal duty rates –0.2
Corporation
tax and taxes
on North Sea
oil
companies
Reduce capital allowances and investment
allowances
Limit rate at which banks can offset losses
Increase supplementary charge on oil and gas
production (20% to 32%)
Introduce 8% corporation tax surcharge on banks
+0.4
Corporation
tax and taxes
on North Sea
oil
companies
Reduce main corporation tax rate from 28% to 18% –0.7
Net effect of all measures +1.0
Notes on Table 4
33
Document Page
(Source: Adams et al 2015, figure 1, Calculations based on Office for budget
responsibility’s policy measures database 2014)
The lower rate of corporation tax is an additional efficiency for low profit
businesses (Adam and Roantree, 2015), (Miller and Hope, 2015)
2.8 2008 Financial Crisis Republic Of Ireland
Honohan (2009) discussed how Ireland had extremes of expansion and
contraction from 2002-2012 in the global credit-liquidity crisis. The population had
increased by 17% between 1996 and 2006 (CSOe, 2017). This was a period of
economic prosperity know as the Celtic Tiger when the size of the economy doubled
and the number of people employed increased by 50% (McCarthy and McQuinn,
2017). Government debt was reduced from 110% GDP in 1987 to 25% in 2007
(Waldron and Redmond, 2014). Moreover, Ireland was the fastest growing economy
and second richest in terms of per capita. This period had been preceded by recession
in the 1980s when there was minimal growth, unemployment was at 16% and there
was high taxation (Kirby, 2010).
Figure 4Line Graph To Demonstrate Unemployment In Ireland 1960-2017
(Source: ECB, 2017)
34

Paraphrase This Document

Need a fresh take? Get an instant paraphrase of this document with our AI Paraphraser
Document Page
Figure 5Line Graph To Demonstrate Government Debt And Interest 1982-2017
(Source: Publicpolicy.ie, 2017)
Hardiman (2012) describes the economy in 2008 when unemployment had
risen from 4.6% to 6.1% and GDP was reduced by 3%. Moreover, Ireland was the
first Euro zone country to be declared to be in depression in September 2008 but had
been able to borrow credit for 4.3% in the international markets. Furthermore, the
Irish government agreed to secure and guarantee 440 billion euro of all the Irish banks
liabilities as a consequence the debt ratio increased from 28.75% to 49.6%. There was
a reduction in tax income of 6.4 billion euros and 2.9 billion euros increase in social
security payments. According to Hardiman and Regan (2013) the tax structure had
become reliant on stamp duty income generated from property purchases rather than
taxes on income or capital wealth.
Whelan (2011) considers how in 2009 the economic situation got worse,
income dropped by another 7% and interest rates almost doubled from 6.1% to 11.8%.
Tax revenues dropped by another 7.5 billion euros increasing borrowing to 13.9% of
GDP pushing the debt ratio to 64.8%.
In 2010 the economy contracted by 0.4% and unemployment increased to
13.7%. The 31 billion euro paid to the banking sector increased the government
budget deficit to 31.3% and the debt ratio to 98.5% (CPI Financial, 2010), the interest
rate of the deficit increased to 9.1%.
35
Document Page
Ireland was the first country to request a bail out on 21 November 2010 from
the troika of the European Commission, the IMF International Monetary Fund and
The European Central Bank. This was a 90 billion euro 3 year loan at 5.8% interest
which was 60% of Ireland’s GDP making the banking crisis a sovereign debt crisis
with increased taxes and reduced public sector wages. Gartner (2013) was of the
opinion that the November 2010 bailout was a result of guaranteeing the banks.
In 2011 although GDP growth was 1.2%, unemployment increased to 14.4%, the
government deficit increased to 13.4% pushing the debt ratio to 117.6%.
It was contended by Nyberg (2011) that the mortgage credit risk on the banks
to be the main reason for the financial crisis as there had been growing use of
derivatives to manage risk and mortgages securitisation since 2000. Kelly and Everett
(2004) highlight the easing of credit during this prosperous period when the Irish
credit markets were liberalised. Moreover, Girouard (2006) describes how this was
eased further in 2003 when there was greater access to international wholesale
markets.
O’Connell (2005) regarded that the factors which contributed to property price
increases were the absence of capital gains tax on owner occupied property, absence
of property tax until 2013, grant aid and tenant purchase schemes. Furthermore,
Kitchen (2010) considers additional factors which contributed to the building boom of
new properties such as excessive zoning of land for residential building purposes,
local politicians and planning offices having significant power with the discretion to
pass planning permission.
2.9 Mortgage Lending And The 2008 Financial Crisis
According to Duka (2014) subprime mortgages were defaulting in 2006 as a
consequence of falling house prices. Moreover, these subprime mortgages had been
securitised into bonds and sold on the international market as Mortgage Backed
Securities (MBS). Furthermore, this market started to decline in 2007 and later closed
therefore banks were unable to refinance their mortgages when they came to maturity.
Hence banks reliant on these had difficulties with liquidity including Northern Rock
in the UK and Bears Sterns in the USA.
It was noted by Capozza and Van Order (2011) that subprime lending was a
more established and scientific process in the USA where mortgages were
underwritten and priced on the basis of credit scores (FICO), loan to value ratios
36
Document Page
(LVRs) and performance history. Further, it was stated that MBS use increased 4 fold
from the mid 1990s to raise capital. Crosby (2008) discusses how the US and UK
amounts were $4600billion and $500billion respectively, accounting for 70% and
7.5% of global totals. Moreover, in the USA these were usually used for publicly
insured mortgages initially with conservative lending criteria, this further expanded to
include subprime mortgages which constituted 33% of these bonds in 2005. Figure 1
demonstrates that 20% US mortgages were subprime in 2005.
Figure 6 Bar Chart and Line Graph To Demonstrate USA Subprime Volume and
Share 1994-2007
(Source: Jaffee, 2008)
It was noted by Depkin et al (2012) how in the USA the number of subprime
mortgages in arrears or foreclosure doubled in 2006 from 5% to 10% and this
increased to 42% at the start of 2010. Harvard (2010) considered how this had a
knock on effect increasing the rate of delinquency for prime mortgages which in 2010
was 22% for fixed mortgages and 17% for adjustable mortgages due to house price
deflation, lower incomes and increased unemployment. Moreover, he explained how
the UK private rental sector had grown significantly by approximately 40% in the
noughties to 12%. Furthermore, rent control caps were removed in 1989 and the
banks were more willing to lend to this sector.
According to Crosby (2008) repayment mortgages were traditionally fixed
interest in the USA and variable rate in UK however in the 1980s these differences
became less distinct. Moreover, mortgage lending in the UK increased 5 fold from
£20 to £100 billion from 1997 to 2007. Furthermore, subprime lending termed
37

Secure Best Marks with AI Grader

Need help grading? Try our AI Grader for instant feedback on your assignments.
Document Page
adverse lending (Pannell, 2006) was less common in the UK but gradually increased
from the 1980s to a 6% market share in 2005 and then declined to 1% in 2010 (CML,
2010).
Stephens and Quilgars (2008) were of the opinion that in the UK there was
less credit scoring and use of legal remedy to manage debt with consequences on
reliability of credit ratings. They highlight how most subprime mortgages
(approximately two thirds) were used to refinance/remortgage existing debt. Jones
(2003) discusses how council tenants many with low incomes and poor credit ratings
were being assisted by companies to purchase their homes using subprime mortgages
(Jones, 2009). MBS increasingly supported UK mortgages with the proportion
increasing from 2.5% in 1997 to 27% in 2005 (Turner 2009a;Turner 2009b).
Consequences of the collapse of MBS were severe mortgage rationing and an increase
in the LVR required by buyers.
Property price increases occurred in UK and USA from 1995 for 12 years with
house prices increasing in real terms by 158% and 61% respectively. The most rapid
increase in the UK was in the period 2002-2004 accounted for by lower interest rates,
low unemployment and increasing incomes (Crosby, 2008). It was noted by Miles and
Pillonca (2008) that only fixed rate mortgages were initially available in Ireland,
tracker mortgages were introduced in 1999, interest only mortgages and 100% LTV
loan to value mortgages in 2005.
Gartner et al (2013) consider how the median period of a LTV mortgage was
59% in 2001 and increased to 80% at the peak. Moreover, the median duration
increased from 20 years in 2001 to 26 years in 2007. Furthermore, 31% of first time
buyers in Dublin were given 100% mortgages and 70% were given mortgages of
more than 30 years (CSOa, 2017). Doyle (2009) reports how the proportion of interest
only mortgages increased from 2% in 2001 to 15% in 2007. According to Lane (2015)
the US share of the Irish bank liabilities increased dramatically after 2005. He
discusses how the income fractions of the mortgages increased from 16% in 2000 to
25% in 2007 at the peak. The average mortgage per capita increased from 7,000 euro
to 33,000 euros (EMF, 2009).
2.9 Conclusion
The 2008 Financial Crisis was the largest since the 1920s and early 1930s and
had the slowest recovery. Contributory factors included different forms of high risk
38
Document Page
lending products in the mortgage industry which had contributed to increasingly
overvalued house prices for the 10 years prior to the recession. The recession started
in the USA the World lead economy then spread worldwide. The UK and the
Republic Of Ireland were particularly exposed to many US financial products
including mortgage debt. There had been increased ease of credit and reckless lending
especially with regard to mortgage products. Much of the debt in the mortgage
industry was toxic contributing to falling property prices. Economies and business are
cyclical and significant contractions provide potential business and investment
opportunities. The economies have not yet recovered a decade since the recession
started so there are still business and investment opportunities. Further research
especially in the property market is required to determine the best business investment
opportunities in 2017.
39
Document Page
CHAPTER 3: RESEARCH METHODOLOGY
3.1 Introduction
The literature review has outlined the historical pattern of recessions and
economic cycles. The 2008 Financial Crisis has been analysed with respect to causes,
consequences, remedies and recovery with a view to identifying possible investment
opportunities. This was the most significant Financial Crisis since the 1930s and the
recovery has been much slower than previous recessions. As much of the mortgage
debt was toxic the crisis had a disproportionate affect on the property market. Further
research is required to explore investment opportunities in the property market
comparing these to alternative investments available in 2017.
A detailed analysis of methods to be implemented for study and assessment of
data for research are examined and analysed in this chapter. The concept behind
research methodology, its various modes and tools, further explanation about the
inductive and deductive approaches to research are highlighted in this chapter. The
application of the different methodologies in the research process and the strategic
approach applied by the researcher are evaluated. The nature and a description of the
methods used in this research, the design and the suitability for the topic are
described.
Research has been defined (Oxford dictionary, 2017b) as
“The systematic investigation into and study of materials and sources in order to
establish facts and reach new conclusions”
It was defined by Sharp et al, 2002 p7 ‘Research is seeking through
methodical processes to add to one’s own body of knowledge and to that of others, by
the discovery of nontrivial thoughts and insights’
It is designed to obtain information to solve research questions or problems by
systematic, focused orderly collection and analysis of data (Ghauri and Gronhaug,
2002).
Research implies that that there is a systematic process of solving problems,
based on identifying a problem, designing the research to test the problem, collection
of data which is analysed to evaluate the problem. This process then allows logical
conclusions to be made.
40

Paraphrase This Document

Need a fresh take? Get an instant paraphrase of this document with our AI Paraphraser
Document Page
The research should be replicable and designed to enable others to repeat the
research or undertake future research. Research is reductive when data is used to
establish more general relationships. Research can be academic or applied.
The purpose of the research may be to test a theory, effect a change, improve
practice, resolve a controversial issue, review knowledge that already exists, describe
a problem/situation or physically construct something useful.
3.2 Research Philosophy
(Saunders, 2007, p5) defined research as ‘something the people undertake in
order to find out things in systematic way, thereby increasing their knowledge.’
Saunders (2007) also stated that research increases knowledge and understanding to
answer a specific question. Saunders defined applied research as business and
management research which is inferred to solve managerial problems and create
knowledge for the common good. In business and management research the
development of knowledge may not be dramatic but develop knowledge in a field to
answer a specific question (Saunders et al, 2007).
Saunders et al (2007) indicate that the research philosophy used by researchers
gives an indication about their views of the world. He described epistemology,
ontology and axiology ways of approaching research philosophy. Chia (2002, p2)
presents ‘philosophy is primarily concerned with rigorously establishing, regulating
and improving the methods of knowledge-creation in all fields of intellectual
endeavour, including the field of management research.’ He gives an explanation that
philosophical thinking is concerned with the four pillars of epistemology, logic,
metaphysics and ethics.
There are a number of systematic stages in the research process (John and Lee
Ross, 1998).
1 Preparation involves idea generation, choosing a subject, literature research and
methodology choice.
2 Planning involves idea development, hypothesis/title, ethical issues and sampling
frame.
3 Process involves practicalities, tools, instruments, equipment and carrying out the
work.
4 Product involves analysis of results, evaluation, reporting and presenting. This
represents the outcomes of the research and analysis of the data.
41
Document Page
3.2.1 Positivism research philosophy
Seddhighi (2007) describes the positivism approach that regards reality as
objective, detached and external for which human interest is irrelevant. He describes
social constructionism regarding reality as socially constructed and meaning given by
people. The human dimension is important as the researcher is involved and the
research attempts to explain and explore the problem and theorise knowledge. This
paradigm considered world as an external element and the only research phenomenon
or objects that an investigator need to study without considering research’s own belief
& perception. Such researchers adopt a controlled & structural framework in
conducting the investigation after developing a well understanding about the research
topic. In this, hypothesis is designed and tested by using a suitable research
methodology. Thus, such scholars maintain a clear difference between social aspects
like their own believe, perception and judgements and science and focus on
objectivity and logical approaches. They apply statistical and mathematical tools for
conducting research to uncover reality and aims at context free generalization.
3.2.2 Interpretivism research philosophy
Interpretivists scholars believes that reality is a aspect of multiple of
components and all these depends on each other. Thus, knowledge is acquired through
socially constructed means. They always ignore following highly structured
framework and accept flexible structure of human interaction so as to understand
human interaction and find out what is reality. Such researchers believe in
interdependency existence between informants and investigator. In such philosophy,
researcher acquires new knowledge through an emergent approach. The key target of
such paradigm is to explore human behaviour rather than generalization. They
examine underlying reasons, motives, causes and other subjective human experiences.
Out of these, the present study’s key aim is to deeply examine economic
recession took place in 2008. With such analysis, investigator will explore the
investment opportunities for the corporation for 2017. Thus, the analysis prefers
application of interpretivism paradigm because in this, factors such as economic
downturn, its reasons, economic impact and remedies had been examined. All the
analysis will explore a new knowledge about exist investment opportunities for the
business for the year 2017.
42
Document Page
Research strategy is defined ‘a general orientation to the conduct of business
research’ (Bryman and Bell, 2003, p 25). Each strategy can be employed for
explanatory, descriptive and exploratory purposes which can be used to classify the
research (Yin, 2003; Saunders et al 2007). Saunders et al (2007) indicates that
different strategies include experiment, survey, case study, action research, grounded
theory, ethnography and archival research. The research onion is a helpful instrument
which gives an overview of the multiple decision making steps that can be chosen and
adapted.
Research strategies can be categorised as either theoretical or empirical.
Theoretical is when other people’s work is used without any direct involvement in
collection of evidence, observation or behaviour. Empirical is the use of observation
or experience with a particular event to collect research data.
Empirical research can then be orientated in a positivistic or
phenomenological orientation. Positivism is derived from the natural sciences and
allied to the deductive theory. Phenomenology is derived from the social sciences and
allied to the inductive theory.
Ghauri et al (1995) describes the deductive and inductive approaches to
research. Saunders et al (2007) discusses how deduction is a lower risk strategy as
induction risks that no useful data, theory or patterns will emerge. They describe
deduction as testing a theory whereas induction builds a theory. Inductive research
can take much longer as a theory may only gradually develop as data, information
collection and analysis is less defined.
3.3 Research approach
Research approach is mainly of two types that are deductive vs inductive that
are discussed here as under:
3.3.1 Deductive research approach
A deductive approach is when a hypothesis is stated, the methodology is
designed to test the hypothesis (Saunders et al, 2007) and results are generated by
logical reasoning. It is more appropriate for a mature topic with plenty of research
available and uses a scientific highly structured method of investigation. Moreover, it
involves an explanation of events by theory development and then observation
between 2 variables to test if the theory adopted is true. The hypothesis is tested by
43

Secure Best Marks with AI Grader

Need help grading? Try our AI Grader for instant feedback on your assignments.
Document Page
drawing conclusions and testing the theory from objective observations which are
facts based on measurements. The implications of the conclusions are then related
back to the theory either accepting or rejecting the null hypothesis.
Research using the deductive approach is mostly based on previously
established hypotheses rather than establishing new hypotheses, this approach is
known as top down because it progresses from a generalised pattern to a more specific
conclusion (Krueger, 1994). A hypothesis is a testable expected result which is based
upon an idea of what the outcome may be and reasoned judgement or investigation
with the aim to accept or reject the null hypothesis.
Content analysis is objective and systematic (Bryan and Bell, 2003 p195) ‘an
approach to the analysis of documents and texts that seeks to quantify content in terms
of predetermined categories and in a systematic and replicable manner.’
3.3.2 Inductive research approach
The inductive approach is based on collecting data and then developing a
theory based on the data analysis (Saunders et al, 2007). It is more likely to come
from experience rather than reflection on theories or concepts and is not based on a
scientific means of verification but on hunches or intuition. This approach is more
appropriate for a new topic with little existing literature or observations but these are
used to lead the inquiry and investigation which usually uses qualitative information
rather than quantitative data. Moreover, it involves a holistic flexible approach with
the processing of multiple sources of information allowing consideration of
alternative theories and the totality of the situation to determine a strategy and make
conclusions.
Seddighi (2007) explains that in an inductive approach the focus is on
explaining and processing the data to produce a model or framework, make
conclusions and a recommendation. The personal experience of the researcher in the
subject matter influences decisions, conclusions and recommendations. In the
grounded theory developed by Glazer and Strauss (1967) a formal inductive approach
is used, data collection, information processing and interpretation are intertwined to
develop theories from patterns.
In the given research study, inductive research approach has been followed
because it uses theoretical sampling in that the data collected is controlled by the
emerging theory then coded or labelled (Bryman and Bell, 2003). In the study, no
44
Document Page
hypothesis is designed and moreover, there is constant comparison between the data
being collected and the emerging theory, theoretical saturation occurs when the new
data does not add to emerging theory. This method helps explain observed
phenomena, understanding relationships between or within them drawing inferences
and it allows different types of qualitative data to be analysed.
An empirical strategy with a phenomenological orientation was used for this
applied research. The author had knowledge of the subject area and a theory of what
the research may demonstrate but was open to considering alternative theories. An
inductive approach was taken which is based on collecting data and then developing a
theory based on the data analysis (Saunders et al, 2007).
3.4 Research type: Quantitative and qualitative
There are three types of research, quantitative and qualitative researches,
outlined below:
3.4.1 Quantitative research
Unlike above, this is about collecting and acquiring either numerical
information or collecting data set that is easily convertible into numbers. In order to
test the same, investigators often formulate research hypothesis and apply statistical &
financial tools to assess its validity and reality. It is a systematic empirical research
which uses observable dataset through statistical, computational and other
mathematical tools. Thus, by this way, it provides fundamental connection between
researcher observation and numerical data to present quantitative relationship.
3.4.2 Qualitative research
Qualitative data refers to non numerical information (Saunders, 2007). The
qualitative approach conducts research on the basis of potency, concentration and
affluence relating to real life incidents and behaviour patterns (Wallace and Wray,
2006). Seddighi (2007) considered the nature of qualitative data, which is based on
the meaning of words expressed and discussed how the results of non-standardised
data require classification. It is about inquiring research elements deeply for the
assessing and evaluating specific experience with the key motive to explore and
uncover hidden things. The researchers’ knowledge, beliefs, ability and views may
influence the outcome of the research. Secondary qualitative macro environmental
45
Document Page
information has been considered in this research to develop the theory hence
recommendations and conclusions.
Out of both the methods, here, the present study deeply examines recession
along with its underlying causes, impact on economy and opportunity for investors
which comprises both the quantitative qualitative assessment. Therefore, a mixed
research study had been used to study each & every element in a detailed manner. In
this, quantitative information includes house prices by country and region and
changes in it over a long period. Moreover, it includes local authority dwelling,
percentage of different type of renters i.e. social, private and owner occupiers, average
housing prices, repossession rate and others. However, qualitative factors include
drawing inferences about the recession causes, impact on economy and exploring
investment opportunities.
3.5 Data collection
The process how investigator acquire needed amount of information that are
either quantitative or qualitative is known as data collection. There are two
fundamental ways from where investigator extracts required information presented
here as under:
3.5.1 Primary data
Primary data refers to the acquisition of using new set of information that is
not yet collected and researched by any other party. Thus, the data set really helps to
satisfy specific need of the research by conducing real research through using tools
like survey, interview, field observation etc. This is of great use when the topic of
investigation that is going to be studied by researcher is totally new and no or very
limited number of researches had been done. The most important benefit associated
with the primary research is data gathered extremely and perfectly satisfied
researcher’s own need because interview, survey and others are used keeping into
consideration the ultimate aim and objective. However, as the process of data
gathering takes time and incur higher cost are the two drawbacks associated with this.
3.5.2 Secondary data
46

Paraphrase This Document

Need a fresh take? Get an instant paraphrase of this document with our AI Paraphraser
Document Page
Secondary data, on the other side, are already available to the scholar.
Therefore, performing an original survey is not required, books, newspaper, online
database are the popular methods used for secondary data collection. Before using
such, investigator need to ensure that information is not time-outdated and also
satisfied current research need. Secondary data is information that has been collected
by someone else other than the researcher (Sekaran, 2000). Secondary data had
advantages in that it is more efficient in terms of time and financial resources.
Disadvantages of using secondary data are that it may be biased in its collection or
how it is presented by another researcher as it was not collected with the specific
objectives of the research but for other purposes.
For the current research study, secondary data was collected from multiple
sources which included government publications, government agencies, trade
associations, university based databases, academic journals/publications, and internet
based databases, syndicated data services, business press, media companies, internet,
TV, local private sources and personal networking. All the information is used for
examining the reasons and the impact of economic recession that took place in the
historical years. Moreover, other studies were used to find out different authors
opinion and perception about upcoming investment opportunities which is expected to
give increased return to investors in 2017.
3.6 Data analysis
Data has to be analysed to understand how it relates to the research objectives
and has to be processed into useful information, data analysis techniques assist with
this process (Saunders et al, 2007). The data has to be assessed in terms of quality,
weaknesses and strengths. Sekaran (2000) outlines the main objectives in data
analysis: getting a feel for the data, testing the quality of the data and testing the
hypothesis developed for the research.
Quantitative data was analysed using descriptive statistics such as average
house prices, rate of repossession, proportion of different types of renters and others.
Moreover, in order to express research findings more clearly and effectively,
different types of diagram like area charts, map charts, bar charts, line graphs and area
graphs. These allow the researcher to explore, display, describe and examine trends
(Saunders et al, 2007). Qualitative methods of data analysis are a set of interpretative
techniques to describe, translate, decode the non-numerical information collected to
47
Document Page
understand their meaning. This occurs naturally in the real world (Maanen, 1983).
Strategies for analysis include SWOT (strength, weakness, opportunities and threats)
and can be classified into 3 types
Using theory to devise a framework for data analysis
Generating/building a theory on the basis of the data to explain the central
theme that emerges from the data
Combining inductive and deductive approaches to analyse the data
Seddighi (2007) describes how analysis of qualitative data and information is
by conceptualisation recognising relationships.
Figure 7 Chart To Demonstrate Layers of the Business Environment
The organisational environment includes the macro environment, micro
environment and internal environment. The macro environmental factors are the most
difficult to control. They forecast and evaluate factors that will have an influence on
the future of the business.
The macro environment can be analysed by the PEST framework which
subdivides the influential factors into 4 categories Political, Economic, Social and
Technological (Johnson and Scholes, 2002). The theory that emerges can then be
tested by SWOT analysis.
Table 5 Summaries Key Forces That Influence Business in the Macro-environment
Political
Environmental regulations and protection
Economic
Economic growth
48
Document Page
Employment law
International trade regulations and
restrictions
Competition regulation
Government stability
Taxation policy
Foreign trade regulations
Social welfare policies
Business cycles
GNP trends
Interest rates and monetary policies
Exchange rates
Unemployment
Disposable income
Consumer confidence
Social
Population demographics
Income distribution
Social mobility
Lifestyle changes
Attitudes to work and leisure
Consumerism
Levels of education
Labour/social mobility
Education
Technological
Government spending on research
Government and industry focus on
technological effort
New discoveries/development
Speed of technological transfer
Rates of obsolescence
Energy and costs
Information technology, internet and
mobile technology
(Source: Johnson and Scholes, 2002).
PEST analysis and an inductive approach were used to analyse the qualitative
information regarding the macro economic factors identified and discussed. The
different sources of quantitative data and qualitative information were processed by
the inductive process to develop a theory which was then examined by SWOT
analysis.
3.7 Reliability and Validity of Data
Corbin and Strauss (2008) define reliability as the ability of the data collection
system to yield the same results when used in a similar setting (Corner 2009). Validity
refers to how accurate a data collection system can be in measuring what it was
developed to measure (Dillman, 2010).
This research depends on secondary data for information about the economies,
markets, macro environment and other factors. This data and information has been
collected by other people hence is limited by their performance in this task. There can
be errors in collection and recording of data. Bias from those collecting and recording
49

Secure Best Marks with AI Grader

Need help grading? Try our AI Grader for instant feedback on your assignments.
Document Page
the data, deliberately or subconsciously can skew results. Moreover if the information
is unreliable then the conclusions will be invalid. Data is extracted from the reliable
sources like economic report, governmental publication and trade journals which
provides highly valid results and suitable for the study. It helps in avoiding the risk of
poor quality of data collection and ensures research reliability & validity.
3.8 Ethical Issues
Blumberg et al (2005, p92) define ethics as the ‘moral principles, norms or
standards of behaviour that guide moral choices about our behaviour and our
relationships with others.’ The researchers’ behaviour towards those that might be
affected by the research work or subject of the research work should be appropriate.
The researcher should be aware of the ‘power relationship’ between the researcher
and those who grant access.
Saunders et al (2009) ‘the appropriateness of the researcher’s behaviour in the
relation to the rights of those who become subject of a research project, or are affected
by it.’ The researcher should work freely without coercion at all stages of the research
including when formulating, clarifying or designing the research, analysing data and
reporting research findings. The ethics of the data collection methods/handling and of
the researcher should be considered. The accuracy and risk of bias especially with
qualitative information must be considered.
The research contains confidential information about the author and his
finances but not about anyone else. The information and data used is non identifiable
and most of the data and information is in the public domain. Confidentiality is the
key requirement which is properly followed by maintaining full security of the used
data sources via password protection. Moreover, possible biasness from the subjective
judgement and own perception is avoided to maintain focus on objectivity. Thus, in
this area, I maintain difference between myself and investigation and draw inferences
and analyze things with core focus on objectivity.
3.9 Limitation of the study
The research is limited by the reliability of the secondary information and
data. The lack of control using secondary data has made if more difficult to obtain
recent up to date information for 2016 and 2017 which is not yet available. The
research has been limited by the amount of time available. Moreover, some of the
sources were not free for access; therefore, it is a limitation that affects the data
50
Document Page
availability. There are other strategic management tools and theories but due to
limitations of time these were not reviewed.
3.10 Conclusions
The research uses mainly secondary data for information acquisition. It is a
mixed research wherein quantitative data such as house price, repossession rate and
others has been analysed by descriptive statistics displayed in the form of bar charts,
line graphs, map charts and area graphs to allow trends to be more clearly displayed
hence examined. Qualitative dataset, on the other side, includes macro-economic
information which was analysed by PEST analysis. The inductive approach and
interpretivism philosophy was adopted to analyse data and information to develop a
theory or business strategy which was analysed by SWOT analysis.
51
Document Page
CHAPTER 4: DATA ANALYSIS
4.1 Introduction
This chapter initially includes the secondary quantitative data collected some
recorded in tables but most results are analysed as descriptive statistics in the form of
map charts, area graphs, area charts, bar charts and line graphs.
4.2 Results
4.2.1 UK Property Prices
Figure 8 Area Graph To Demonstrate UK House Prices Since 1952
(Source: Pettinger, 2016)
This graph demonstrates the long term trends in UK house prices which been
gradually increasing since 1952 despite short term troughs from 1988 to 1995 and
2006 to 2012.
52

Paraphrase This Document

Need a fresh take? Get an instant paraphrase of this document with our AI Paraphraser
Document Page
Figure 9 Area Graph To Demonstrate UK House Price % Change Growth 1993-2015
(Source: Pettinger, 2016)
This graph demonstrates house prices dropped in value in the early 1990s with
significant increases from 1997 until 2008 with the highest rate increase in 2004.
There was then a significant fall in 2010 which was followed by increases from 2011.
Figure 10 Line Graph To Demonstrate Real UK House Prices 1975-2015
(Source: Pettinger, 2016)
53
Document Page
This graph demonstrates prices corrected for inflation and an upward trend
line with periods above the trend line from 1986-1991 and 2002 -2010 and a period
below the line from 1990-2002. House prices dropped from 1988 to 1996 and from
2007 to 2012.
Figure 11 Line Graph To Demonstrate UK Average House Price To Earnings Ratio
1954-2014
(Source: Carlson, 2015)
This graph demonstrates a trend line at 4.5 with a short period below this from
1993-1997, moderate increases above this from 1972-1975, 1986-1992 and with
significant increases above this from 2002 which partially corrected in 2008.
54
Document Page
Figure 12 Line Graph To Demonstrate UK Average House Price To Earnings Ratio
1986-2016
(Source: Shapland, M)
This line graph demonstrates the large deviation below the trend line from
1990-2000 and a deviation above the trend line from 2002 which only partially
corrected in 2008
Figure 13 Line Graph To Demonstrate Consumer Price Index CPI and Rent CPI
2005-2016
This graph demonstrates that rents were rising below the inflationary CPI rate
from 2009 until 2015.
55

Secure Best Marks with AI Grader

Need help grading? Try our AI Grader for instant feedback on your assignments.
Document Page
4.2.2 Regional Property Prices
Figure 14Bar Chart To Demonstrate UK Regional House Prices in 2015
(Source: Pettinger, 2016)
This bar chart demonstrates that house prices are relatively more expensive in
England than other parts of the UK. London prices are significantly more expensive
than the other parts of the country almost twice the UK average. The lowest house
prices are in North East England followed by Northern Ireland.
Table 6 To Demonstrate UK Regional Changes In House Prices In 2008 Recession
Region Top quarter Bottom quarter % change top
to bottom
% change top
to
2011Q
2
56
Document Page
North 2007Q4 2009Q2 17.5 16.6
Yorkshire and
Humberside
2007Q3 2009Q3 20.3 18.2
North West 2007Q4 2009Q2 21.3 18.2
East Midlands 2007Q3 2009Q2 20.4 20.4
West Midlands 2007Q4 2009Q2 20.3 17.3
East Anglia 2007Q3 2009Q2 26.2 18.0
Wales 2007Q3 2009Q2 23.1 21.0
South West 2007Q3 2009Q2 23.1 11.6
South East 2007Q3 2009Q2 21.3 15.1
Greater
London
2007Q3 2009Q2 26.0 17.9
Northern
Ireland
2007Q3 – 47.6 47.6
Scotland 2008Q1 2009Q2 19.8 13.2
UK 2007Q3 2009Q2 21.0 16.7
(Source: Historical House Price Database (seasonally adjusted))
The table demonstrates that the greatest drop in property prices from 2007 was
in Northern Ireland with a fall of 47.6% more than twice that of other parts of the
country with no recovery in 2011 whereas there was recovery in other parts of the
country.
57
Document Page
Table 7 Line Graphs To Demonstrate Regional House Price To Earnings Ratios 2000-
2015
(Source: Hoskin, 2016)
These graphs demonstrate a gradual increasing trend from 2000 to 2014 with a small
blip in 2009 for most regions. London and the South East have the highest house price
to earnings ratios levels with North East England, Scotland, Wales and Northern
Ireland the lowest. Northern Ireland deviates significantly from the trend with a
significant increase from 2005-2007 and a significant decrease from 2007-2012.
4.2.3 Northern Ireland Property Market
58

Paraphrase This Document

Need a fresh take? Get an instant paraphrase of this document with our AI Paraphraser
Document Page

Figure 15 Line Graphs To Compare London and Northern Ireland House Prices From
2005-2015
(Source: Collinson, 2015)
The graphs demonstrate the small short blip in London prices from 2008-2009
before they continued to increase. This in contrast to the Northern Ireland trend line
which demonstrates a more significant prolonged decline until 2013 and then only
marginal increases.
Figure 16 Line Graphs To Compare London and Northern Ireland House Prices From
2005-2015
(Source: Denton 2015)
The graphs demonstrate similar trend lines for England, Wales and Scotland
with a moderate decrease in prices from 2007-2009. The trend line for Northern
59
Document Page
Ireland deviates significantly from 2005-2007 above the trend line and from 2007-
2009 a rapid decline.
Figure 17 Line Graphs To Compare Northern Ireland, Republic of Ireland and UK
Residential Property Prices 2005-2015
(Source: Ramsey, 2015)
The graphs demonstrate that the 2005-2007 increases and subsequent declines
were significantly greater in Northern Ireland and in the Republic Of Ireland to a
lesser extent compared to UK average prices.
4.2.4 UK Housing Tenure
60
Document Page
Figure 18 Bar Chart To Demonstrate UK Trends in Tenure From 1918 to 2014
(Source: Department for Communities and local Government, 2015)
The bar chart demonstrates a pattern of increasing proportion of social renters from
1939 until 1981 when it peaked and then a gradually decline since. The number of
private renters had been decreasing until 1991 but has been increasing since then. The
number of owner occupiers had been increasing until 2001 but has subsequently
declined.
61

Secure Best Marks with AI Grader

Need help grading? Try our AI Grader for instant feedback on your assignments.
Document Page
Figure 19 Line Graphs To Demonstrate Proportion Of Local Authority Dwellings In
The Different Countries Of The UK 1991-2007
The line graph demonstrates that the proportion of local authority dwellings
has been decreasing since 1991in all parts of the UK but the graph shows it most
clearly for Scotland and England.
Figure 20 Line Graphs To Demonstrate UK Home Ownership By Age Group
(Source: Canocchi, 2016).
The graph demonstrates much less home ownership in the 1981-2000
Millennial group compared to previous generations and the baby boomer (1946-1965)
had highest home ownership.
62
Document Page
Figure 21 Line Graphs To Demonstrate Trends in UK House Building 1949-2013
(Source: Wheeler, 2015)
The line graphs demonstrate the significant reduction in number of homes
built by local authorities from 1970 but especially from 1995 and the decline in
private building since 2010.
4.2.5 Republic Of Ireland Property Market
63
Document Page
Figure 22 Area Chart To Demonstrate House Prices in Republic Of Ireland 1975-2016
(Source: CSOd)
The graph demonstrates the trend of gradual increase in property prices until
1995 and then the significant increase in prices until 2007 with decline until 2012 and
subsequent increase.
Figure 23 Bar Chart To Demonstrate House Building In Republic Of Ireland 1991-
2015
(Source: Department of housing, planning and local government, 2017).
64

Paraphrase This Document

Need a fresh take? Get an instant paraphrase of this document with our AI Paraphraser
Document Page
The chart demonstrates the trends of significant increase in house building
until 2006 and rapid decline since.
Figure 24 Line Graphs To Demonstrate Ratio Of House Prices To Income and House
Completions in Republic Of Ireland 1985-2015
(Source: Kelleher, 2016)
The graphs demonstrate the trend of significant increase in house price to
income ratio from 1997 to 2007, significant decline until 2013 and increase again
since then. They demonstrate the increase in house building until 2006 and rapid
decline since.
4.2.6 Repossessions
Figure 25 Line Graphs To Demonstrate USA Delinquency and Foreclosure Rates
1990-2016
65
Document Page
(Source: Bryan, 2016)
The graphs demonstrate the trend of rates increasing significantly from 2006,
peaking in 2011 and declining until almost baseline rates in 2016
Figure 26 Bar Chart To Demonstrate Number of UK Repossessions 1988-2012
(Source: Pettinger, 2016)
The chart demonstrates the trends in repossessions rate increasing from 2005
and peaking in 2009, but much less than in the early 1990s.
Table 8 To Demonstrate Number Of UK Buy To Let and Owner Occupied
Repossessions 2008-2016
Buy To Let Owner Occupied
Number Number
Year Quarter
2008 Q1 7,800 700
Q2 9,300 700
Q3 10,300 800
Q4 9,600 800
2009 Q1 12,000 1,200
66
Document Page
Q2 11,100 1,100
Q3 11,000 1,500
Q4 10,000 1,000
2010 Q1 9,800 1,100
Q2 8,600 1,300
Q3 8,200 1,200
Q4 7,300 1,000
2011 Q1 8,200 1,400
Q2 7,700 1,600
Q3 8,000 1,600
Q4 7,300 1,500
2012 Q1 7,900 1,700
Q2 6,800 1,600
Q3 6,300 1,900
Q4 6,000 1,700
2013 Q1 6,400 1,600
Q2 6,300 1,300
Q3 5,700 1,500
Q4 4,900 1,200
2014 Q1 5,000 1,400
Q2 4,100 1,300
Q3 3,700 1,200
Q4 3,100 1,000
2015 Q1 2,100 900
Q2 1,800 700
Q3 1,800 700
Q4 1,500 700
2016 Q1 1,500 700
(Source: CML, Anderson et al, 2016)
The table demonstrates that there was a much greater proportion of buy to let
properties repossessed during the recession with numbers peaking in the first quarter
2009 and then subsequently declining
67

Secure Best Marks with AI Grader

Need help grading? Try our AI Grader for instant feedback on your assignments.
Document Page
Figure 27 Map Chart To Demonstrate Northern Ireland Repossessions By Council
District 2005-2011
(Source: Figures provided by the Northern Ireland Court Service / Graphics Chris
Scott)
Northern Ireland Statistics and Research Agency (These figures are based on
Northern Ireland Enforcement Of Judgement orders made). The chart demonstrates
that the greatest number of repossessions was in Londonderry/Derry, Belfast, Lisburn,
Newry and Mourne.
Table 9 To Demonstrate Northern Ireland Property Repossessions Completed By
Council District 2007-2016
200
7
200
8
200
9
201
0
201
1
201
2
201
3
201
4
201
5
201
6
Northern
Ireland
139 205 448 706 938
110
2
152
2
121
6 646 465
Antrim and
Newtownabbe
14 16 43 64 55 76 91 88 43 34
68
Document Page
y
Ards and
North Down
10 26 34 55 87 96 135 117 51 56
Armagh,
Banbridge
and Craigavon 5 21 35 82 94 137 220 133 78 52
Belfast
39 46 82 114 180 175 296 221 137 27
Causeway
Coast
and Glens 5 17 45 54 100 88 119 93 45 91
Derry City
and
Strabane 7 19 54 67 71 81 98 88 52 32
Fermanagh
And
Omagh 2 10 20 50 45 77 71 56 35 60
Lisburn
and
Castlereagh 22 19 21 56 77 72 109 84 39 20
Mid and
East
Antrim 8 12 26 48 70 75 109 82 47 28
Mid Ulster
6 7 42 48 67 84 101 91 41 27
Newry,
Mourne
and Down 18 10 41 47 71 116 130 128 63 27
(Northern Ireland Statistics and Research Agency, 2017b) (These figures are based on
Northern Ireland Enforcement Of Judgement orders made)
69
Document Page
The table demonstrates the trend in Northern Ireland repossessions peaking in
2013 with the greatest number being in Belfast.
Figure 28Line Graph To Demonstrate Number Of Repossessions in Republic Of
Ireland 2012-2015
(Source: Central Bank Of Ireland, 2017)
The graph demonstrates a significant increase in the number of repossessions
from September 2014.
4.2.7 Interest Rates
70

Paraphrase This Document

Need a fresh take? Get an instant paraphrase of this document with our AI Paraphraser
Document Page
Figure 29 Line Graph To Demonstrate Bank Of England Base Rate 1985-2017
(Source: Mortgagerates, 2017).
The graph demonstrates the decline of the base rate from 1990 and significant
decline since 2009.
Figure 30 Line Graphs To Demonstrate UK Base, Bank and Mortgage Interest Rates
1980-2014
(Source: Savills, 2017)
The graphs demonstrate the trends of gradual decline in mortgages and savings rates
in contrast to the sudden decline in the base rate in 2008.
71
Document Page
Figure 28
Figure 31 Line Graphs To Demonstrate Base Rates and Inflation in UK 2003-2017
(Source: Pettinger, 2017)
The graphs demonstrate the decline in inflation associated with decrease in
base rate.
Figure 32 Line Graph To Demonstrate ECB European Central Bank Interest Rates
1999-2017
72
Document Page
(Source: Global Rates, 2017)
The graph demonstrates the significant decline in rate in 2009 and then further
gradual reduction gradual from 2012 until 2015
Figure 33 Line Graphs To Demonstrate Irish Interest Rates For Housing Loans 2003-
2016
(Source: Global Property Guide, 2017).
The graphs demonstrate the trends of mortgage rates following trends in base
rates but being relatively higher especially since 2010.
4.2.8 Stock Market Shares versus Property
73

Secure Best Marks with AI Grader

Need help grading? Try our AI Grader for instant feedback on your assignments.
Document Page
Figure 34 Line Graph To Demonstrate US House Prices Since 1900
(Source: Observations and notes, 2012c)
The graph demonstrates the long term trend of increase in house prices
since 1900 but more rapidly since 1980, with a small trough in 1990, rapid
increase from 2000 until 2008 and rapid decline from 2008-2010.
74
Document Page
Figure 35 Line Graph To Demonstrate Inflation Adjusted US House Prices Since
1900
(Source: Observations and notes, 2012d)
The graph shows the trend of significant increase in house prices from 2000 to
2008 and then rapid decline.
75
Document Page
Figure 36 Line Graphs To Demonstrate USA Federal Housing Finance Agency House
Price Changes 1991-2015
(Follain and Giertz, 2016) (Zillow, United States Home Values and Prices)
This graph demonstrates that house price increase was from 1997 but most
rapid in 2004 and the decline from 2007-2013 with subsequent increase since.
76

Paraphrase This Document

Need a fresh take? Get an instant paraphrase of this document with our AI Paraphraser
Document Page
Figure 37Line Graphs To Demonstrate US Housing vs Stock Market Appreciation
1900-2010
(Source: Observation and Notes, 2012a)
The graph demonstrates that the stock market appreciated at a greater rate than
Housing since 1950.
77
Document Page
Figure 38 Bar Chart To Demonstrate Components Of 50 Year US Stock Market
Return 1920-1960
(Source: Observation and Notes, 2012b)
The chart demonstrates that US Stock Market has performed consistently since
1920 but with short term fluctuations in P/E ratio.
Figure 39 Line Graph To Demonstrate Long Term Trend FTSE All Share 1920-2013
78
Document Page
(Source: Almanacist, 2013)
Figure 40 Line Graph To Demonstrate Growth In The UK FTSE All Share 1946-2013
(Almanacist, 2014)
The graphs demonstrate the long term upward trend in shares but from 1985-
2009 increases were above the long term trend line.
Figure 41 Line Graph To Demonstrate Growth In The UK FTSE 100 Index 1984-
2013
(Source: Almanacist, 2014)
79

Secure Best Marks with AI Grader

Need help grading? Try our AI Grader for instant feedback on your assignments.
Document Page
The graph demonstrates the increase the growth above the trend line from
1996-2002 and to a lesser extent from 2006-2008. Growth was below the trend line
from 2002-2006 and from 2008-2012.
Figure 42 Line Graphs To Demonstrate Real Growth In The UK FTSE 100 Index
1988-2013
(Source: Almanacist, 2014)
The graphs demonstrate the long term trends of increase in real share value
with time until 1999 but since then until 2013 there have been fluctuations but no real
growth.
Table 10 To Compare UK Share and Property Return 1985-2014
(Source: Jeffries, 2015)
The results indicate that since 1985 shares have performed better as an
investment than property or deposits (True Potential, 2016). The authors have not
80
Document Page
explained if rental income was included in the return from property or merely
appreciation (Upton, 2015). Cash deposits with interest reinvested has performed
marginally better than property during this period.
Table 11 To Compare UK Share and Property Return 2000-2014
(Source: Jeffries, 2015)
The results in these tables indicate that property has performed better than
shares since 2000 with both performing much better than cash investments.
Figure 43 Line Graphs To Demonstrate Appreciation In UK Property and Stock
Market 1985-2015
(Source: Carlson, 2015)
This graph demonstrates that shares and property have appreciated similarly
from 1985 -2015 with shares performing marginally better. Shares appreciated more
81
Document Page
from 1993-2002 and from 2012-2015. Property appreciated more from 2003-2006 and
during 2009.
Figure 44 Line Graph To Demonstrate UK FTSE PE Price to Earnings Ratio 1993-
2017
(Source: Balenthiran, 2017)
The graph demonstrates the significant increase in PE ratio above the trend
line since 2015 and a period above the trend line from 1997-2002.
4.2.9 Precious Metals
Figure 45 Line Graphs To Demonstrate Comparison Between UK Stock Market
(FTSE100), US Stock Market (S&P 500) and Gold 1984-2015
82

Paraphrase This Document

Need a fresh take? Get an instant paraphrase of this document with our AI Paraphraser
Document Page
(Source: Almanacist, 2014)
The graphs demonstrate that both stock markets have performed better than gold but
the US stock market S&P 100 has performed better than the UK FTSE 100
83
Document Page
CHAPTER 5: DISCUSSION
5.1 Introduction
The data presented in chapter 4 is critically analysed in this chapter. Trends in the
UK, Northern Ireland, Republic Of Ireland property prices and regional buy to let
market factors are examined to determine a business investment strategy. Alternative
opportunity investments in 2017 and current political macro economic factors are
considered.
5.2 Residential Property
5.2.1 UK Residential Property Prices
5.2.1.1 Introduction
Jones and Richardson (2014) discuss how house price cycles are associated
with changes in the economy most notably interest rates, real incomes, mortgage
funds and downturns with overheating. They consider how long term changes are
associated with changes in demographics, subsidies and taxes.
5.2.1.2 Long Term Trends
The results indicate that there is a long term trend of increasing house prices.
It was noted by Glass (2012) how the average house price was £1,520 in 1952, £9,736
in 1977 and £160,000 in 2012 indicating a yield of x105 and x16 times over periods
of 60 and 35 years respectively. These are average values with greater capital gains
being achieved in London. He indicates property is a good long term investment.
5.2.1.3 Factors Affecting Housing Market
Cameron et al (2006) designed an objective model to calculate real estate
prices. They consider long run equilibrium determinants including credit availability
indictors and nominal or real interest rates. They also considered dynamic effects
which included supply side effects, inflation acceleration, national level disposable
income, stock market effects, downside risk and spatial dynamics. Glaeser et al
(2008) demonstrated that it is important to incorporate supply factors when
considering property dynamics. Hilbert and Vermeulen (2016) examined geographic,
84
Document Page
physical constraints, planning policies and regulations. They concluded that prices
would have been 35% lower if it had not been for regulatory building constraints.
Moreover, the IMF (2016) identified the limited supply of property as a cause for high
property prices.
According to Cameron et al (2006) stock market effects were only important
in London and the South East centres of equity, investment and well paid jobs.
However, Yusopova et al (2017) found that the stock market effects were in the
Metropolitan area surrounding London but not in greater London. It was the opinion
of Britton that high property prices were due to loose monetary policy with
quantitative easing increasing demand (Saunders, 2016). Moreover, he explains that
there have been no significant increases in rent above inflation (figure 9) which would
have been expected if there was a true shortage of residential property. Furthermore,
he considers how the government help to buy and joint home ownership schemes
have had an inflationary effect on property prices.
Yusopova et al (2017) analysed the property market over the past 40 years and
identified periods in the late 1980s and the mid 2000s when increased property prices
could not be explained by housing supply relative to demographics, income, credit
availability and spillovers. They concluded these were housing ‘bubbles’ contributed
to by speculation and exuberance.
5.2.1.4 1990s Property Crash
It had been noted by Yusopova et al (2017) that the increase in property prices
in the late 1980s were 224% of the corresponding trend values. Moreover, this
increase was associated with low interest rates, ease of regulation, removal of credit
and exchange controls. Furthermore, price to income ratios increased from 68% in
1987 to nearly 98% in mid 1989, this was followed by an average fall of 60%
property values from 1989 to 1993. Yusopova et al (2017) and Cameron et al (2006)
were both of the opinion that there were additional falls in property prices in areas
affected by the poll tax system to replace domestic rates in England and Wales and
due to the budget announcement in March 1988 to limit the number of mortgage relief
claims.
5.2.1.5 2008 Property Crash
85

Secure Best Marks with AI Grader

Need help grading? Try our AI Grader for instant feedback on your assignments.
Document Page
The UK property prices fall in the 2008 Financial Crisis was much less than
the USA or Republic Of Ireland. Mean UK house prices peaked in June 2008 at
£184,400 and then troughed in March 2009 £157,500 with a percentage drop of 16%
(ONSd, 2017). It was noted by Yusopova et al (2017) how regional house prices
doubled from their peak values in 1989 to peak values in 2007 and then dropped by
20% of their peak values. They were of the opinion that Lehman Brothers collapse in
September 2008 and the effect on the financial markets were significant factors in
contributing to this fall.
5.2.1.6 Regional Variations
Central London was considered a safe investment during the 2008 Financial
Crisis and attracted many foreign investors (BNP, 2016).The UK property market has
been estimated to have approximately £170 billion of foreign investment with
approximately £7 billion of this being to foreign companies registered in tax havens
(Fearn, 2016). London has grown significantly as a World Financial Centre since the
1980s and property prices exceed most international capital cities. It had been noted
by Yusopova et al (2017) how the property prices increased relatively more in
London in the late 1980s with price-income affordability ratios of 130% in London
the highest reported in the UK at that time.
There has been a ripple effect documented in the literature were house price
changes in Greater London spread out to effect neighbouring regions with a time lag
(MacDonald and Taylor 1993; Alexander and Barrow 1994; Drake 1995; Meen 1995;
Cook and Thomas 2003; Holly et al 2010). Moreover, these effects become less for
regions further away from London.
There was much variation in the regions of the UK property prices affected by
the 2008 recession with London being least affected and Northern Ireland most
affected. Prices of the higher value properties in central London have fallen recently
(Gardner, 2017) due to decreased growth in the economy and concerns regarding
financial companies moving jobs from London as a consequence of Brexit.
5.2.1.7 Northern Ireland
Northern Ireland has historically been the poorest region of the UK being
geographically separated by the Irish Sea and these economic difficulties were
compounded by 30 years of violence during which there was minimal foreign
86
Document Page
investments. It has the smallest UK economy at £27.4 billion but has a greater GDP
per capita at £15,200 than only 2 other UK regions Wales and North Eastern England
(European Commission, 2017). Northern Ireland has been excessively reliant on the
block grant subsidy from Westminister, receiving £11.334 billion in 2015-2016
(NICVA, 2016). The economic output per head is 73% of the UK average and the
unemployment rate of 5.6% is the second highest in the UK (Pannell, 2017). As a
result property prices in Northern Ireland have traditionally been lower than most
other regions in the UK.
Yusopova et al (2017) considered the property market in Northern Ireland and
their analysis indicated that it was the only region in the UK where property prices did
not increase significantly in the 1980s indeed prices were below their estimated trend
levels.
Moreover, they discuss how property prices in Northern Ireland increased 6 fold from
1989 to 2007 the greatest increase anywhere in the UK. Furthermore, they observe
this was the most volatile region with the greatest drop after the recession. There were
differences within areas of Northern Ireland with the areas bordering the Republic of
Ireland being most affected.
Northern Ireland property prices peaked in the third quarter of 2007 at
£224,670, the largest increase in value was from 2005 to 2007 when prices effectively
doubled. The trough was in the first quarter of 2013 at £97,428 with a drop of 57%
(Housing Executive, 2015). The increases in price can be contributed by the period of
relative peace, the rapidity of the increase and decrease mirrors the economic changes
and property market in the neighbouring Republic Of Ireland.
The effect of the recession and the poor recovery were exacerbated by the
reduction in public spending, 1 in 3 in jobs are in the public service compared to 1 in
5 in Great Britain (Simmonds, 2015). The reduction in public spending resulted in a
33% budget deficit for the economy.
Since the fall in the property market Northern Ireland has had the most
affordable property in the UK with price to income ratio less than the UK average of
6,whereas in 2007 this ratio was 13 (University Of Ulster, 2016). The recovery was
initially strongest in the Greater Belfast area from 2012 (University Of Ulster, 2017).
It was noted by Ramsey how there had been minimal increases in property value in
Strabane and Londonderry/Derry (2015). It was the opinion of Boyd (2017) that the
87
Document Page
greatest recent increases of property prices in 2016 were in the regions further from
Belfast which had shown least previous appreciation since the recession.
5.2.1.8 Housing Tenure
Social housing commenced in the UK in 1919 and became mainstream after
the Second World War. The proportion of the population living in social housing has
been reduced significantly from approximately 42% in 1979 to 8% now (Harris,
2016).
The policy of right to buy introduced by the conservative government in the
1980s offered council tenants the option to buy their residential property at a
discounted cost with previous rental contributions counted towards the purchase
(Department for communities and local government, 2017). The reduction in stock of
housing executive property was exacerbated by the inadequate building program to
replace properties sold. It was noted by Paris et al (2015) how the Northern Ireland
private rental market increased from 8% to 16.5% from 2001 to 2011 and during this
period the social housing stock was reduced from 18% to 11%. Moreover, there is a
greater demand for private rental properties by the group of tenants who have their
rent supplemented or subsidised by social security payments as a consequence of the
reduction of council housing executive property now available.
Furthermore, these opportunities may be threatened if there is a large number of
council/ housing executive properties built.
Currently, the lack of affordable housing is an important political issue in the
UK as home ownership has declined since 2005 especially among young people, there
is less social housing available and rents are increasing. Jeremy Corbyn the Labour
Party leader has pledged to build a million new homes including at least half a million
council properties within 5 years if he is elected as Labour Prime Minister
(Jeremyforlabour, 2017). These policies are very popular with the electorate and
would significantly reduce the demand for private rentals in this sector of the market.
The conservative party in 2015 had pledged to build a million properties by 2020 but
did not commit to a specific number of council/housing executive properties.
5.2.2 Republic Of Ireland Property Prices
The Republic Of Ireland real house prices increased at a rate of 9% per annum
from 1995 to 2007 on average, the OECD country with the next highest rate of
88

Paraphrase This Document

Need a fresh take? Get an instant paraphrase of this document with our AI Paraphraser
Document Page
increase was 7.6% (CSO 2012;CSOa 2017;CSOb 2013;CSOc 2017). The average
house price, inflation corrected increased by 193% from 1994 to 2006 and by 246% in
Dublin (Department of Environment Community & Local Government, 2017). This
was a consequence of a prosperous economy, easing of credit and tax policies which
encouraged purchasing and investment in property.
From the peak in the second quarter of 2007 to the trough in the second
quarter in 2012 house prices fell by 50.3%. The Irish economy was significantly
affected by the recession which resulted in unemployment increasing from 4.5% to
14%. There had been a building boom of houses in parts of Ireland before the
recession encouraged by increasing property prices. This resulted in an oversupply of
property in many parts of the country made worse by much of the population
emigrating to find employment. Boland (2016) discusses how at the peak of the
housing boom 90,000 properties were being built per year but many in undesirable
rural areas. In 2015 only 13,000 properties were built despite a need for 25,000 per
year mostly in the Dublin area.
Properties prices have increased 47% from their lowest levels of the recession
(Daft.ie, 2017). The OECD (2017) has warned of a potential future property bubble as
property related loans and prices have increased significantly since 2013. Tobin
(2017) considers how recent policy decisions have inflated property prices such as the
help to buy scheme (Revenue, 2017c) and The Central Bank Of Ireland’s decision to
remove the maximum value on first time buyer mortgages (Central Bank Of Ireland,
2017). The IMF (2017) advised that prudent lending should be continued and warned
about recent measures taken to increase affordability amplifying pressures in the
market.
It was noted by Tobin (2017) that the average house price was approximately
9 times the average income in 2007 at the peak in comparison the UK was under 6
times even although it also was in a property bubble. Moreover, the current average
house price to average income ratio is now just under 6 times indicating that a bubble
may be developing again (figures 8 and 21). It was the opinion of Tallon that the Irish
market has become much more difficult in the past 2-3 years for buy to let investors
who are competing with institutional investors, housing bodies and local authorities
(Craddon, 2017). She uses the analogy of ‘fighting for scraps’ as prices have
increased and suitable investment property has become scarce.
89
Document Page
5.2.3 Property Repossessions
The rates of repossessions in the USA reached record levels as a result of the
2008 Financial Crisis. The number of repossessions in the UK was relatively low in
comparison to the USA, other EU countries and other UK housing market downturns
for example in the late 1980s.
Turner (2009a) discusses how the relatively low number of repossessions and
low proportion of mortgages in arrears at 2% (Bank of England 2011) can be
accounted for by the greater tolerance demonstrated by the UK banks. Moreover, he
considers how the banks adopted policies such as interest only mortgages to assist
homeowners in difficulties (2009b). It was noted by Stephens and Quilgars (2008)
how the number of mortgages in arrears was relatively high for subprime at 6.5%
compared to prime mortgages at 0.8%. Lea (2012) indicates how lower interest rates
made it easier for property owners to finance their mortgages contributing to the
comparatively lower number of repossessions in comparison to the early 1990s.
O’Brien and McCaffrey (2013) noted how the repossession rate in the
Republic Of Ireland was relatively lower at 0.25% in comparison to the UK and USA
in 2013 where the rates were 3% and 5% respectively. Moreover, they explain
contributing factors which included lenders desire to avoid fire sales which would
reinforce losses and further contribute to the cycle of reducing prices. Furthermore,
the government had a temporary ban on repossessions for 12 months which prevented
repossessions in 2010 (Central Bank of Ireland, 2010).They explained how the Irish
government passed a new law which contained an unintentional error (lacuna) which
rendered all repossessions almost impossible until it was fixed, this was not amended
until May 2013.
It was noted by Lynch (2012) how the Fianna Fail/Green coalition government
introduced the MARP (Mortgage Arrears Resolution Process) system for considering
arrears cases within banking institutions administered by an Arrears Support Group.
He discusses how if the mortgage is not sustainable options include assisted sale or
voluntary possession and the appeals process to an internal board or to the Financial
Services Ombudsman.
Wilcox (2010) explains how the DIS (Deferred Interest Scheme) is an
arrangement whereby the borrower pays a proportion of the interest with the
remainder being accumulated into a deferred account for up to 5 years but to avail of
90
Document Page
this option the borrower has to dispose of assets. He compares this to the HMMS
Homeowner Mortgages Support System in the UK.
The number of repossessions in the Republic Of Ireland has been increasing
since 2010 and significantly since 2014 (Central Bank Of Ireland, 2017), this is in
contrast to the UK and USA where numbers have been decreasing. Northern Ireland
had a relatively higher number of repossessions than Great Britain or the Republic Of
Ireland from 2008-2013. There were more than 3000 homes repossessed per year in
Northern Ireland from 2008- 2014 (NIHE, 2015) and there were relatively more
repossessions in the cities of Belfast and Londonderry/Derry.
Repossessed properties often are sold below the current market value. There
are additional expenses for the seller the longer the property remains unsold. The
properties are marketed for a limited period of time often for less than a month and
then sold to highest bidder during that period. Most of the recently repossessed
properties in Northern Ireland are from the lower end of the market and many had
previously been buy to let investment properties.
5.2.4 Northern Ireland Buy To Let Market
5.2.4.1 Tenure
In Belfast there is a market for students and professionals but elsewhere the
markets for these groups are limited. Cavaglieri (2014) discusses how student rentals
offer relatively high rental yields. There is more likely to be property damage and
leases are short term usually 9-12 months which adds extra work and expense. The
HMO House of Multiple Occupancy license is required which can be limited to a
specific proportion of properties in the area. They require additional features to be
added to the properties and may involve regular inspections to maintain the license.
The advantages of professional rentals are that there is unlikely to be damage
and the rental payments are made reliably but tenancies are short term. Disadvantages
include the requirement to furnish the property to a high standard and low rental
yields.
The main rental sector outside Belfast are social security assisted tenants who
are often unemployed or on low incomes with their rent either paid or subsidised by
the government. Risks of renting to this group include the higher likelihood of
property damage and non payment of rent.
91

Secure Best Marks with AI Grader

Need help grading? Try our AI Grader for instant feedback on your assignments.
Document Page
5.2.4.2 Rental Incomes
Rental incomes in Northern Ireland are modest at approximately £350- 400
per month in most of the smaller cities or towns such as Armagh, Enniskillen and
Coleraine for lower end of the market properties costing £60,000. Rents are typically
higher in Belfast at £450-£500 per month but these properties are more expensive
with purchase prices of approximately £75,000. In Londonderry/Derry higher rents of
£400-£500 per month can be achieved for the lower end properties with a purchase
costs of approximately £50,000- £60,000.
5.2.4.3 Estate Agent Fees
Fees in Belfast are consistently in excess of 12% per month, plus 1 month rent
as a tenant finder fee, plus inventory/inspection photograph fees all with vat added.
These fees add up to almost 40% of the rent before payment for repairs or upgrades
which are also relatively more expensive. Many estate agents have minimal input, use
expensive contractors and take no responsibility in management problems such as lost
rent. In the smaller cities/towns in Northern Ireland such as Armagh, Enniskillen and
Coleraine estate agents charge a minimum fee of half a month’s rent finders fee, plus
10% management fee plus vat. The lowest fees available are 10% management fee
plus vat which are available in Londonderry/Derry.
5.2.4.4 Londonderry/Derry
Londonderry/Derry is the second largest city in Northern Ireland after Belfast
and the fourth biggest city in Ireland after Dublin, Belfast and Cork. The city has a
population of approximately 108,261 (CSO, 2011). The city is a fraction of the size of
Belfast or Dublin and is relatively poor with relatively low median wage of £16,580
and high unemployment at 8% (Campbell, 2015).
There is a high demand for unfurnished social housing rentals in the city
centre. In Northern Ireland banks have been prepared to issue more favourable loans
and mortgages for properties in Londonderry/Derry and Belfast despite
Londonderry/Derry being a much smaller city than Belfast.
92
Document Page
5.3 Alternative Investment Opportunities
5.3.1 Commercial Property
According to Baum (2012) commercial property has historically been more
profitable with higher yield and return than residential property in the UK. Aldermore
(2015) considers advantages which include longer leases and that the tenants take
responsibility to cover costs of maintenance and repairs. Smaller commercial
properties may be priced similarly to houses but larger office blocks, shopping centres
or industrial complexes are much more expensive and will require most investors to
use alternative means of funding such as a collective investment scheme. It was noted
that disadvantages include the greater cost of setting up mortgages and their greater
influence to economic changes.
Grahame highlights how the credit losses on buy to let properties have been
documented by The Bank Of England to be twice those of owner occupied property
(Thorpe, 2016). This has been an important political issue focusing greater attention
by government and regulators to motivate policy changes resulting in additional
taxation costs thus reducing profit. Therefore, he considers commercial property a
relatively more attractive investment in view of these changes.
It was noted by Nowlan (2015) that commercial property had 3% greater
returns than residential property until the 1990s. Moreover, tax relief on mortgages
and grant subsidies had previously biased residential property in favour of the owner
occupier rather than the investor. Furthermore, institutional investors such as pension
funds and life assurance companies are now actively investing in residential property
while reducing their stock of commercial property.
Since the 2008 Financial Crisis there have been many town centre high street
commercial properties vacated as these businesses are now less profitable. Many
shoppers prefer to either buy online or in less expensive out of town supermarkets and
retail parks where parking is easy and free. Additional costs associated with
commercial property for investors include the property tax/land rates/ council tax
during void periods which can be 3 times those for residential properties. Commercial
property has a lower rate of capital gains tax in the UK on resale with rates 10% and
20% for lower and higher rate tax payers respectively, the respective rates for
residential property are 18% and 28% (Finnegan Gibson, 2017).
93
Document Page
5.3.2 Cash Deposit Accounts and Interest Rates
Investing in fixed term or variable cash accounts involves no risk if the
accounts are below the FSCS Financial Services Compensation Scheme limit of up to
£85,000 in the UK as they are guaranteed by the government (FSCS, 2017). Many
banks offer online or postal accounts offering higher interest rates than branch
accounts and most have the FSCS protection.
Mortgage and savings rates have been gradually decreasing since 2009 and are
at their lowest levels ever despite the Bank Of England base rate having been low
since 2009. UK bank interest rates for variable savings accounts are now higher than
fixed term accounts (Uswitch, 2017). Depositing cash in variable rate accounts has the
advantages of security if the amounts are below the FSCS threshold and the money
can be taken out without penalty if better investment opportunities become available.
The Bank Of England’s Monetary Policy Committee (MPC) sets the base rate
of interest in the UK. Monetary policy has been to reduce interest rates in order to
reduce inflation CPI to the target of 2%. As the inflation rate had increased to 2.9% at
the 13 September 2017 meeting it was decided to keep the base interest rate at 0.25%
rather than increasing it (Bank Of England, 2017).
In Ireland base interest rates cannot be altered nationally but are controlled by
the European Central Bank and these rates are also at an all time low of 0.00%. The
average variable mortgage interest rate in Republic Of Ireland is 3.45%, higher than
the Euro area average of 1.82% (Central Bank Of Ireland, June 2017). In Ireland
saving deposit rates have also gradually declined since 2009 with few banks offering
any more than 0.5% for long fixed term or instant access (Bonkers, 2017).
5.3.3 Comparison Of Stock Market and Shares versus Property
The most rapid increase in property prices in the USA was in 2004-2005
which followed strong GDP growth in 2003. The peak US median house price drop
was 34% from $230,200 in July 2006 to $151,000 in November 2011 (Global
Property Guide 2017a;FHFA 2017). Shiller (2005) argues that property in the USA
has never been a good investment with a real return corrected for inflation of 0.6%
from 1890 to 2004 and accurately predicted the property bubble would burst. He was
of the opinion that houses are a consumable product in similar ways to a motor car in
that it depreciates with advances in technology. Askola (2016) argued that there were
94

Paraphrase This Document

Need a fresh take? Get an instant paraphrase of this document with our AI Paraphraser
Document Page
many flaws in Shiller’s methodology including that rental income was not included in
the calculation. Moreover, that average house prices were used rather than comparing
with properties specifically bought for investment and that profits of other
investments are not corrected for inflation. Furthermore, he discussed how Buffet had
recommended US family homes as a better investment than shares in 2012.
It was posited by Harris (2007) that there were periods when one investment
type has performed relatively better, for example from 2001 to 2006 property
performed better than shares. Property and stock market cycles often occur at the
same time with recessions adversely affecting both markets. Apergis and Lambrinidis
(2011) discuss how these cycles are similar in the USA and UK.
According to Carlson (2015) property and the FTSE 100 shares have increased
similarly in capital value (figure 40). Moreover, using estimates that in the 1980s
residential property yields were 8-10% and share yields 2.5-5.5% he calculated that
property and shares increased in value by 12.28% and 8.01% on average per year
respectively. Furthermore, he considers since the increase in house prices rental yields
are now relatively lower at 5-6% gross and average house prices are now 7.43 times
the average national wage whereas the long term trend or average was 5. He predicts
that prices are unlikely to continue to increase at this rate and no longer recommends
investment in residential property unless specific properties are available with high
rental yield. He discusses how in 2015 the P/E ratio (ratio of the company stock price
to earning per share) was marginally above the average of 15 so he suggested shares a
better investment at that time. P/E ratios have subsequently risen to 30 indicating that
shares are also overvalued.
OShea (2016) calculates average UK property increases in value from 1952 to
2015 at 7.74% per year with a net rental income value of 3% to give a total yield of
10.74% per year. He compares this to the average S&P 500 increases from 1965-2014
which are calculated at 9.84%. Using information from HSBC he estimates yearly UK
property gains to be 3.05% in 2015 and S&P Earnings yields to be 6.2%. There is no
explanation given why UK property was not compared to the UK stock market rather
than the USA stock market although the US stock market has performed better than
the UK stock market (figure 42). Investing in a foreign stock market can involve
greater transaction costs, loss of profit in the foreign exchange, taxation of dividends
at source in the foreign country and ISAs are not exempt from taxation (Evans, 2013).
95
Document Page
Connolly discusses how shares are more volatile in that they often go
downwards as well as upwards (Murray West, 2016). OShea (2016) indicates that
shares are deemed to be a more risky investment because a company can become
bankrupt with the result that all the equity in the investment is lost. Connolly
describes how investment in shares allows greater diversification geographically, by
sector and size of company (Murray West, 2016).
McDermott considers the significant additional fees involved with buy to let
property investment and the void periods with no rent (Knight, 2013). Property is
associated with significantly more transaction costs than shares which include buyer
tax (stamp duty), solicitor fees, property registration fees, mortgage administration
fees and estate agents fees. Moreover, in addition there are recurring costs which
include insurance, rates/property/council tax, estate agents management fees,
gardening fees, decorating and repair costs. Furthermore, these tasks or their
organisation involves additional work and time, many of these tasks can be delegated
but this reduces profits.
OShea (2016) explains how leverage can be used with property purchases to
gain higher returns but how it can significantly reduce equity when prices fall. He
discusses how shares can be invested in more tax efficient structures such as in ISA
portfolios and pension funds.
Stock markets including the FTSE 100, German Dax, Dow Jones and MSCI
All Country World Index are at all time highs so it would be expected that they are at
the upper part of the cycle and due a correction. Cunningham (2017) discusses a
survey of Bank Of America Merrill Lynch global fund managers which considered
stocks more overvalued than in 1999 before the ‘tech’ bubble. Professor Shiller has
advised investors to be cautious as markets valuations are ‘unusually high’, his CAPE
(cyclically adjusted price to earnings ratio) demonstrated that only in 1929 and 2000
were valuations higher. Faber has predicted that stocks will fall by 40%
5.3.4 Bonds and Gilts
These are considered less risky than shares but with lesser yields. Unlike cash
bank deposits there is a risk of loss of some or all of the investment. There is a risk of
losing the capital if the company becomes bankrupt but bond holders are paid before
the shareholders (Suter, 2016). The riskiness of the investment is determined by the
stability of the company. Gilts are bonds issued by governments and are generally less
96
Document Page
risky. Government bonds are currently performing poorly especially in comparison to
stock (Trading Economics 2017a;Bloomberg, 2017). Some bonds have recently
produced negative yields so are currently a high risk low yield investment.
Schmelzing (Bloomberg, 2017) has discussed a bond bubble and has predicted future
bond losses driven by inflation.
5.3.5 Precious Metals
These have been an attractive investment in times of recession although the
long term trends indicate that they perform more poorly than property or shares. It
was noted by St Angelo (2017) how precious metals increased significantly in value
in 2008 with silver performing better than gold. Moreover, he predicts that the stock
market is due a correction and that when this happens precious metals are going to
increase in value. Furthermore, Sahu (2016) advises that silver is a better investment
because its price had fallen.
5.4 Political Factors
5.4.1 UK Tax Reforms
Davidson (2016) discusses changes introduced in the UK since April 2017
limiting tax relief on mortgage payments. According to McLaughlin (2017) this will
result in rent being taxed rather than profit. In addition the minimum 3% stamp duty
tax on purchase cost (HMRC, 2017) to second properties has resulted in buy to let
property investment becoming much less tax efficient and profitable.
5.4.2 Republic Of Ireland Taxation
Likewise in the Republic of Ireland investors with more than 1 property pay
stamp duty tax but this is relatively lower at 1% of the purchase price. Burns (2016)
explains how the rental income is liable to income tax, USC (universal social charge)
and PRSI (pay related social insurance), the rates for higher rate tax payers are 41%,
7% and 4% respectively. Thus, rental income is effectively taxed at a rate of 52%.
Moreover, the capital gains tax is more penalising than the UK as rate was increased
from 20% to 33% when the property is sold. Furthermore, tax is paid on the full
increase in value as there is no personal allowance which makes this investment much
less tax efficient.
97

Secure Best Marks with AI Grader

Need help grading? Try our AI Grader for instant feedback on your assignments.
Document Page
In contrast to the UK the Republic Of Ireland has reversed the limitation of tax
relief on mortgage payments introduced in 2009 to generate additional tax revenue
(Rudgard, 2016). Moreover this policy had previously been withdrawn in 2002 after
just 4 years of implementation due to increasing rents. Rents have been increasing
progressively in Ireland since 2013.
5.4.3 Limited Company
It was recommended by Hargreaves that higher rate tax payers purchase
properties within a company to save tax especially in view of the recent changes
limiting mortgage tax relief (Suter, 2017). Advantages include that the rental income
is taxed at the corporation rate which is currently 19% in UK and will drop to 17% by
2020 (HMRC, 2017), income could then be reinvested within the company.
However there are additional costs to extract income from the company.
Income can be extracted as a dividend at rates of 7.5% and 32.5% for lower
and higher rate tax payers respectively so effectively would be taxed at rates of 24.5%
and 49.5%. Moreover, Pickford (2017) highlighted that the tax free dividend
allowance will be reduced from £5000 to £2000 by 2018.
Furthermore, on selling the property corporation tax is liable and 10%
entrepreneur capital gains relief so effectively the taxation rate of 27%. This would be
liable on the full increase in value in contrast to an individual who can avail of the
yearly annual tax free allowance of £11,300. According to Mauder (2017) many
mortgage companies do not offer loans to companies and those offered are typically at
0.75-1.5% higher interest rates and have greater administration fees. Many higher rate
tax payers extract income at a lower rate of tax by paying salaries to spouses or
children over 18 years. Otherwise using the company is only more tax efficient if the
income is being reinvested within the company or if the investor’s tax status is likely
to change in the future at which time the income can be extracted at a lower rate of tax
for example retirement.
5.4.4 Brexit
The Brexit vote and triggering of article 50 has slowed the UK economy,
weakened the sterling currency and increased inflation (Giles, 2017). There was much
speculation from both sides of the debate regarding the economic implications for the
UK of leaving the EU. The Brexit campaigners argued that the UK was a net
98
Document Page
contributor with a yearly contribution of 11.5 billion euros so would benefit from
leaving the EU. The British Institute For Fiscal Studies (2016) and most economists
(Iancu and Gheorghe, 2016) predicted that the economy would be worse off as a
consequence of trading costs and less foreign investment.
A hard Brexit is a term phrased when little or no agreement is made between
the UK and the other EU trading countries regarding import and export tariffs, the
WTO (World Trade Organisation) would impose tariffs which could be up to 50% of
the value on products such as meat.
Brexit has implications for the economies of the United Kingdom in particular
Northern Ireland as well as the Republic of Ireland. Of the 26 most deprived areas in
the UK defined as GDP/capita less than £14,200 two are in the Western and Southern
border areas of Northern Ireland (Marshall and McBurney, 2010).This includes the
border towns Londonderry/Derry, Enniskillen, Armagh and Newry.
The Northern Ireland economy has traditionally been more agriculture based
than the remainder of the UK. The Republic Of Ireland is Northern Ireland’s most
important export market outside the UK accounting for £3.4 billion, more than a third
of foreign exports (NISRA, 2017a).
Ireland’s biggest trading partner is the UK (Department Of Foreign Affairs
and Trade, 2014), exporting 14.7 billion euro worth in 2015 and importing 19.9
billion euro worth in 2015 (British Irish Chamber Of Commerce, 2015). The UK buys
55% timber and construction exports, 50% of Irish beef exports and 42% Irish food
and drink exports. Ireland’s manufacturing and supply chains also rely on UK imports
(Trading economics, 2017b).
There had been customs controls on the border from April 1923 soon after the
border was formed until 1993 when customs were abolished between EU member
countries as part of a single market. The military checkpoints remained until 2005 and
many of the previously closed roads were reopened as a result of the peace process
and the 1998 Good Friday Agreement. Kelpie (2017) discusses how a return to check
points and border controls would be detrimental and is not desired by any of the
parties involved in the Brexit negotiations. The negative impacts would be especially
in the border towns and communities but no practical alternatives have yet been
decided or agreed (Soars, 2016;Murphy, 2016).
It was noted by Davies (2017) that 13 banks plan to relocate 9,000 jobs from
London to remain within the EU single market these include Goldman Sachs,
99
Document Page
Citigroup, JP Morgan and Standard Chartered. Moreover, Musadiqque (2017)
discusses how JP Morgan and Bank Of America have already made plans to relocate
to Dublin. Furthermore, Dublin has been actively marketed as an alternative English
speaking financial centre in the EU single market with low corporation tax rates
(Deloitte 2017; The Irish Times 2017).
5.4.5 Political Party Changes
There have been other political events which have potential economic
consequences such as the appointment of Leo Varadkar as Taoiseach in Ireland.
Moreover, Theresa May’s disappointing performance in the May 2017 UK general
election and the resulting DUP Democratic Unionist Party’s arrangement in
supporting the current conservative government with their increased influence
especially in the Brexit process (Wade, 2017). Furthermore, Jeremy Corbyn is now
the favourite to be the next UK Prime Minister and his shadow chancellor John
McDonnell has indicated that they would end the Bank Of England’s control over
interest rates (Heath, 2017). Many economists have concerns a return to socialist
policies of the 1970s to the detriment of the economy.
100

Paraphrase This Document

Need a fresh take? Get an instant paraphrase of this document with our AI Paraphraser
Document Page
CHAPTER 6: CONCLUSION
All the study objectives have been achieved and addressed. There are many
macro environmental factors to consider when making investment decisions. The
strengths, weakness, opportunities and threats need to be assessed. Each investor’s
own financial and personal circumstances differ.
Residential property has proven to be a good medium to long term investment.
In 2017 many of the alternative investments are unattractive. Commercial property
constitutes greater risk, the demand is more affected by economic downturns and the
associated property tax costs for void periods are significantly greater. The consensus
is that the stock market is currently overvalued and likely to correct in the short term.
Moreover, when this happens it would represent an investment opportunity.
Furthermore, precious metals, bonds and cash deposits are currently low yield.
In the USA and continental Europe house prices dropped significantly in the
2008 Financial Crisis but these present additional logistical difficulties and risk for an
investor resident in the British Isles.
London has been an attractive option for global property investors and has
been the best performing region for property investors in the UK for the past 25 years.
Recent fall in values may represent future investment opportunities.
In the British Isles property price reductions as a result of the 2008 Financial
Crisis were greatest in Northern Ireland and the Republic Of Ireland. There has been
significant recovery in property prices in the Republic of Ireland and in Belfast prices
already having increased by more than 50% from trough levels. The 2008 Financial
Crisis had affected the properties at the lower or cheaper end of the market
disproportionally more, with some dropping in value by approximately 60-75%.
The recession has resulted in significant amounts of mortgage debt and an
increased number of distressed property sales and repossessions. These can be
purchased below market value provide opportunities to investors although they often
need remedial repair work.
The potential profitability of property investments can be increased
significantly if geared with borrowing. Most property investors gear using mortgages
to amplify profit but unfortunately this can also amplify losses. Moreover, a fall in
value of 75% could place moderately geared properties in negative equity and this
risk would be multiplied by the number of properties in a portfolio. Furthermore an
101
Document Page
increase in mortgage interest rates would make these investments less profitable and
represent increased risk. However, interest rates will inevitably increase and as a
consequence bonds and cash bank deposits investments will become relatively more
profitable.
The recommendation of this research supports a business strategy of investing
in residential property in Londonderry/Derry in 2017. This strategy has a number of
strengths which include that the prices of some properties in this city have had
minimal or modest gains from trough levels in 2008 thus significant increases are
likely. There have been relatively more repossessed properties in this area and these
continue to be available in 2017 allowing purchase below market values. Estate
agency fees and performance are competitive in this city at 10% plus vat. Social
tenants rent properties take long term tenancies of unfurnished properties reducing
work and management costs. Rents are higher than in the smaller towns in Northern
Ireland and rental yields of 8-10% can still be achieved in 2017. The threats or risks
of interest rate increases and the change in taxation on buy to let mortgages can be
mitigated by buying a limited number of properties mortgage free rather than a larger
number of properties which are geared or mortgaged. Risks common to all property
investments include void periods, decreasing rents and possible depreciation. This
policy of not gearing could also be considered a weakness by economists who would
calculate the optimal gearing risk ratio. As Londonderry/Derry is situated near the
border it is at greater risk from Brexit. A strategy of having many properties in one
relatively small city presents a risk of lack of diversification and arguably long term
capital gain increases may not be as great as in a larger city such as Belfast or Dublin.
Property in Dublin especially commercial property has become a more
attractive investment opportunity since Brexit as companies relocate from London to
alternative centres within the EU although due to recent increases in price rental
yields are relatively low.
The author is a higher rate tax payer in the Republic of Ireland where he is
resident so would currently pay effectively 53% tax on rental income in this
jurisdiction. Having UK domicile status with no other taxable sources income in the
UK, rental income on properties in the UK is taxed at the lower rate of 20%.
The author’s investments to date include 6 properties in Londonderry/Derry
purchased since 2014 which includes three purchased in 2017. Five of these have
been repossessions from distressed bank/mortgage company sales. Purchase costs
102
Document Page
were £43,500, £46,000, £60,000, £50,500, £47,000 and £50,000 although the
properties required on average £2000 of repairs. Rents vary from £425-£510 per
month representing yields of 8-12%. The target rental group for these properties are
social tenants with a view to long term leases and low turnover. The properties are all
let unfurnished with an estate agents management fee of 10% plus vat which may be
negotiated downwards due to the increasing number of properties in the portfolio.
Having the properties in one area unfurnished allows for the future option of the
investor self managing the properties thus eliminating estate agent management costs.
In circumstances that the profit of rental income reaches the higher tax band
threshold it may be more tax efficient to place future property purchases into a UK
Ltd as in the company the rent would be subject to the future lower rate of
corporation tax of 17% rather than the 40% higher rate of tax. This income could be
retained in the company for reinvestment with a view to extraction from the company
if future circumstances and tax status change. The company could be used to purchase
property in the United Kingdom or Republic Of Ireland. Tax liable on selling the
property would be 27% (17% corporation tax plus 10% entrepreneur’s relief). These
recommendations should be reviewed on a biannual basis.
103

Secure Best Marks with AI Grader

Need help grading? Try our AI Grader for instant feedback on your assignments.
Document Page
CHAPTER 7: PERSONAL DEVELOPMENT/STATEMENT
My work background is that I am 25 years into non financial/business career. I
have had a long term interest in setting up a business but have minimal management
and business experience. Completion of this project has helped develop knowledge,
managerial, leadership, problem solving, decision making, analytical and critical
thinking skills. It has given the opportunity to integrate theory into practice, applying
knowledge and skills learned.
104
Document Page
REFERENCES
Adam, S., Browne, J., Phillips, D., Roantree, B., 2015. Institute For Fiscal Studies.
Nuffield Foundation. Room Found For Tax Cuts Despite Overall Tax Rise.
[online] Available from: http://election2015.ifs.org.uk/taxes. [Accessed 4
August 2017]
Adam, S., Roantree, B., 2015. UK Tax Policy 2010–15: An Assessment. Institute For
Fiscal Studies. Nuffield Foundation. Fiscal Studies, 36(3), 349-373
Available from: https://www.ifs.org.uk/publications/8046 [Accessed 4 August 2017]
Alexander, C., Barrow, M., 1994. Seasonality and Cointegration Of Regional House
Prices in The UK. Urban Studies, 31(10), 1667- 1689
Almanacist, 2013. Long Term Trend of UK Market. The Harriman Stock Market
Almanic. [online] Available from:
http://stockmarketalmanac.co.uk/2013/04/long-term-trend-of-the-uk-market/
Almanacist, 2014. FTSE100 1984-2013 price performance. The Harriman Stock
Market Almanic [online] Available from:
http://stockmarketalmanac.co.uk/2014/01/ftse-100-index-1984-2013-price-
performance/
Anderson, S., Clarke, B., Hill, G., 2016. CML Council Of Mortgage Lenders.
Repossessions and arrears still falling, reports CML. [online] 12 May 2016.
Available from: https://www.cml.org.uk/news/press-releases/repossessions-and-
arrears-still-falling-reports-cml/ [Accessed 4 August 2017]
Ashton, T.S., 1959. Economic fluctuations in England, 1700–1800. Oxford:
Clarendon Press
Askola, J., 2016. Why Robert Shiller Is Wrong About Home Ownership. Seeking
Alpha. [online] 1 August 2016. Available from:
https://seekingalpha.com/article/3994040-robert-shiller-wrong-home-
ownership?page=3
Apergis, N., and Lambrinidis, L., 2011. More Evidence on the Relationship between
the UK Stock and the Real Estate Market. Briefing Notes in Economics, (85), 1-
5
Balenthiran, K., 2017. The 17.6 Stock Market Cycle, Connecting the Panics of 1929,
1987, 2000 and 2007. [online] Available from:
105
Document Page
http://www.17yearstockmarketcycle.com/2016/08/historic-ftse-100-trailing-
price.html
Bank of England, 2011. Trends in Lending. London, Bank of England. [online]
Available from: http://www.bankofengland.co.uk/publications[Accessed 4
August 2017]
Bank of England, 2015. Statistical Interactive Database, accessed on 4 January 2015;
effective exchange rate index published by the Bank of England (series
XUMABK67). [online] Available from:
http://www.bankofengland.co.uk/boeapps/iadb/fromshowcolumns.asp?
Travel=NIxIRxSUx&FromSeries=1&ToSeries=50&DAT=RNG&FD=1&FM=J
an&FY=1963&TD=30&TM=Jul&TY=2017&VFD=Y&html.x=17&html.y=13
&CSVF=TT&C=5UW&Filter=N [Accessed 4 August 2017]
Bank Of England, August 2017. Monetary policy summary and minute of monetary
policy committee meeting ending 13 September 2017. [online] Available from:
http://www.bankofengland.co.uk/publications/minutes/Documents/mpc/pdf/
2017/sep.pdf[Accessed 4 October 2017]
Banks, A., Hamroush, S., Taylor, C., Hardie, M., 2014. An International Perspective
on the UK - Gross Domestic Product. Office of the Chief Economic Adviser.
Office Of National Statistics. Available from
http://webarchive.nationalarchives.gov.uk/20160105160709/http://www.ons.go
v.uk/ons/dcp171766_360847.pdf [Accessed 4 August 2017]
Balke, N.S., and R.J. Gordon., 1986. Appendix B: Historical Data, in The American
Business Cycle: Continuity and Change, In R. J. Gordon. NBER Studies in
Business Cycles, Vol. 25. Chicago: University of Chicago Press, 781850.
Barnett, A., Broadbent, B., Chiu, A., Franklin, J., Miller, H., 2014. Impaired capital
reallocation and productivity. National Institute Economic Review, (228), 35–48
Available from:
http://journals.sagepub.com/doi/pdf/10.1177/002795011422800104 [Accessed 4
August 2017]
Barro, R.J., and Jin, T., 2011. On the Size Distribution of Macroeconomic
Disasters. Econometrica, 79(5),156789
Barro, R.J., 1987. Government spending, interest rates, prices, and budget deficits in
the United Kingdom, 1701–1918. Journal of Monetary Economics, 20(2), 221–
47
106

Paraphrase This Document

Need a fresh take? Get an instant paraphrase of this document with our AI Paraphraser
Document Page
Baum, A., 2012. Commercial Real Estate Investment. (2nd edn) Hoboken:Taylor and
Francis.
BBC. 2017. Education revision guides. Britain, Northern Ireland and The Republic of
Ireland 1932-1949. The Economic War. [online] Available from:
http://www.bbc.co.uk/education/guides/zs27xnb/revision/1 [Accessed 4 August
2017]
Bezemer, D., 2009. Why some economists could see the crisis coming. Financial
Times.[online] 7 September 2009. Available from:
https://www.ft.com/content/452dc484-9bdc-11de-b214-00144feabdc0
Bloomberg, 2017. Rates and Bonds. [online] Available from:
https://www.bloomberg.com/markets/rates-bonds [Accessed 4 August 2017]
Blumberg, B., Cooper, D.R. and Schindler P.S. (2005) Business research methods,
Maidenhead:McGraw-Hill.
Blundell, R., Crawford, C., Jin, W., 2014. What can wages and employment tell us
about the UK’s productivity puzzle?, Economic Journal (124),377–407
BNP Paribas Real Estate, 2016. The Case For UK Property. [online] Available from:
https://www.realestate.bnpparibas.co.uk/upload/docs/application/pdf/2016-02/
the_case_for_uk_property_-_february_2016.pdf?id=p_1654170 [Accessed 4
August 2017]
Boland, V., 2016. Ireland: Too many houses in the wrong places. Financial Times
[online] 21 June 2016. Available from: https://www.ft.com/content/ba41c19e-
3478-11e6-ad39-3fee5ffe5b5b[Accessed 4 August 2017]
Bonkers.ie, 2017. Compare Saving Accounts. Available from:
https://www.bonkers.ie/compare-savings-accounts/search/ [Accessed 4 August 2017]
Bordo, M.D., and Haubrich, J.G., 2010. Credit Crisis and money contractions: an
historical view. Journal of Monetary Economics, 57(1), 1-18
Bordo, M. D., and J. S. Landon-Lane J.S., 2012. The Global Financial Crisis of 2007–
2008: Is It Unprecedented? In: M. Obsfeld, M.,D. Cho, D., and A. Mason A.,
eds. 2012. Global Economic Crisis: Impact, Transmission and Recovery.
Cheltenham, UK: Edward Elgar, 19-56
Bordo, M.D., and Haubrich, J.G., 2017. Deep Recessions, Fast Recoveries, and
Financial Crises: Evidence From The American Record. Economic Inquiry,
55(1), 527-541
107
Document Page
Boyd, M., 2017. Ulster University Reveals A Slowdown In Northern Ireland Housing
Market. University Of Ulster.[online] Available from:
https://www.ulster.ac.uk/news/2017/february/ulster-university-research-reveals-
a-slowdown-in-northern-ireland-housing-market[Accessed 4 August 2017]
British Irish Chamber Of Commerce, 2015. Value of goods imports and exports
between the UK and Republic of Ireland 1996-2015. Available from:
http://www.britishirishchamber.com/value-of-goods-1996-2015/ [Accessed 4
August 2017]
Bruner, R.F., Carr, S.D., 2009. The Panic Of 1907: Lessons Learned From the
Market’s Perfect Storm. Hoboken, New Jersey: John Wiley
Bryan, B., 2016. One of The Deepest Wounds of the US Financial Crisis has finally
healed. Business Insider UK. [online] 13 May 2016. Available from:
http://uk.businessinsider.com/us-delinquency-and-foreclosure-rate-down-2016-
5?r=US&IR=T [Accessed 4 August 2017]
Businesscycles, 2017. Recession definition. [online]
http://businesscycles.info/recession-definition/ [Accessed 4 August 2017]
Bryman, A. and Bell, E. (2003) Business Research Methods, Oxford, Oxford
University Press.
Burns, L., 2016. Landlord’s Guide To Irish Tax and Property. [online] Available
from: https://liamburnsandco.ie/landlords-property-tax-guide/ [Accessed 4
August 2017].
Caine, P.J., and Hopkins, A.G., 2002. British Imperialism, 1688-2000. UK: Pearson
Education
Cameron, G., Muellbauer, J., Murphy, A., 2006. Was There A British House Price
Bubble? Evidence From A Regional Panel. Centre For Economic Policy
Research Discussion Paper 5619
Cambpell, C., 2015. Derry and Strabane District Council. The Detail. [online] 4 June
2015. Available from: http://www.thedetail.tv/articles/derry-strabane
Canocchi, C., 2016. Millenials struggle to buy a home as they spend 53k on rent by
the time they hit 30 – 44k more than their parents generation. This Is Money.
[online] Available
from:http://www.thisismoney.co.uk/money/mortgageshome/article-3693284/
108
Document Page
Millennials-struggle-buy-home-spend-44k-rent-parents-generation-time-hit-
30.html[Accessed 4 August 2017]
Capie, F., and Wood, G., 1997. Great Depression of 1873–1896. In Glasner, D.,
Cooley, T.F. Business cycles and depressions: an encyclopedia. New York:
Garland Publishing, 148–49
Capozza, D.R., and Van Order, R., 2011. The great surge in mortgage defaults 2006-
2009: the comparative roles of economic conditions, underwriting and moral
hazard. Journal of Housing Economics, (20)1, 141-151
Carlson, S., 2015. Property Or The Stock Market- Which Gives The Best Returns?
Linkedin. [online] Available from: https://www.linkedin.com/pulse/property-
stock-market-which-one-gives-best-returns-steve[Accessed 4 August 2017]
Cavaglieri, C., 2014. If You Want To Let To Students Then Do Your Homework. The
Independent. [online] 1 February 2014. Available from:
http://www.independent.co.uk/property/house-and-home/property/if-you-want-
to-let-to-students-then-do-your-homework-9101637.html[Accessed 4 August
2017]
Central Bank of Ireland, 2010. Code of Conduct on Mortgage Arrears. Dublin:
Central Bank of Ireland
Central Bank Of Ireland, 2016. Review Of The Residential Lending Requirements.
[online] Available from:
https://www.centralbank.ie/docs/default-source/financial-system/macroprudential-
policy/policy-documents/2016-review-of-residential-mortgage-lending-
requirements.pdf?sfvrsn=8[Accessed 4 August 2017]
Central Bank Of Ireland, 2017. Mortgages Arrears and Publications Releases.
Available from:
https://www.centralbank.ie/polstats/stats/mortgagearrears/Pages/releases.aspx
[Accessed 4 August 2017]
Central Bank Of Ireland, June 2017. Retail interest rates. Statistical release 9 June
2017. Available at:
https://www.centralbank.ie/docs/default-source/statistics/data-and-analysis/credit-and-
banking-statistics/retail-interest-rates/
2017m04_ie_retail_interest_rate_statistics.pdf?sfvrsn=12 [Accessed 4 August
2017]
109

Secure Best Marks with AI Grader

Need help grading? Try our AI Grader for instant feedback on your assignments.
Document Page
Chan, S.P., 2015. Britain On Top: Recovery From Great Recession Was Faster Than
Thought. The Telegraph. [online] 30 September 2015. Available from:
http://www.telegraph.co.uk/finance/economics/11900934/UK-GDP-growth-
stronger-previously-though-recovery-ONS.html
Chia, R., 2002. The production of management knowledge: Philosophical
underpinnings of research design. In Partington, D. Essential skills for
management research. London: SAGE publications
Connington, J., 2017. Homeowners to switch mortgages: these are the best deals over
two, three, five and ten years. The Telegraph. [online] 4 August 2017. Available
from:
http://www.telegraph.co.uk/personal-banking/mortgages/best-fixed-rate-mortgages-
two-three-five-and-10-years/[Accessed 4 August 2017]
Cook, S., Thomas, c., 2003. An Alternative Approach To Examining The Ripple
Effect In UK House Prices. Applied Economics Letters, 10(13), 849-851
Craddon, J., 2017. Are You Trying To Tough It Out In The Buy To Let Market? It Is
A Tough Nut To Crack. The Irish Independent. [online] 12 February 2017.
Available from:
https://www.independent.ie/business/personal-finance/property-mortgages/are-
you-trying-to-tough-it-out-in-the-buytolet-market-its-a-tough-nut-to-crack-
35443167.html[Accessed 4 August 2017]
CSO Central Statistics Office., 2012. The Roof over Our Heads – Housing in Ireland.
Dublin: Central Statistics Office
CSO, 2011. Central Statistics Office Census 2011. Ireland and Northern Ireland.
Central Statistics Office. [online] Available from:
http://www.cso.ie/en/media/csoie/releasespublications/documents/population/
2011/Cen2011IrelandNorthernIreland.pdf[Accessed 4 August 2017]
CSOa. Central Statistics Office. Statistics. [Online]. Available from:
http://www.cso.ie/px/pxeirestat/Statire/SelectVarVal/saveselections.asp [Accessed 4
August 2017]
CSOb. Central Statistics Office. Principal Statistics: Employment and Unemployment
(ILO) ’000s. Retrieved 04/01/2013, from
http://www.cso.ie/en/statistics/labourmarket/ [Accessed 4 August 2017]
CSOc. Central Statistics Office. Make Graph. [online] Available from:
110
Document Page
http://www.cso.ie/px/pxeirestat/Statire/Graphics/MakeGraph.asp?
menu=y&pxfile=2017322131140612627HSQ06.px&gr_type=1&PLanguage=0
[Accessed 4 August 2017]
CSOd. Central Statistics Office. Make Graph. [online] Available from:
http://www.cso.ie/px/pxeirestat/Statire/Graphics/MakeGraph.asp?
menu=y&pxfile=2017322131140612627HSQ06.px&gr_type=1&PLanguage=0
[Accessed 4 August 2017]
CSOe Central Services Office. Census of Population – Small Area Population
Statistics. Available from http://census.cso.ie/censusasp/
saps/boundaries/saps.htm
CGLAa Central Government Local Authorities. Public Spending Chart 1856-1859.
[online] Available from:
http://www.ukpublicspending.co.uk/spending_chart_1856_1859UKk_12c1li011
mcn_ [Accessed 4 August 2017]
CGLAa Central Government Local Authorities. Public Spending Chart 1865-1868.
[online] Available from:
http://www.ukpublicspending.co.uk/spending_chart_1865_1868UKk_12c1li011
mcn_ [Accessed 4 August 2017]
Cole, H.L., and Ohanian, L.E., 2004. New Deal Policies and the Persistence of the
Great Depression: A General Equilibrium Analysis. Journal of Political
Economy, 112(4), 779816
The Columbia Electronic Encyclopedia 6th Edition. 2012. Columbia University Press.
Great Depression. [online] Available from:
https://www.infoplease.com/encyclopedia/history/united-states-canada-and-
greenland/us-history/great-depression [Accessed 4 August 2017]
CML Council of Mortgage Lenders, 2010. An Evidence-Based Review of MMR
Mortgage Market Review Proposals on Responsible Lending. London.
Collinson, P., 2015. Towns the UK property boom forgot. [online] The Guardian.
[online] 29 August 2015. Available from:
https://www.theguardian.com/money/2015/aug/29/towns-property-boom-forgot-
house-prices-newry-conwy-ferryhill [Accessed 4 August 2017]
Connington, J., 2016. Mortgage Rate War: now the post office offers 3 year deal at
2.24%pc. The Telegraph. [online] 23 February 2016. Available from:
111
Document Page
http://www.telegraph.co.uk/money/consumer-affairs/mortgage-rate-war-now-the-
post-office-offers-three-year-deal-at/
Connor, G., and Flavin, T., 2015. Strategic, unaffordability and dual-trigger default in
the Irish mortgage market. Journal of Housing Economics, 28, 59-75 Available
at: http://eprints.maynoothuniversity.ie/7989/1/Connor_Flavin_JHE_2015.pdf
[Accessed 4 August 2017]
Corbin, J., and Strauss, A., 2008. Basics of Qualitative Research Techniques and
Procedures for Developing Grounded. Los Angeles: SAGE
Corner, J., 2009. In Search Of More Complete Answers To Research Questions.
Quantitative versus Qualitative Research Methods. Is There A Way Forward?
Journal Of Advanced Nursing, 1(6), 718-727
Council of Economic Advisers, 2014. The Labour Force Participation Rate since
2007: Causes and Policy Implications, Executive office of the president of the
United States. Available from: http://www.whitehouse.gov/sites/default/files/
docs/labor_force_participation_report.pdf [Accessed 4 August 2017]
CPI Consumer Price Index Financial, 2010. : Fitch downgrades Ireland to “A+”;
outlook negative. CPI Consumer Price Index Financial, 7 October 2010
Crosby., 2008. Mortgage Finance: Final Report and Recommendations. London: HM
Treasury
Daft.ie, 2017. The Daft.ie House Price Report. An Analysis Of Recent Trends In The
Irish Residential Sales Market For 2017 Q3. [online]. Available from
https://www.daft.ie/report/2017-Q3-houseprice-daft-report.pdf[Accessed 4 August
2017]
Dail debates, December 7, 1925 [online] Available from:http://historical-
debates.oireachtas.ie/D/0013/D.0013.192512070003.html [Accessed 4 August
2017]
Davidson, S., 2016. Assault On Buy To Let Will Push Almost Half A Million
Landlords Into Higher Tax Rate, as Industry Wards Of Rent Hikes and Forced
Sales. This Is Money.[online] 30 October 2016. Available from:
http://www.thisismoney.co.uk/money/buytolet/article-3844788/Buy-let-mortgage-tax-
change-push-440-000-landlords-40-tax.html [Accessed 4 August 2017]
Davies, A., Macaskill, A., 2017. Brexit: Banks Planning To Move 9,000 Jobs From
Britain To Mainland Europe. The Independent. [online] 8 May 2017. Available
112

Paraphrase This Document

Need a fresh take? Get an instant paraphrase of this document with our AI Paraphraser
Document Page
from: http://www.independent.co.uk/news/business/news/brexit-latest-news-
banks-move-9000-jobs-britain-mainland-europe-eu-european-union-jpmorgan-
hsbc-a7724231.html[Accessed 4 August 2017]
Deane, P., 1965. The first Industrial Revolution. Cambridge: Cambridge University
Press
Deane, P., 1968. New estimates of Gross National Product for the United Kingdom
1830–1870. The Review of Income and Wealth. 14(2), 95–112
Deane, P., and Cole., W.A., 1962. British economic growth 1688–1959. Cambridge:
Cambridge University Press.
Deloitte, 2017. Brexit: Impact on the financial services industry and the Irish
economy. [online] Available at:
https://www2.deloitte.com/ie/en/pages/financial-services/articles/brexit-impact-
financial-services.html [Accessed 4 August 2017]
Denton, J., 2015. Average home hits record 286k, official figures claim with
house prices in Northern Ireland Soaring more than 10% in a year. This Is
Money. [online] 17 November 2015. Available from:
http://www.thisismoney.co.uk/money/mortgageshome/article-3321855/Average-
home-hits-record-286k-ONS-figures-claim-Northern-Ireland-10.html [Accessed
4 August 2017]
Department for Communities and local Government, 2015. English Housing
Survey:Households. Annual Report On England’s Households 2013-14.
[online] Available from:
https://www.gov.uk/government/uploads/system/uploads/attachment_data/
file/461439/EHS_Households_2013-14.pdf[Accessed 4 August 2017]
Department for communities and local government, 2017. Your Right To Buy
Your Home. [online] Available from
https://righttobuy.gov.uk/wp-content/uploads/2015/01/Your-Right-to-Buy-Your-
Home-A-Guide-April-2017.pdf[Accessed 4 August 2017]
Department of Environment Community & Local Government. (various years)
Annual Housing Statistics Bulletin (Dublin: Department of Environment,
Community & Local Government). Available at:
http://www.housing.gov.ie/search/category/housing [Accessed 4 August 2017]
113
Document Page
Department Of Foreign Affairs and Trade, 2014. Ireland and Britain. A unique
economic partnership. Available at:
https://www.dfa.ie/media/dfa/alldfawebsitemedia/ourrolesandpolicies/ourwork/
statevisit2014/Economic-Facts.pdf [Accessed 4 August 2017]
Department of housing, planning and local government, 2017. Construction Activity
ESB Connections. Available from:
http://www.housing.gov.ie/housing/statistics/house-building-and-private-rented/
construction-activity-esb-connections[Accessed 4 August 2017]
Depken, C.A., Hollans, H., Swidler, S., 2012. Housing bubbles and foreclosures that
follow: the case of Las Vegas. In: Jones, C., White, M., Dunse, N. Challenges
of the Housing Economy: An International Perspective. Oxford: Wiley
Donnelly, P., 2013. How Foreign Firms Transformed Ireland’s Economy. The Irish
Times. [online] 13 November 2013. Available from:
https://www.irishtimes.com/business/how-foreign-firms-transformed-ireland-s-
domestic-economy-1.1593462
Dorney, J., 2011. The Irish Story. A short history of public spending, borrowing and
debt in independent Ireland. [online] Available from:
http://www.theirishstory.com/2011/01/25/life-and-debt-%E2%80%93-a-short-history-
of-public-spending-borrowing-and-debt-in-independent-ireland/
#.WNa8PdSLSXZ [Accessed 4 August 2017]
Dow, C., 1998. Major Recessions: Britain and the world 1920-1955. UK: Oxford
University Press
Doyle, N., 2009. Housing Finance Developments in Ireland. In: Central Bank and
Financial Services Authority of Ireland – Quarterly Bulletin 04, October.
Dublin: CBFSAI
Drake, L., 1995. Testing For Convergence between UK Regional House Prices.
Regional Studies, 29(4) 357- 366
Duca, J.V., 2014. Subprime Mortgage Crisis. Federal Reserve History. [online]
Available from:
https://www.federalreservehistory.org/essays/subprime_mortgage_crisis
Duff, M.C., 2003. Ireland’s Economic Progress. On The Verge Of Bankruptcy to
Economic Star Of Europe in 5 years. The Taxpayers Network. October 20003.
[online] Available from:
114
Document Page
http://www.taxpayersnetwork.org/_Rainbow/Documents/Irelands%20Economic
%20Progress.pdf
Dunkley, E., 2014. How Wealth Managers Charges Add Up. Financial Times.
[online] 20 June 2014. Available from: https://www.ft.com/content/ecf13900-
f0b2-11e3-8f3d-00144feabdc0
Dunphy, R., 1995. The Making of Fianna Fail Power in Ireland, 1923-1948. Oxford:
Claredon Press
ECB, 2017. European Central Bank Statistical Data Warehouse. Ireland
Unemployment 1960-2018 [online] Available from:
http://sdw.ecb.europa.eu/quickview.do?
SERIES_KEY=139.AME.A.IRL.1.0.0.0.ZUTN&periodSortOrder=ASC
Economics Help, 2010. Comparison Of Recessions. 1 February 2010. [online]
Available from: http://econ.economicshelp.org/2010/02/comparison-of-
recessions.html
Economics Help, 2017. Measuring unemployment. [online] available from:
http://www.economicshelp.org/macroeconomics/unemployment/
measuring_unemployment/ [Accessed 4 August 2017]
Economicshelp, 2015. Trends in tenure, 1918 to 2013-2014. [online] Available from:
http://www.economicshelp.org/wp-content/uploads/2015/12/trends-in-
tenure.jpg [Accessed 4 August 2017]
Economics Help. UK Recession 1991.[online]Available from:
http://www.economicshelp.org/macroeconomics/economic-growth/uk-
recession-1991/ [Accessed 4 August 2017]
The Economist. 30 December 2008. Diagnosing Depression. [online] Available from:
http://www.economist.com/node/12852043 [Accessed 4 August 2017]
Elliot, L., 2015. Comparing Recessions Is Hard, but Britain Has Coped Better This
Time. The Guardian. 18 October 2015. Available from:
https://www.theguardian.com/business/economics-blog/2015/oct/18/comparing-
recessions-hard-britain-has-coped-better
Eichengreen, B., and Bordo. MD., 2002. Crises Now and Then: What Lessons from
the Last Era of Financial Globalization? NBER Working Paper No. 8716.
Elliot, L., 2012. British Recessions: A Short History. The Guardian. 7 December
2012. [online] Available from:
115

Secure Best Marks with AI Grader

Need help grading? Try our AI Grader for instant feedback on your assignments.
Document Page
https://www.theguardian.com/business/2012/dec/07/britain-recessions-
history[Accessed 4 August 2017]
Elliot, L., 2015. Comparing Recessions Is Hard, but Britain Has Coped Better This
Time. The Guardian. 18 October 2015. [online] Available from:
https://www.theguardian.com/business/economics-blog/2015/oct/18/comparing-
recessions-hard-britain-has-coped-better
Emmerson, C., and Tetlow., 2015. UK Public Finances: From Crisis To Recovery.
Fiscal Studies. 36(4), 555-577
EMF, 2009. European Mortgage Federation. Hypostat 2009: A Review of Europe’s
Housing and Mortgage Markets. Brussels. Available at:
https://www.law.berkeley.edu/files/bclbe/Hypostat_2009__europe_s_mortgage_
and_housing_markets.pdf [Accessed 4 August 2017]
European Commission. Press release. [online] Available at:
http://europa.eu/rapid/press-release_STAT-14-29_en.htm [Accessed 4 August 2017]
Evans, R., 2013. The Cost Of Buying US Shares In The UK. The Telegraph [online] 8
October 2013. Available from:
http://www.telegraph.co.uk/finance/personalfinance/investing/10356760/The-
cost-of-buying-
Farleydwek., 2009. Planning for future home care fees. [Online] Available from:
http://www.farleydwek.com/mitigating-social-care-costs/ [Accessed 4 August 2017]
Farrow, P., 2009. 20 Ways To Profit From The Recession. The Telegraph. [online]
Available from:
http://www.telegraph.co.uk/finance/personalfinance/investing/5928172/20-
ways-to-profit-from-the-recession.html
Fearn, H., 2016. The Panama Papers Expose How The Global Elite Ruined The
Housing Market and Stopped You Buying A Home. The Independent. 6 April
2016 [online] Available from: http://www.independent.co.uk/voices/the-
panama-papers-expose-how-the-global-elite-ruined-the-housing-market-and-
stopped-you-from-buying-a6971341.html[Accessed 4 August 2017]
FHFA. Federal Housing Finance Agency, 2017. House Price Index. [online]
Available from: https://www.fhfa.gov/DataTools/Downloads/pages/house-
price-index.aspx [Accessed 4 August 2017]
Finnegan Gibson. Property Investment, buy to let. [online] Available from:
116
Document Page
https://www.fgibson.co.uk/factsheets/personal-tax/property-investment-buy-to-let
[Accessed 4 August 2017]
Follain, J.R., Giertz, S.H., 2016. US House Price Bubbles and Busts. Public
Finance Review, 44(1), 132-159
FSCS, 2017. Banking. How Is Your Money Protected. Financial Services
Compensation Scheme.[online] 8 September 2017. Available from:
https://protected.fscs.org.uk/banking/how-is-your-money-fscs-protected/
[Accessed 4 August 2017]
Galbraith, J.K., 2009. The Great Crash 1929. UK: Penguin
Gardner, R., 2017. Nationwide House Price Index. September 2017. [online]
Available from:
https://www.nationwide.co.uk/~/media/MainSite/documents/about/house-price-
index/2017/Sep_Q3_2017.pdf[Accessed 4 August 2017]
Gärtner, M., Griesbach, B., Mennillo, G., 2013. The near-death experience of the
celtic tiger: A Model-Driven Narrative from the European Sovereign Debt
Crisis. Intereconomics. 48(6), 358-365
Gayner, A.D., Rostow, W.W., Schwartz, A.J., 1953. The growth and fluctuations of
the British economy 1790–1850. 2 Vols. Oxford: Clarendon Press
Ghauri, P. and Gronhaug, K., 2002. Research Methods In Business Studies, A
Practical Guide. Harlow: Pearson Education Limited
Giles, 2017. The UK Economy Since The Brexit Vote- In 5 Charts. Financial Times.
[online] 26 July 2017. Available from: https://www.ft.com/content/cf51e840-
7147-11e7-93ff-99f383b09ff9
Girouard, N., 2006. Has the rise in debt made households more vulnerable? In: M.
Kennedy. OECD Economics Department Working Paper No. 535. Paris: OECD
Glaser, B.G., and Straus, A.L., 1967. The Discovery Of Grounded Theory: Strategies
for Qualitative Research. Chicago:Aldine
Glasner, D., 1997. USA: Library of Congress. Business Cycles and Depressions: An
Encyclopedia. New York: Garland Publishing
Glass, H., 2012. Mortgages. Averages house price risen 100 times since Queen
crowned. This Is Money. [online], 14 May 2012. Available at:
http://www.thisismoney.co.uk/money/mortgageshome/article-2144226/Average-
house-price-risen-100-times-Queen-crowned.html [Accessed 4 August 2017]
117
Document Page
Global Property Guide, 2017a. Real Estate House Prices United States. [online]
Available at:
https://www.globalpropertyguide.com/real-estate-house-prices/U#united-states
[Accessed 4 August 2017]
Global Property Guide, 2017b. Europe. Ireland. Price History. Irish Interest Rates
and Mortgages. [online] Available from:
http://www.globalpropertyguide.com/Europe/ireland/Price-History [Accessed 4
August 2017]
Global Rates, 2017. Interest Rates. European Central Bank Interest Rates.
http://www.global-rates.com/interest-rates/central-banks/european-central-bank/ecb-
interest-rate.aspx [Accessed 4 August 2017]
Gorton, G.B., and Tallman, E., 2016. How Did Pre-Fed Banking Panics End? Federal
Reserve Bank of Cleveland Working Paper No. 16-03, 2016.
Available at:
https://www.clevelandfed.org/newsroom-and-events/publications/working-
papers/2016-working-papers/wp-1603-how-did-pre-fed-banking-panics-
end.aspx [Accessed 4 August 2017]
Gwyther, M., 2017. Northern Ireland: Brexit, Borders and Back To The Future.
Managementtoday.com.(1)42. [online] Available from:
https://www.magzter.com/article/Business/Management-Today/Northern-
IrelandBrexit-Borders-And-Back-To-The-Future
http://content.ebscohost.com/ContentServer.asp?
T=P&P=AN&K=121374774&S=R&D=l2r&EbscoContent=dGJyMNHr7ESep7
Y4yOvsOLCmr0%2BeprRSsq64TK
%2BWxWXS&ContentCustomer=dGJyMOzprkm3qK9JuePfgeyx43zx
[Accessed 4 August 2017]
Hamilton, J., 1987. Monetary Factors In The Great Depression. Journal Of Monetary
Economics, 19(2), 145-169.
Harris, J., 2016. The End Of Council Housing. The Guardian. [online] 4 January
2016. Available from: https://www.theguardian.com/society/2016/jan/04/end-
of-council-housing-bill-secure-tenancies-pay-to-stay
Harris, M., 2007. CNN. Money Magazine. Stocks v Real Estate. [online] Available
from:http://money.cnn.com/galleries/2007/real_estate/0704/gallery.stocks_v_re
alestate.moneymag/index.html [Accessed 4 August 2017]
118

Paraphrase This Document

Need a fresh take? Get an instant paraphrase of this document with our AI Paraphraser
Document Page
Hardiman, N., 2012. Irish Governance in crisis. Manchester: Manchester University
Press
Hardiman, N., and Regan, A., 2013. The politics of austerity in Ireland.
Intereconomics, (48)1, 9-14
Harloe, M., 1995. The People’s Home? Social Rented Housing in Europe and
America. Oxford: Blackwell
Harvard University. The Joint Centre For Housing Studies Of Harvard University,
2010. The State of the Nation’s Housing 2010. Available from:
http://www.jchs.harvard.edu/sites/jchs.harvard.edu/files/son2010.pdf [Accessed
4 August 2017]
Heath, A., 2017. Why Jeremy Corbyn and His Team Would Ruin The Economy. The
Telegraph. [online] 14 September 2017. Available from:
http://www.telegraph.co.uk/finance/economics/11864953/Why-Jeremy-Corbyn-and-
his-team-would-ruin-the-economy.html
Hetzel, R.L., 2014. The Great Recession Market Failure or Policy
Failure? Cambridge: Cambridge University Press
Hill, S., Thomas, R., Dimsdale, N., 2010. The UK Recession In Context – what do
three centuries of data tell us? Research and Analysis. The UK Recession In
Context. Bank Of England Quarterly Bulletin 2010 Q4.277-290
HMRC, 2017. Rates And Allowance: Corporation Tax. [online] Available from:
https://www.gov.uk/government/publications/rates-and-allowances-corporation-
tax/rates-and-allowances-corporation-tax
Holly, S., Persaran, M.H., Yamagata, T., 2010. Spatial and Temporal Diffusion Of
House Prices in the UK. Institute Of The Study Of Labour (IZA) Discussion
Paper 4694
Hoskin, P. The Question Of Northern Powerhouse Prices. Conservative Home.
[online] 16 July 2015. Available from:
https://www.conservativehome.com/highlights/2015/07/the-question-of-
northern-powerhouse-prices.html
Honohan, P., 2009. Policy paper: Resolving Ireland’s banking crisis. Economic and
Social Review, 40(2), 207 –231
Hopkinson, M., 2010. Green Against Green, The Irish Civil War. 2nd edn. Dublin: Gill
and MacMillan
119
Document Page
Hoppit, J., 1986. Financial crises in eighteenth-century England. The Economic
History Review, 39(1), 39–58
Housing Executive. Ulster University. Northern Ireland Quarterly House Price Index
For Q1 2015. Report Number 122. Available from:
https://www.ulster.ac.uk/__data/assets/pdf_file/0004/59647/
HousingPriceIndexReportQ1_2015.pdf [Accessed 4 August 2017]
Iancu, A.L., and Gheorghe. I., 2016. The Legal, Political and Economic Implications
Of The Brexit. Law Review: Judicial Doctrine & Case Law, (6), 40-47
Immergluck, D., 2009. Foreclosed: Deregulation, High Risk Lending and the
Undermining of America’s Mortgage Market. Ithaca,New York: Cornell
University Press.
Institute For Fiscal Studies, 2016. Brexit and the UK’s Public Finances. May 2016.
Available from: https://www.ifs.org.uk/uploads/publications/comms/r116.pdf
[Accessed 4 August 2017]
International Monetary Fund (IMF), 2009. Chapter 3 From recession to recovery:
How soon and how strong? Available from:
https://www.imf.org/external/pubs/ft/weo/2009/01/pdf/c3.pdf [Accessed 4
August 2017]
International Monetary Fund, 2016. United Kingdom. 2015 Article IV Consultation
Press release, Staff Report; and statement by the Executive Director For United
Kingdom. IMF Country Report No 16/57.
International Monetary Fund, 2017. Ireland. 2017 Article IV Consultation – Press
Release and Staff Report. Country Report No 17/171 [online] Available from:
file:///C:/Documents%20and%20Settings/Jjohnston/My%20Documents/Downlo
ads/cr17171%20(1).pdf[Accessed 4 August 2017]
Investopedia. Past Recessions. [Online] Available from:
http://www.investopedia.com/articles/economics/08/past-recessions.asp [Accessed 4
August 2017]
Irish Times, 2017. Brexit: A dozen London firms, banks moving to Dublin, IDA says.
[online] 30 June 2017. Available from:
https://www.irishtimes.com/business/financial-services/brexit-a-dozen-london-
firms-banks-moving-to-dublin-ida-says-1.3138874 [Accessed 4 August 2017]
Iyanatul, I., and Sher, V., 2011. From The Great Recession To Labour Market
Recovery: Issues, Evidence and Policy Options. Geneva: ILO. Palgrave
120
Document Page
Jaffee, D., 2008. The US Subprime Mortgage Crisis: Issues Raised and Lessons
Learned. Commission on growth and development working paper. No 28.
Washington DC: World Bank. Available at:
http://documents.worldbank.org/curated/en/612021468130801823/The-U-S-
subprime-mortgage-crisis-issues-raised-and-lessons-learned [Accessed 4 August
2017]
Jeffries, T., 2015.What’s done best- cash, stocks or bricks and mortar. How popular
asset classes have performed in the past 30 years. This Is Money [online] 19
February 2015. Available at:
http://www.thisismoney.co.uk/money/investing/article-2958803/Cash-stocks-
property-best-returns-past-30-years.html [Accessed 4 August 2017]
Johns, N., and Lee Ross D., 1998. Research Methods In Service Industry
Management. London:Cassell.
Johnson, G., and Scholes, K., 2002.Exploring corporate strategy: text and cases. 6th
edn. London:Prentice Hall
Jones, C.A., 2003. Exploitation of the Right to Buy Scheme by Companies. London,
Office of the Deputy Prime Minister
Jones, C.A., 2009. Right to buy. In: Malpass, P., and Rowlands, R., Housing Markets
and Policy. London: Routledge
Jones, C., and Murie, A., 2006. The Right to Buy, Analysis and Evaluation of a
Housing Policy. Oxford: Blackwell
Jones, C., and Richardson, H.W., 2014. Housing markets and policy in the UK and
the USA; A review of the differential impact of the global housing crisis.
International Journal of Housing Markets and Analysis, 7(1), 129-144
Kelleher, R., 2016. Ireland In 2016. Housing Remains The Big Challenge. Davy
Marketwatch January 2016. [online] Available from:
http://www.davy.ie/private-clients/insights/marketwatch/2016/ireland-in-2016-
housing-remains-the-big-challenge.html[Accessed 4 August 2017]
Kelly, J., and Everett, M., 2004. Financial liberalisation and economic growth in
Ireland. Central Bank of Ireland Quarterly Bulletin Article, 91–112. Available
at: https://www.centralbank.ie/docs/default-source/publications/quarterly-
bulletins/qb-archive/2004/quarterly-bulletin-autumn-2004---financial-
liberalisation-and-economic-growth.pdf [Accessed 4 August 2017]
121

Secure Best Marks with AI Grader

Need help grading? Try our AI Grader for instant feedback on your assignments.
Document Page
Kelpie, C., 2017. David Davies: Technology Can ‘Create’ A Non-visible Border
Between NI and the Republic. The Independent. [online] 5 September 2017.
Available from: https://www.independent.ie/business/brexit/david-davis-
technology-can-create-nonvisible-border-between-ni-and-the-republic-
36103587.html[Accessed 4 August 2017]
Kirby, P., 2010. Celtic Tiger in Collapse: Explaining the Weaknesses of the Irish
Model. Basingstoke: Palgrave Macmillan
Kirby, S., Meaning, J., and Warren, J., 2015. GDP estimates – GDP growth 0.6 per
cent in 2014Q4, National Institute of Economic and Social Research (NIESR).
Available from: http://niesr.ac.uk/media/january-2015-gdp-estimates-gdp-
growth-06-cent-2014q4- [Accessed 4 August 2017]
Kitchin, R., Gleeson, J., Keaveney, K., O’Callaghan, C., 2010. A haunted landscape:
Housing and ghost estates in Post-Celtic Tiger Ireland. In: NIRSA Working
Paper Series (Maynooth, National Institute for Regional and Spatial Analysis,
NUIM).
Knight, J., 2013. Shares or Property – What’s Best? The Independent. [online] 20 July
2013. Available from: http://www.independent.co.uk/money/spend-save/shares-
or-property-whats-best-8722809.html[Accessed 4 August 2017]
Krueger, R.A., 1994. Focus groups: A practical guide for applied research. 2nd
Edition. Thousand Oaks, CA: Sage.
Krugman, P., 2009. How did economists get it so wrong?. The New York
Times[online], 2 September 2009. Available from:
http://www.nytimes.com/2009/09/06/magazine/06Economic-t.html [Accessed 4
August 2017]
Labonte, M., 2010. The 2007-2009 Recession: Similarities To and Differences From
The Past. Congressional Research Service. 11 October 2010
Lambert, S., 2015. House Prices, what to expect. This Is Money [online] 6 October
2015. Available from:
http://www.thisismoney.co.uk/money/mortgageshome/article-1671748/House-prices-
What-expect-news-predictions.html [Accessed 4 August 2017]
Lane., P., 2015. The funding of the Irish domestic banking system during the boom?
Journal of the Statistical and Social Inquiry of Ireland. XLIV, 40–65. Available from:
http://www.philiplane.org/SSISI2015LANE.pdf [Accessed 4 August 2017]
122
Document Page
Lea, R., 2012. Cityam. Why Britain’s housing market has escaped disasters. [online]
23 November 2012. Available from:
http://www.cityam.com/article/why-britain-s-housing-market-has-escaped-disasters-
1990s [Accessed 4 August 2017]
Lopez-Salido, D., and E. Nelson., 2010. Postwar Financial Crises and Economic
Recoveries in the United States. Working Paper, Washington Federal Reserve
Board
Maanen, V.J. (1983) Qualitative Methodology. London:Sage.
Macdonald, R., Taylor, M.P., 1993. Regional House Prices In Britain: Long Run
Relationships and Short Run Dynamics. Scottish Journal Of Political Economy.
4(1) 43-55.
Marshall, D., and McBurney, C., 2010. NISRA. Northern Ireland Statistics and
Research Agency. Northern Ireland Multiple Deprivation Measure 2010.
Available at:https://www.nisra.gov.uk/sites/nisra.gov.uk/files/publications/
NIMDM_2010_Dissemination_Event_Presentation_North_West_1.pdf
[Accessed 4 August 2017]
Marx, K., and Engels, F., 1986. Collected Works of Karl Marx and Frederick Engels
Volume 28. International Publishers: New York, XIII (preface)
Mauder, S., 2017. Buy To Let Landlords Will Setting Up A Company Cut Your Tax
Bills[online] 8 September 2017. Available from:
https://www.which.co.uk/news/2017/09/buy-to-let-landlords-will-setting-up-a-
company-cut-your-tax-bill/
McCarthy, Y., and McQuinn, K., 2017. Credit conditions in a boom and bust property
market: Insights for macro-prudential policy. Quarterly Review Of Economics
and Finance. 64, 171-182
McGuinness, G., 2016. Get a fair deal with costs of care homes of elderly. Irish
Examiner. [online] 30 August 2016. Available from:
http://www.irishexaminer.com/lifestyle/features/get-a-fair-deal-with-costs-of-care-
homes-for-elderly-418362.html [Accessed 4 August 2017]
McDonnell, J. 2017. Jeremyforlabour. [online] Available at:
http://www.jeremyforlabour.com/homes[Accessed 4 August 2017]
123
Document Page
McLaughlin, E., 2001. Ireland from Catholic Corporatism to Social Partnership, in
Comparing Welfare States, p232 In Cochrane, A., Clarke, J., Gewirtz, S.,
Comparing Welfare States. USA: Sage Publications Ltd
McLaughlin, M., 2017. Buy To Let Property Handbook. Bloomsbury.
Meen, G., 1999. Regional House Prices and The Ripple Effect: A New Interpretation.
Housing Studies. 14(6), 733-753
Middleton, R., 2010. British monetary and fiscal policy in the 1930s. Oxford Review
of Economic Policy, (26)3, 414–41
Miles, D., and Pillonca, V., 2008. Financial innovation and European housing and
mortgage markets. Oxford Review of Economic Policy, 24(1), 145–175
Miller, H. ,and Pope, T. , 2015. Corporate tax changes under the UK coalition
government (2010–15). Fiscal Studies, 36(3), 327–47
Mortgagerates, 2017. Bank Of England Base Rate 1985-2017. [online] Available
from: www.mortgagerates.com[Accessed 4 August 2017]
Murphy, M.C., 2016. The EU Referendum in Northern Ireland: Closing borders, re-
opening border debates. Journal Of Contemporary European Research, (12)4,
844-853
Murray West, R., 2016. Should I Invest In Property or Shares? The Telegraph.
[online] 3 February 2017Available from:
http://www.telegraph.co.uk/money/decision-making/invest-in-property-or-
shares/[Accessed 4 August 2017]
NBER. The National Bureau Of Economic Research. The NBER’s Business Cycle
Dating Procedure: Frequently Asked Questions. [online] Available from:
http://www.nber.org/cycles/recessions_faq.html [Accessed 4 August 2017]
NIESR, 2014. National institute of Economic and Social Research. Profile of
Recession and recovery. [online] Available from:
https://www.niesr.ac.uk/media/july-2014-gdp-estimates-11894 [Accessed 4
August 2017]
NICVA. Draft Budget, 2015-2016 Summary. [online] Available from:
http://www.nicva.org/article/draft-budget-2015-16-summary [Accessed 4
August 2017]
NICVA. Northern Ireland Council for Voluntary Action. Draft Budget, 2015-2016
Summary. [online] Available from: http://www.nicva.org/article/draft-budget-
2015-16-summary [Accessed 4 August 2017]
124

Paraphrase This Document

Need a fresh take? Get an instant paraphrase of this document with our AI Paraphraser
Document Page
NIHE Northern Ireland Housing Execuative, 2015. Northern Ireland Housing Market.
Review and perspectives. 2015-2018. Available from:
https://www.nihe.gov.uk/northern_ireland_housing_market___perspectives_201
5-2018.pdf[Accessed 4 August 2017]
NISRA., 2017a. Northern Ireland Statistics and Research Agency. Northern Ireland
Broad Economy Sales and Export Statistics 2015. Available at:
https://www.nisra.gov.uk/sites/nisra.gov.uk/files/publications/BESES-Publication-
2015-Headline-results-pdf_1.pdf [Accessed 4 August 2017]
NISRA, 2017b. Northern Ireland Statistics and Research Agency, 2017. Property
Repossessions Completed. [online] Available from:
http://www.ninis2.nisra.gov.uk/public/PivotGrid.aspx?ds=8419&lh=73&yn=2007-
2016&sk=132&sn=Economy&yearfilter=[Accessed 4 August 2017]
Nowlan, B., 2015. Why Investment In Residential Rentals Is Making A Return. The
Irish Times. [online] 1 April 2015. Available from:
https://www.irishtimes.com/business/commercial-property/why-investment-in-
residential-rentals-is-making-a-return-1.2160183[Accessed 4 August 2017]
Nyberg, P., 2011. Misjudging risk: Causes of the systemic banking crisis in Ireland,
in: Report of the Commission of Investigation into the Banking Sector in
Ireland. Dublin: Government of Ireland
O’Brien, C., and McCaffrey, U., 2013. Ireland’s repossession rate is
‘uncharacteristically low’. The Irish Times
Observation and Notes, 2012a. Housing vs Stock Market Growth. [online] Available
from:http://2.bp.blogspot.com/-_eEkRXhtPbM/T4oB31QC5ZI/AAAAAAAAB
U0/7cwpBE7naJg/s1600/U.S.+Housing+vs+Stock+Market+Growth.jpg
[Accessed 4 August 2017]
Observation and Notes, 2012b. Home real estate v Stock Market. [online] Available
from: http://observationsandnotes.blogspot.ie/2012/04/home-real-estate-stock-
market.html [Accessed 4 August 2017]
Observation and Notes, 2012c. US Housing Prices Since 1900. [online] Available
from:http://observationsandnotes.blogspot.ie/2011/06/us-housing-prices-since-
1900.html [Accessed 4 August 2017]
Observation and Notes, 2012d. Inflation Adjusted US Housing Prices Since 1900.
[online] Available from:
125
Document Page
http://observationsandnotes.blogspot.ie/2011/07/housing-prices-inflation-since-
1900.html[Accessed 4 August 2017]
O’Connor, T., 2010. The Structural Failure Of Irish Economic Development And
Employment Policy. The Irish Journal Of Public Policy. 2(1) [online] Available
from: http://publish.ucc.ie/ijpp/2010/01/tomoconnor/03/en
OECD, 2017. Ireland Economic Forecast Summary. June 2017. [online] Available
from:
http://www.oecd.org/eco/outlook/economic-forecast-summary-ireland-oecd-
economic-outlook-june-2017.pdf[Accessed 4 August 2017]
O’Connell, C., 2005. The housing market and owner occupation in Ireland. In:
Norris, M.D., and Redmond, D. Housing Contemporary Ireland: Policy, Society
and Shelter. Dublin: Institute of Public Administration
ONSa Office For National Statistics, 2017. Interest Rates Since 1694. [Online]
Available from:
https://docs.google.com/spreadsheets/d/1OKo38R1blO71SGNIVuhaRZ4P2GY
PpJQklmOymQiXixQ/edit?hl=en&hl=en#gid=0[Accessed 4 August 2017]
ONSb Office For National Statistics, 2017. UK GDP Since 1955. [Online] Available
from:
https://docs.google.com/spreadsheets/d/1_rJJuTPWB-
J8jkRZoeRi3De2tMLBxVcPKN2D-89lkUk/edit#gid=10 [Accessed 4 August
2017]
ONSc Office For National Statistics, 2017. House Price Index. [online] Available at:
https://www.ons.gov.uk/economy/inflationandpriceindices/bulletins/
housepriceindex/20 [Accessed 4 August 2017]
O’Rourke, K., 1991. Burn Everything British But Their Coal: The Anglo-Irish
Economic War of the 1930s. The Journal Of Economic Historr, 51(2), 357-366
OShea, T., 2016. Property v Shares. Which Is The Best Investment? Available from:
http://www.timoshea.co.uk/property-vs-shares-which-is-the-best-investment/
[Accessed 4 August 2017]
Oxford Dictionary, 2017. Recession, definition. Available from:
https://en.oxforddictionaries.com/definition/recession [Accessed 4 August 2017]
Oxford Dictionary, 2017b. Research. definition. Available from:
https://en.oxforddictionaries.com/definition/research[Accessed 4 August 2017]
126
Document Page
Pannell, B., 2006. Adverse lending. CML Council Of Mortgage Housing Finance.
(10), 1-12
Pannell, B., 2017. Affordability boosts the Northern Ireland market. CML Council of
Mortgage Lenders. [online], 16 March 2017. Available from:
https://www.cml.org.uk/news/news-and-views/affordability-boosts-the-northern-
ireland-market/ [Accessed 4 August 2017]
Paris, C., Palmer, J., Williams, P., 2014. Demographic Change and Future Housing
Need In Northern Ireland 2014 Housing Executive Final Report. Available
from:
http://www.nihe.gov.uk/
demographic_change_and_future_housing_need_in_northern_ireland__novemb
er_2014.pdf [Accessed 4 August 2017]
Pessoa, J., and Van Reenen, J., 2014. The UK productivity and jobs puzzle: does the
answer lie in wage flexibility?. Economic Journal,124, 433–52.
Pettinger, T., 2012. UK Economy In The 1920s. Economics Help. 16 October 2012.
[online] Available from:
https://www.economicshelp.org/blog/5948/economics/uk-economy-in-the-
1920s/
Pettinger, T., 2013. Comparing Different Recessions. Economics Help. 19 March
2013. [online] Available from:
https://www.economicshelp.org/blog/7209/economics/comparing-different-
recessions/
Pettinger, T., 2016. UK Housing Market. Economicshelp [online] Available from:
http://www.economicshelp.org/blog/5709/housing/market/ [Accessed 4 August 2017]
Pettinger, T., 2017. UK Inflation Rates and Graph. Economics help [online] Available
from:
https://www.economicshelp.org/blog/5720/economics/inflation-stats-and-graphs/
[Accessed 4 August 2017]
Pickford, J., 2017. Buy To Let Landlords Increasingly In A Tax Cul De Sac. [online]
21 April 2017. Available from: https://www.ft.com/content/bb63b598-25de-
11e7-a34a-538b4cb30025
Porter, M.E., 1998. Competitive strategy: Techniques for analysing industries and
competitors, with a new introduction. New York: Free Press
127

Secure Best Marks with AI Grader

Need help grading? Try our AI Grader for instant feedback on your assignments.
Document Page
Ramsey, R., 2015. NI Economic Round Up. Ulstereconomix. [online] 20 August
2015. Available from:
https://ulstereconomix.files.wordpress.com/2015/08/nirppi.jpg[Accessed 4 August
2017]
Reddan, F., 2017. Commission Model Works, Say Advisors And Insurance Firms.
The Irish Times.[online] 7 February 2017. Available from:
https://www.irishtimes.com/business/financial-services/commission-model-
works-say-advisers-and-insurance-firms-1.2966702
Reinhart, C. S., and K.S. Rogoff., 2009a. This Time Is Different: Eight Centuries of
Financial Folly. Princeton, NJ: Princeton University Press.
Reinhart, C. S., and K.S. Rogoff., 2009b. The aftermath of financial crisis. NBER
Working paper number 14656. Cambridge, Massachusetts NBER
Also American economic review. 99(2), 466-472
Available at:
https://dash.harvard.edu/bitstream/handle/1/11129155/reinhart_rogoff_aftermat
h_of_financial_crises_aer2009.pdf?sequence=1 [Accessed 4 August 2017]
Revenue. Irish Tax and Customs, 2016. Corporation tax for health professionals.
November 2016. Available at:
http://www.revenue.ie/en/tax-professionals/tdm/income-tax-capital-gains-tax-
corporation-tax/part-02/02-02-01.pdf [Accessed 4 August 2017]
Revenue. Irish Tax and Customs, 2017a. Corporation tax [online] Available from:
http://www.revenue.ie/en/companies-and-charities/corporation-tax-for-companies/
corporation-tax/index.aspx [Accessed 4 August 2017]
Revenue. Irish Tax and Customs, 2017b. Gains, gifts and inheritance. [online]
Available from:
http://www.revenue.ie/en/gains-gifts-and-inheritance/cat-thresholds-rates-and-
aggregation-rules/index.aspx [Accessed 4 August 2017]
Revenue. Irish Tax and Customs.2017c. Help To Buy Incentive. [online] Available
from:
https://www.revenue.ie/en/property/help-to-buy-incentive/index.aspx[Accessed 4
August 2017]
Richardson, H.W., 1970. The Economic Significance of The Great Depression in
Britain. Journal Of Contemporary History, 4(4), 3-19
128
Document Page
Riley, J., and Chote, R., 2014. Crisis and consolidation in the public finances. Office
for Budget Responsibility (OBR). Working Paper no. 7. [online] Available at
http://budgetresponsibility.org.
uk/wordpress/docs/WorkingPaper7a.pdf[Accessed 4 August 2017]
Roesch, S.R., 1975. The FOMC in 1974: Monetary Policy during Economic
Uncertainty. Federal Reserve Bank of St. Louis Review, 57(4), 213
Rudguard, O., 2016. Ireland’s Scrapping Of Buy To Let Tax Is Warning To Britain.
The Telegraph. [online] 17 October 2016. Available from:
http://www.telegraph.co.uk/investing/buy-to-let/irelands-scrapping-of-buy-to-
let-tax-is-warning-to-britain/[Accessed 4 August 2017]
Sahu, R., 2016. Which Precious Metals Are A Good Investment In 2016. [online]
https://deviantinvestor.com/7591/precious-metals-for-2016/
Saunders, M., Thornhill, A., Lewis, P., Fisher., 2007. Research Methods For Business
Students. 4th edition London: Financial Times Prentice Hall
Saunders., A., 2016. The UK Housing Crisis: A disaster of our own making.
Management Today. 13 September 2016. [online] Available from:
https://www.managementtoday.co.uk/uk-housing-crisis-disaster-own-making/
future-business/article/1380301[Accessed 4 August 2017]
Savills, 2017. Research, euro. [online] Available from:
http://research.euro.savills.co.uk/_images/mortgage-rates(3).png [Accessed 4
August 2017]
Seddighi, H.R., 2007. Methodology: How can the research question be answered? in
Student Module Guide: Applied Research Methods For Business and
Management. University of Sunderland
Seharan, U., 2000. Research Methods For Business: A Skill Building Approach. 3rd
edn New York : John Wiley & Sons inc
Shapland, M., 2016. Average UK Home Hits Nearly £200k In January and House
Prices Are Forecast To Keep Rising Due To Shortage Of New Homes. This Is
Money. [online] 27 January 2016. Available
from:http://www.thisismoney.co.uk/money/markets/article-3418762/Average-
UK-house-price-hits-nearly-200k-January-says-Nationwide.html[Accessed 4
August 2017]
Sharp, J.A., Peters, J., Howard, K., 2002. The Management of a Student Research
Project. (3rd Edn). Adershot: Gower
129
Document Page
Shiller, R.J., 2005. Irrational Exuberance. 3rd Edition. New Jersey: Princeton
University Press.
Silber, W.L., 2007. When Washington Shut Down Wall Street: The Great Financial
Crisis of 1914 and the Origin of America's Monetary Supremacy. Princeton, NJ:
Princeton University Press
Simmonds, D., 2015. Northern Ireland’s Economy. A new kind of trouble. The
Economist. [online] 22 January 2015. Available from:
http://www.economist.com/news/britain/21640334-guns-mostly-silent-ulster-can-
begin-deal-its-lamentable-economy-new-kind [Accessed 4 August 2017]
Soars, A., 2016. Living within and outside unions: the consequences of Brexit for
Northern Ireland. Journal Of Contemporary European Research, 12(4), 835-
843
St Angelo, S., 2017. Silver Out Performed Gold In This Major Sector. SRSRocco
Report. The Daily Coin. [online] 31 July 2017. Available
from:http://thedailycoin.org/2017/07/31/silver-investment-outperformed-gold-
major-sector/[Accessed 4 August 2017]
Stephens, M., and Quilgars, D., 2008. Sub-prime lending in the UK. International
Journal of Housing Policy, (8)2, 197-215
Suter, L., 2016. Once safe bonds are now offering only risk. So where should you
invest? The Telegraph. [online] 24 September 2016. Available from:
http://www.telegraph.co.uk/investing/bonds/once-safe-bonds-now-offering-only-risk-
so-where-should-you-inves/ [Accessed 4 August 2017]
Suter, L., 2017. New Buy To Let: How It Works and How To Beat it? The Telegraph.
[online] 8 April 2017. Available from:
http://www.telegraph.co.uk/investing/buy-to-let/new-buy-to-let-tax-works-
andhow-beat/[Accessed 4 August 2017
Tetlow, G., 2013. Cutting the deficit: three years down, five to go? Institute For Fiscal
Studies. 8 May 2013. [online] Available from:
https://www.ifs.org.uk/publications/6683[Accessed 4 August 2017]
Thorpe, D., 2016. When Investing In Property, Is Commercial Better Than Buy To
Let for 2016? What Investment. [online] 7 January 2016. Available from:
http://www.whatinvestment.co.uk/when-investing-in-property-is-commercial-
better-than-buytolet-for-2016-2501156/[Accessed 4 August 2017]
130

Paraphrase This Document

Need a fresh take? Get an instant paraphrase of this document with our AI Paraphraser
Document Page
Timberlake, J., Richard, H., 1997. Panic Of 1893. In : Glasner, D., Colley, T.F.,
Business Cycles and Depressions: an Encyclopedia. New York: Garland, 516-
518.
Tobin, A., 2017. Is There A Bubble In The Irish Housing Market? Davy Market
Watch. August 2017
Trading Economics. 2017a. Bond yields. [online] Available at:
https://tradingeconomics.com/united-kingdom/government-bond-yield [Accessed 4
August 2017]
Trading Economics, 2017b. Ireland Exports. [online] Available from:
https://tradingeconomics.com/ireland/exports [Accessed 4 August 2017]
True Potential., 2016. Tackling the savings gap. Available at:
http://www.tpllp.com/resources/research-white-papers/ [Accessed 4 August 2017]
Turner, P.M., 1991. Wealth effects and fiscal policy in the 1930s. Economic History
Review, 44(3), 515–22
Turner, A., 2009a. The Turner Review: A Regulatory Response to the Global Banking
Crisis. London: Financial Services Agency, London. Available at:
http://www.fsa.gov.uk/pubs/other/turner_review.pdf [Accessed 4 August 2017]
Turner, A., 2009b. The mortgage market: issues for debate. paper presented at FSA
Mortgage Conference, London. [online] Available at:
https://www.lexology.com/library/detail.aspx?g=b5c2b9b5-1574-4787-9d60-
b5678bf2a8f9 [Accessed 4 August 2017]
United Nations. Economic Commission for Europe. Research and Planning Division.
Economic Survey of Europe in 1948 (Geneva: United Nations. Department of
Economic Affairs, 1949),235
University Of Ulster, 2016. Northern Ireland Quarterly Housing Price Index. For Q3
2016. Report Number 128. Available from:
https://www.ulster.ac.uk/__data/assets/pdf_file/0014/130136/BERI-house-
index-2016-3.pdf[Accessed 4 August 2017]
University Of Ulster, 2017. Archive Of House Price Index. [online] Available from:
https://www.ulster.ac.uk/research/institutes/built-environment/centres/research-
property-planning/housing-market-reports/archive-of-house-price-
index[Accessed 4 August 2017]
131
Document Page
Upton. M., 2015. Open University. True potential research finds that misconceptions
about risk are undermining pension planning. [online] Available at:
http://www.open.ac.uk/business-school-research/pufin/blog/true-potential-research-
finds-misconceptions-about-risk-are-undermining-pension-planning [Accessed
4 August 2017]
USwitch, 2017. Interest rates, what to expect and how to prepare. [online] Available
from:
https://www.uswitch.com/mortgages/guides/interest-rate-rises-are-coming-what-to-
expect-and-how-to-prepare/ [Accessed 4 August 2017]
Wade, P., 2017. Everything You Need To Know About The Conservative DUP Deal
and How It Will Affect Northern Ireland. The Irish Independent. [online] 26
June 2017. Available from: https://www.independent.ie/irish-news/everything-
you-need-to-know-about-the-conservativedup-deal-and-how-it-will-affect-
northern-ireland-35868463.html
Waldron, R., and Redmond, D., 2014. The Extent of the
Mortgage Crisis in Ireland and Policy Responses. Housing Studies, (29)1, 149-165
Wallace, M., and Wray, A., 2011. Critical Reading And Writing For Postgraduates.
2nd edition. Sage
Walton, GM., Rockoff, H., 1997. History Of The American Economy. 9th edition. New
York: Harcourt Brace
Weller, C.E., 2012. 10 Reasons Why Public Policies Rescued The US Economy.
Centre For American Progress.[online] 29 May 2012. Available from:
https://www.americanprogress.org/issues/economy/news/2012/05/29/11593/10-
reasons-why-public-policies-rescued-the-u-s-economy/
Wheeler, B., 2015. A History Of Social Housing. BBC. [online] 14 April 2015.
Available from: http://www.bbc.com/news/uk-14380936
Whelan, K., 2011. Ireland’s Sovereign Debt Crisis, University College Dublin, UCD
Centre for Economic Research Working Paper Series, WP11/09, May 2011
Whelan, K., 2013. Ireland’s Economic Crisis The Good The Bad and The Ugly. UCD
18 June 2013. [online] Available from:
http://www.karlwhelan.com/Papers/Whelan-IrelandPaper-June2013.pdf
132
Document Page
Wicker, E.R., 2000. Banking Panics of the Gilded Age. Cambridge: Cambridge
University Press
Wilcox, S., Wallace, A., Bramley, G., Morgan, J., Sosenko, F., Ford, J., 2010.
Evaluation of the Mortgage Rescue Scheme and Homeowners Mortgage
Support – Interim Report London. Department for Communities and Local
Government. Available at:
https://www.gov.uk/government/uploads/system/uploads/attachment_data/file/
6339/1648140.pdf [Accessed 4 August 2017]
Wikipedia(a). List Of Recessions In The United States. [online] Available from:
https://en.wikipedia.org/wiki/List_of_recessions_in_the_United_States[Accesse
d 4 August 2017]
Wikipedia(b). List Of Recessions In The United Kingdom. [online] Available from:
https://en.wikipedia.org/wiki/List_of_recessions_in_the_United_Kingdom[Acce
ssed 4 August 2017]
Yin, R.K., 2003. Case study research: Design and methods 3rd ed. London:Sage.
Yoon, A., 2008. Foreclosure rates almost doubled in 2007. Reuters. [online] 29
January 2008. Available from: http://www.reuters.com/article/us-usa-housing-
foreclosures-idUSN2849823320080129 [Accessed 4 August 2017]
Yusopova, A., Pavlidis, E., Paya, I., Peel., 2017. Exuberance in the U.K. Regional
Housing Markets. Lancaster University.
[online] Available from:
http://eprints.lancs.ac.uk/86186/1/LancasterWP2017_012.pdf[Accessed 4
August 2017]
Zarnowitz, V., 1992. Business Cycles: Theory, History, Indicators, and
Forecasting. Chicago: University of Chicago Press
Zillow. United States Home Values and Prices. [online] Available from:
https://www.zillow.com/home-values/ [Accessed 4 August 2017]
133

Secure Best Marks with AI Grader

Need help grading? Try our AI Grader for instant feedback on your assignments.
Document Page
Legislation
Emergency imposition of duties (No 1) order 1932. 25 July 1932. Available at :
http://www.oireachtas.ie/parliament/about/libraryresearchservice/onlinecataloguecolle
ctions/documentslaidthroughthedecades/1930s-theeconomicwar/ [Accessed 4 August
2017]
134
1 out of 134
[object Object]

Your All-in-One AI-Powered Toolkit for Academic Success.

Available 24*7 on WhatsApp / Email

[object Object]