Investment Analysis & Financial Report of Rio Tinto - FINC20018
VerifiedAdded on 2023/04/23
|12
|3123
|256
Report
AI Summary
This report provides a comprehensive financial analysis of Rio Tinto Limited, an Anglo-Australian multinational mining corporation, to assess its attractiveness as an investment opportunity for equity shareholders. The analysis covers various aspects including stakeholder value maximization, trends in share prices and trading volumes, return on investment (ROI), theoretical equity value, dividend policy, and capital structure. Key findings indicate that Rio Tinto has shown improvements in P/E ratio, PEG ratio, and debt-equity ratio, suggesting enhanced shareholder value. The company's return on assets (ROA) and return on equity (ROE) are also higher than the industry average. However, the theoretical share price analysis suggests that the stock might be slightly overvalued. The report concludes by evaluating the company's dividend policy and buy-back initiatives, ultimately providing a balanced perspective on the investment potential of Rio Tinto.
Table of Contents
Introduction...........................................................................................................................................2
The Company....................................................................................................................................2
The Report.........................................................................................................................................2
The Analysis..........................................................................................................................................2
Maximization of Stakeholders’ Value:..........................................................................................3
Stability of securities of the company in market............................................................................5
Return on Investment:....................................................................................................................6
Theoretical Value of Equity of the company:................................................................................7
Dividend Policy:............................................................................................................................7
Capital Structure:...........................................................................................................................8
Conclusion:............................................................................................................................................9
Bibliography........................................................................................................................................10
Paraphrase This Document
Need a fresh take? Get an instant paraphrase of this document with our AI Paraphraser
Introduction
The Company
Rio Tinto Limited is an Anglo-Australian multi-national company which has emerged as one
of the world’s largest metals and mining corporations after being operational for 146 years.
Rio Tinto is a dual-listed company traded on both London Stock Exchange (LSE), where its
securities are traded in FTSE 100 Index and Australian Stock Exchange (ASX), where it is
listed in index of ASX200. The company has reported a revenue of $40.030 billion in 2017
while its operating income, net income, total assets and total equity in the same year stood
$14.474 billion, 8.851 billion, 95.726 billion and 44.711 billion respectively. The company is
also a huge employment generator having 50000 personnel on roll by 2017.
The Report
The report is aimed to analyse the company’s financial performance in the context of an
investment decision and makes a genuine attempt to analyse and recommend as to whether
the company is an attractive investment opportunity (more relevantly to an equity share
holder). In order to achieve all the objectives of the report, the report relies on the inputs from
following sources:
Annual reports of the company;
Public domains such as Yahoo Finance and Bloomberg; and
Other relevant journals which can help with the direction of the report.
The Analysis
The following areas are analysed in order to ascertain whether or not the company is a good
investment option:
Value addition to the stakeholders
Trend in share prices
Return on Investment
Theoretical Value of the equity of the company;
Dividend policy of the company; and
Capital structure of the company
Maximization of Stakeholders’ Value:
Stakeholder of a company –
Stakeholders are either individuals or groups or both that have an interest in the progression
and prosperity of a company.
Stakeholder of a company –
Stakeholders are either individuals or groups or both that have an interest in the progression
and prosperity of a company. A stakeholder may be internal or external. Internal stakeholder
is one who has invested in the company (say an equity shareholder) or engaged in
employment by the company (say employees) while the external stakeholders include
business .
Maximisation of Stakeholder Value –
The concept emerges from a management philosophy called ‘stakeholder approach’ that
regards maximisation or furtherance of the interest of the stakeholder (either internal or
external) as its most important object
Metrics that measure the value of stakeholders:
The following metrics are used to measure the value of stakeholders. ("5 must-have metrics for value
investors", n.d.)
2013 2014 2015 2016 2017
a Price of share 68.18 58.00 44.71 59.90 75.81
b Earnings per share 1.98 3.53 0.48 2.57 4.90
c Total Assets (in millions) 111025.0
0
107827.0
0
91564.0
0
89263.0
0
95726.0
0
d Total Liabilities (in millions) 57523.00 53233.00 47436.0
0
43533.0
0
44611.0
0
e Book Value (in millions) = c - d 53502.00 54594.00 44128.0
0
45730.0
0
51115.0
0
f Debt (in millions) 57523.00 53233.00 47436.0
0
43533.0
0
44611.0
0
g Equity (in millions) 53502.00 54594.00 44128.0
0
45730.0
0
51115.0
0
h No. of Shares O/s 1861.14 1861.14 1808.19 1772.69 1763.41
i Earnings Growth 78% -113% 641% 91%
j Net Profit (in millions) 1,079 6499 -1719 4776 8851
k P/E Ratio = a/b 34.36 16.43 94.13 23.32 15.46
l Book Value per share = e/h 28.75 29.33 24.40 25.80 28.99
m PEG Ratio = a/i 21.07 82.97 3.64 17.01
n Return on Assets = j/c 0.97% 6.03% -1.88% 5.35% 9.25%
o Return on Equity = j/g 2.02% 11.90% -3.90% 10.44% 17.32%
p P / BV per share = a/l 2.37 1.98 1.83 2.32 2.62
q Debt to Equity Ratio = f/g 1.08 0.98 1.07 0.95 0.87
Stakeholder of a company –
Stakeholders are either individuals or groups or both that have an interest in the progression
and prosperity of a company.
Stakeholder of a company –
Stakeholders are either individuals or groups or both that have an interest in the progression
and prosperity of a company. A stakeholder may be internal or external. Internal stakeholder
is one who has invested in the company (say an equity shareholder) or engaged in
employment by the company (say employees) while the external stakeholders include
business .
Maximisation of Stakeholder Value –
The concept emerges from a management philosophy called ‘stakeholder approach’ that
regards maximisation or furtherance of the interest of the stakeholder (either internal or
external) as its most important object
Metrics that measure the value of stakeholders:
The following metrics are used to measure the value of stakeholders. ("5 must-have metrics for value
investors", n.d.)
2013 2014 2015 2016 2017
a Price of share 68.18 58.00 44.71 59.90 75.81
b Earnings per share 1.98 3.53 0.48 2.57 4.90
c Total Assets (in millions) 111025.0
0
107827.0
0
91564.0
0
89263.0
0
95726.0
0
d Total Liabilities (in millions) 57523.00 53233.00 47436.0
0
43533.0
0
44611.0
0
e Book Value (in millions) = c - d 53502.00 54594.00 44128.0
0
45730.0
0
51115.0
0
f Debt (in millions) 57523.00 53233.00 47436.0
0
43533.0
0
44611.0
0
g Equity (in millions) 53502.00 54594.00 44128.0
0
45730.0
0
51115.0
0
h No. of Shares O/s 1861.14 1861.14 1808.19 1772.69 1763.41
i Earnings Growth 78% -113% 641% 91%
j Net Profit (in millions) 1,079 6499 -1719 4776 8851
k P/E Ratio = a/b 34.36 16.43 94.13 23.32 15.46
l Book Value per share = e/h 28.75 29.33 24.40 25.80 28.99
m PEG Ratio = a/i 21.07 82.97 3.64 17.01
n Return on Assets = j/c 0.97% 6.03% -1.88% 5.35% 9.25%
o Return on Equity = j/g 2.02% 11.90% -3.90% 10.44% 17.32%
p P / BV per share = a/l 2.37 1.98 1.83 2.32 2.62
q Debt to Equity Ratio = f/g 1.08 0.98 1.07 0.95 0.87
⊘ This is a preview!⊘
Do you want full access?
Subscribe today to unlock all pages.
Trusted by 1+ million students worldwide

The inputs were obtained from Annual Reports of Rio Tinto (2017 Annual Report, 2018); (2016 Annual Report,
2017); (2015 Annual Report, 2016); (2014 Annual Report, 2015); (2013 Annual Report, 2014); ("Price Earnings
Ratio - Formula, Examples and Guide to P/E Ratio", n.d.)
2017); (2015 Annual Report, 2016); (2014 Annual Report, 2015); (2013 Annual Report, 2014); ("Price Earnings
Ratio - Formula, Examples and Guide to P/E Ratio", n.d.)
Paraphrase This Document
Need a fresh take? Get an instant paraphrase of this document with our AI Paraphraser
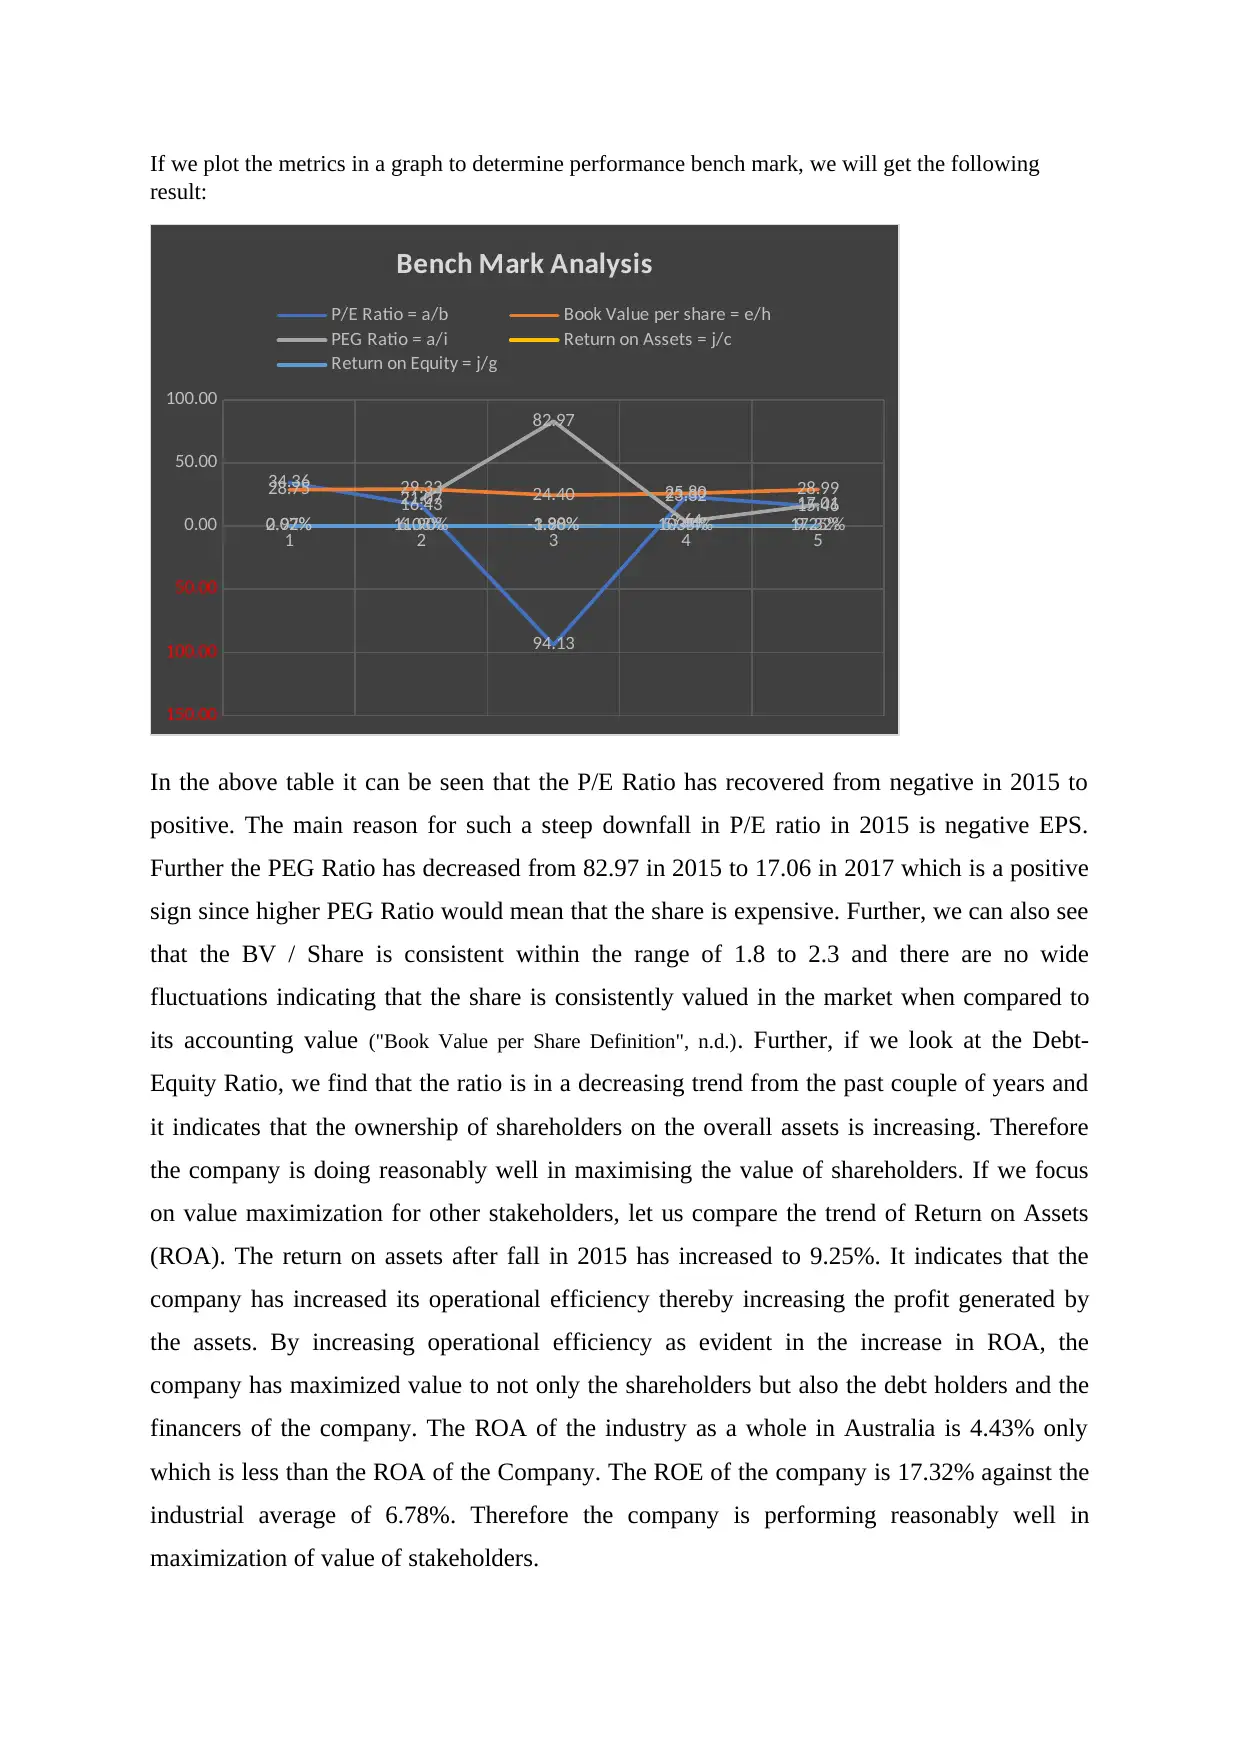
If we plot the metrics in a graph to determine performance bench mark, we will get the following
result:
1 2 3 4 5
150.00
100.00
50.00
0.00
50.00
100.00
34.36
16.43
94.13
23.32 15.46
28.75 29.33 24.40 25.80 28.99
21.07
82.97
3.64 17.01
0.97% 6.03% -1.88% 5.35% 9.25%2.02% 11.90% -3.90% 10.44% 17.32%
Bench Mark Analysis
P/E Ratio = a/b Book Value per share = e/h
PEG Ratio = a/i Return on Assets = j/c
Return on Equity = j/g
In the above table it can be seen that the P/E Ratio has recovered from negative in 2015 to
positive. The main reason for such a steep downfall in P/E ratio in 2015 is negative EPS.
Further the PEG Ratio has decreased from 82.97 in 2015 to 17.06 in 2017 which is a positive
sign since higher PEG Ratio would mean that the share is expensive. Further, we can also see
that the BV / Share is consistent within the range of 1.8 to 2.3 and there are no wide
fluctuations indicating that the share is consistently valued in the market when compared to
its accounting value ("Book Value per Share Definition", n.d.). Further, if we look at the Debt-
Equity Ratio, we find that the ratio is in a decreasing trend from the past couple of years and
it indicates that the ownership of shareholders on the overall assets is increasing. Therefore
the company is doing reasonably well in maximising the value of shareholders. If we focus
on value maximization for other stakeholders, let us compare the trend of Return on Assets
(ROA). The return on assets after fall in 2015 has increased to 9.25%. It indicates that the
company has increased its operational efficiency thereby increasing the profit generated by
the assets. By increasing operational efficiency as evident in the increase in ROA, the
company has maximized value to not only the shareholders but also the debt holders and the
financers of the company. The ROA of the industry as a whole in Australia is 4.43% only
which is less than the ROA of the Company. The ROE of the company is 17.32% against the
industrial average of 6.78%. Therefore the company is performing reasonably well in
maximization of value of stakeholders.
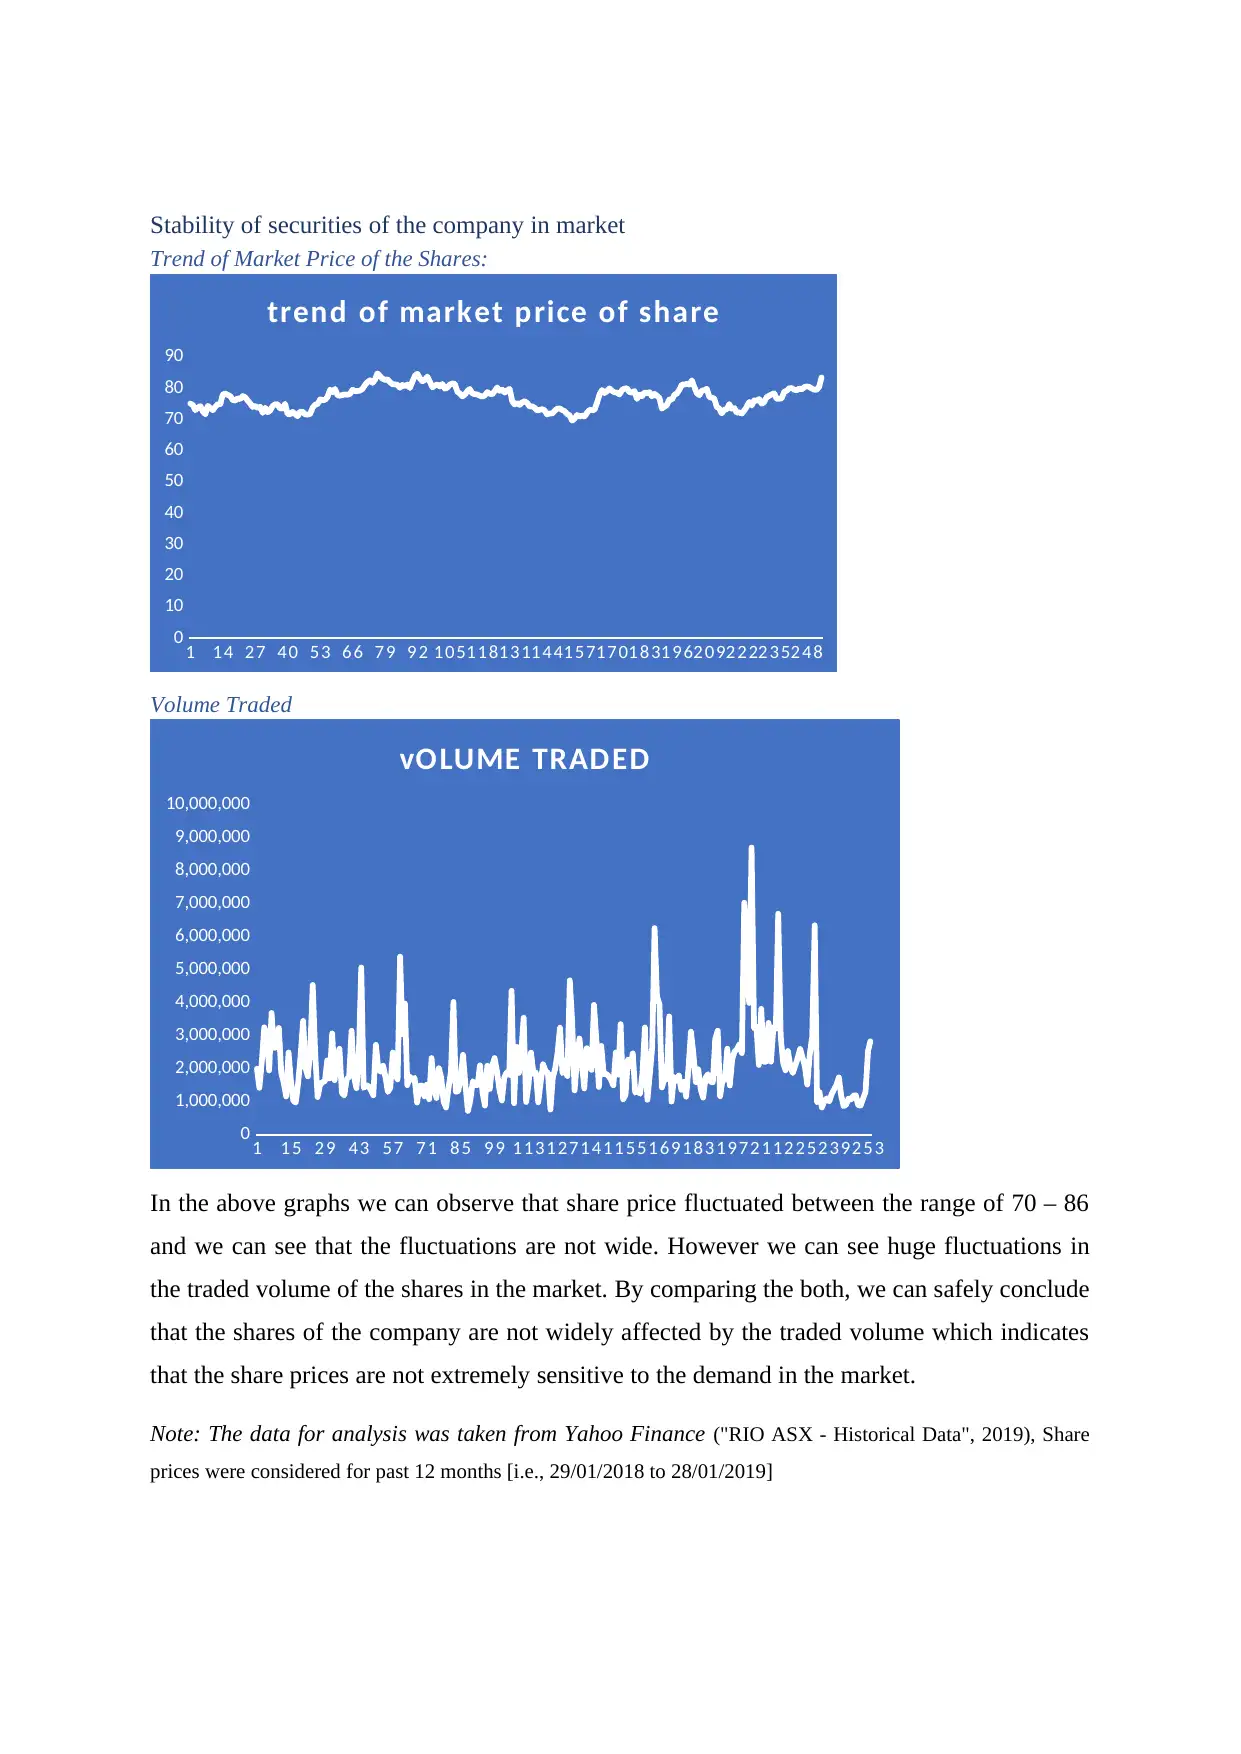
Stability of securities of the company in market
Trend of Market Price of the Shares:
1 1 4 2 7 4 0 5 3 6 6 7 9 9 2 1 051 181 311 441 571 701 831 962 092 222 352 48
0
10
20
30
40
50
60
70
80
90
trend of market price of share
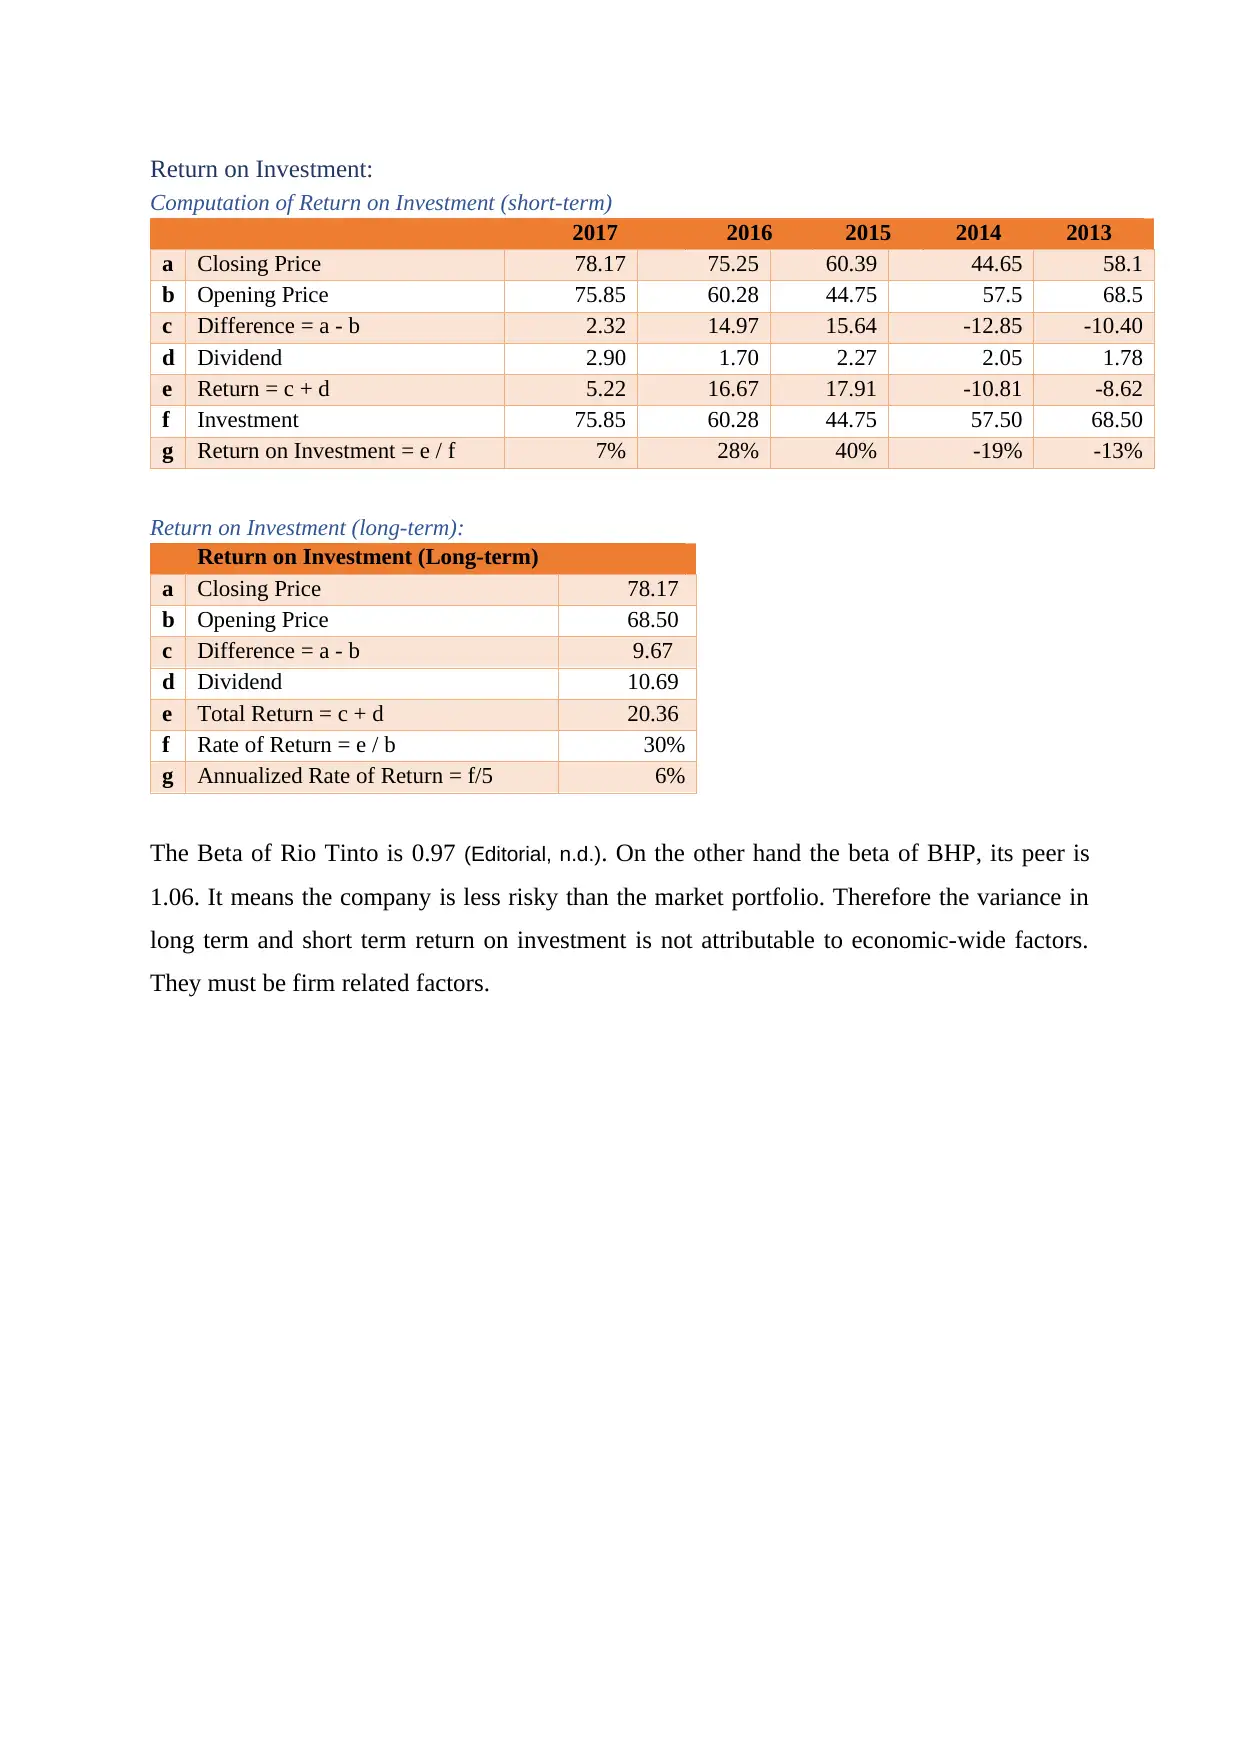
Volume Traded
1 1 5 2 9 4 3 5 7 7 1 8 5 9 9 1 131 271 411 551 691 831 972 112 252 392 53
0
1,000,000
2,000,000
3,000,000
4,000,000
5,000,000
6,000,000
7,000,000
8,000,000
9,000,000
10,000,000
vOLUME TRADED
In the above graphs we can observe that share price fluctuated between the range of 70 – 86
and we can see that the fluctuations are not wide. However we can see huge fluctuations in
the traded volume of the shares in the market. By comparing the both, we can safely conclude
that the shares of the company are not widely affected by the traded volume which indicates
that the share prices are not extremely sensitive to the demand in the market.
Note: The data for analysis was taken from Yahoo Finance ("RIO ASX - Historical Data", 2019), Share
prices were considered for past 12 months [i.e., 29/01/2018 to 28/01/2019]
Trend of Market Price of the Shares:
1 1 4 2 7 4 0 5 3 6 6 7 9 9 2 1 051 181 311 441 571 701 831 962 092 222 352 48
0
10
20
30
40
50
60
70
80
90
trend of market price of share
Volume Traded
1 1 5 2 9 4 3 5 7 7 1 8 5 9 9 1 131 271 411 551 691 831 972 112 252 392 53
0
1,000,000
2,000,000
3,000,000
4,000,000
5,000,000
6,000,000
7,000,000
8,000,000
9,000,000
10,000,000
vOLUME TRADED
In the above graphs we can observe that share price fluctuated between the range of 70 – 86
and we can see that the fluctuations are not wide. However we can see huge fluctuations in
the traded volume of the shares in the market. By comparing the both, we can safely conclude
that the shares of the company are not widely affected by the traded volume which indicates
that the share prices are not extremely sensitive to the demand in the market.
Note: The data for analysis was taken from Yahoo Finance ("RIO ASX - Historical Data", 2019), Share
prices were considered for past 12 months [i.e., 29/01/2018 to 28/01/2019]
⊘ This is a preview!⊘
Do you want full access?
Subscribe today to unlock all pages.
Trusted by 1+ million students worldwide
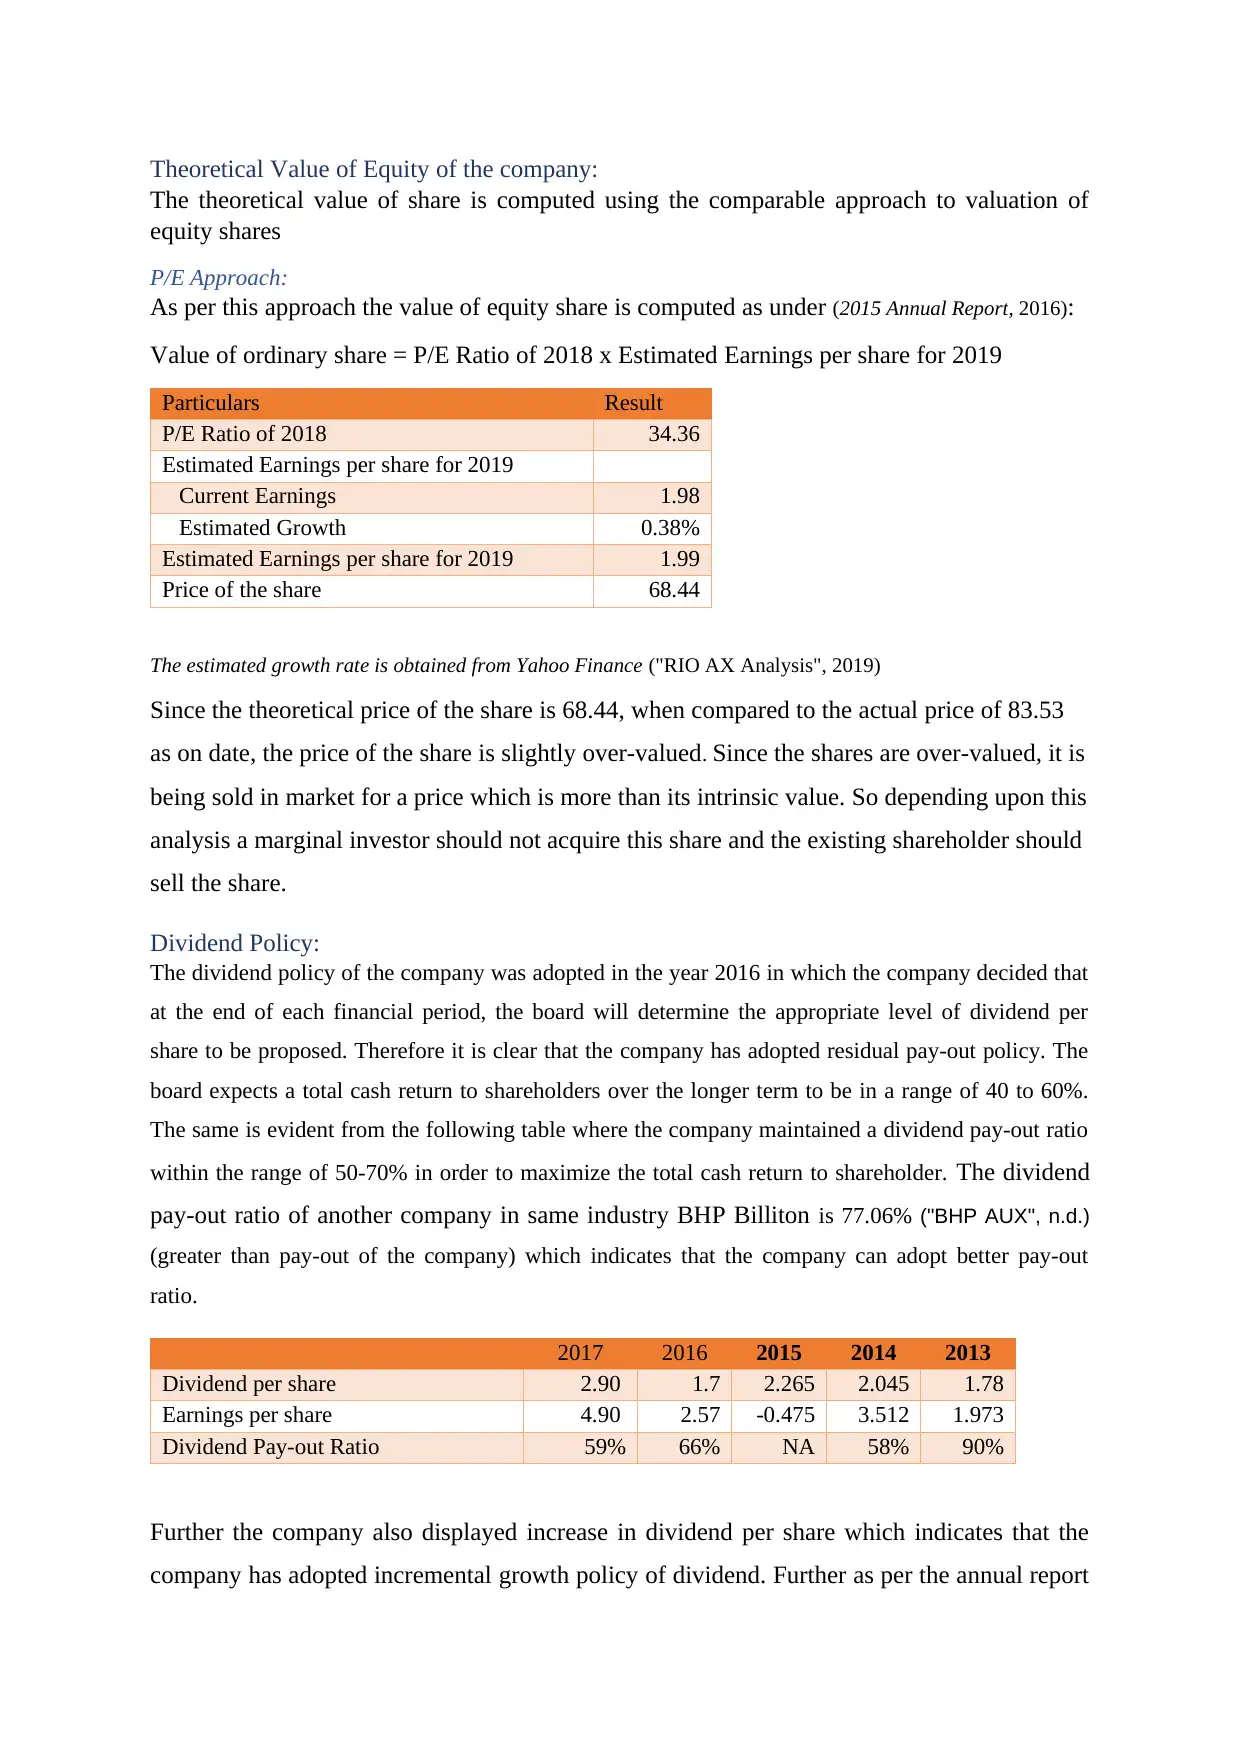
Return on Investment:
Computation of Return on Investment (short-term)
2017 2016 2015 2014 2013
a Closing Price 78.17 75.25 60.39 44.65 58.1
b Opening Price 75.85 60.28 44.75 57.5 68.5
c Difference = a - b 2.32 14.97 15.64 -12.85 -10.40
d Dividend 2.90 1.70 2.27 2.05 1.78
e Return = c + d 5.22 16.67 17.91 -10.81 -8.62
f Investment 75.85 60.28 44.75 57.50 68.50
g Return on Investment = e / f 7% 28% 40% -19% -13%
Return on Investment (long-term):
Return on Investment (Long-term)
a Closing Price 78.17
b Opening Price 68.50
c Difference = a - b 9.67
d Dividend 10.69
e Total Return = c + d 20.36
f Rate of Return = e / b 30%
g Annualized Rate of Return = f/5 6%
The Beta of Rio Tinto is 0.97 (Editorial, n.d.). On the other hand the beta of BHP, its peer is
1.06. It means the company is less risky than the market portfolio. Therefore the variance in
long term and short term return on investment is not attributable to economic-wide factors.
They must be firm related factors.
Paraphrase This Document
Need a fresh take? Get an instant paraphrase of this document with our AI Paraphraser
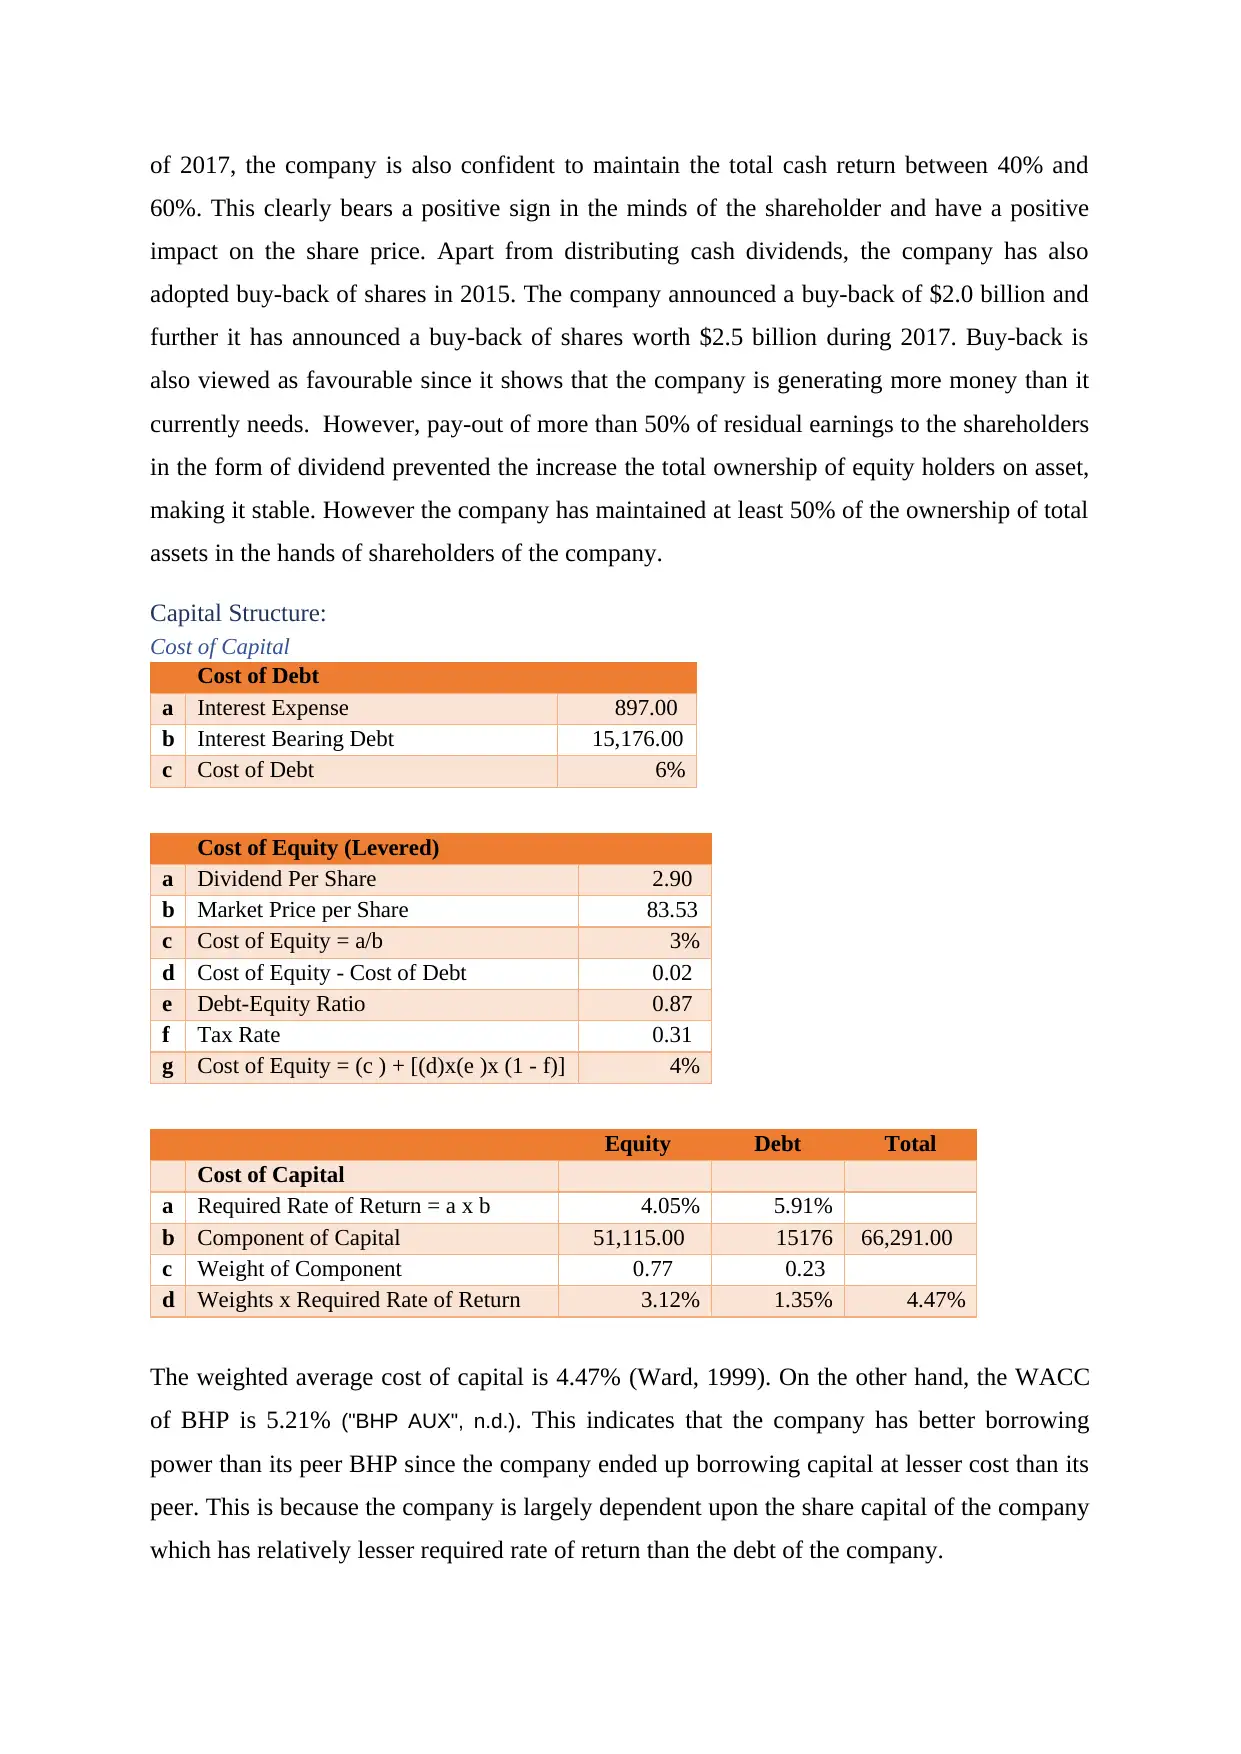
Theoretical Value of Equity of the company:
The theoretical value of share is computed using the comparable approach to valuation of
equity shares
P/E Approach:
As per this approach the value of equity share is computed as under (2015 Annual Report, 2016):
Value of ordinary share = P/E Ratio of 2018 x Estimated Earnings per share for 2019
Particulars Result
P/E Ratio of 2018 34.36
Estimated Earnings per share for 2019
Current Earnings 1.98
Estimated Growth 0.38%
Estimated Earnings per share for 2019 1.99
Price of the share 68.44
The estimated growth rate is obtained from Yahoo Finance ("RIO AX Analysis", 2019)
Since the theoretical price of the share is 68.44, when compared to the actual price of 83.53
as on date, the price of the share is slightly over-valued. Since the shares are over-valued, it is
being sold in market for a price which is more than its intrinsic value. So depending upon this
analysis a marginal investor should not acquire this share and the existing shareholder should
sell the share.
Dividend Policy:
The dividend policy of the company was adopted in the year 2016 in which the company decided that
at the end of each financial period, the board will determine the appropriate level of dividend per
share to be proposed. Therefore it is clear that the company has adopted residual pay-out policy. The
board expects a total cash return to shareholders over the longer term to be in a range of 40 to 60%.
The same is evident from the following table where the company maintained a dividend pay-out ratio
within the range of 50-70% in order to maximize the total cash return to shareholder. The dividend
pay-out ratio of another company in same industry BHP Billiton is 77.06% ("BHP AUX", n.d.)
(greater than pay-out of the company) which indicates that the company can adopt better pay-out
ratio.
2017 2016 2015 2014 2013
Dividend per share 2.90 1.7 2.265 2.045 1.78
Earnings per share 4.90 2.57 -0.475 3.512 1.973
Dividend Pay-out Ratio 59% 66% NA 58% 90%
Further the company also displayed increase in dividend per share which indicates that the
company has adopted incremental growth policy of dividend. Further as per the annual report
of 2017, the company is also confident to maintain the total cash return between 40% and
60%. This clearly bears a positive sign in the minds of the shareholder and have a positive
impact on the share price. Apart from distributing cash dividends, the company has also
adopted buy-back of shares in 2015. The company announced a buy-back of $2.0 billion and
further it has announced a buy-back of shares worth $2.5 billion during 2017. Buy-back is
also viewed as favourable since it shows that the company is generating more money than it
currently needs. However, pay-out of more than 50% of residual earnings to the shareholders
in the form of dividend prevented the increase the total ownership of equity holders on asset,
making it stable. However the company has maintained at least 50% of the ownership of total
assets in the hands of shareholders of the company.
Capital Structure:
Cost of Capital
Cost of Debt
a Interest Expense 897.00
b Interest Bearing Debt 15,176.00
c Cost of Debt 6%
Cost of Equity (Levered)
a Dividend Per Share 2.90
b Market Price per Share 83.53
c Cost of Equity = a/b 3%
d Cost of Equity - Cost of Debt 0.02
e Debt-Equity Ratio 0.87
f Tax Rate 0.31
g Cost of Equity = (c ) + [(d)x(e )x (1 - f)] 4%
Equity Debt Total
Cost of Capital
a Required Rate of Return = a x b 4.05% 5.91%
b Component of Capital 51,115.00 15176 66,291.00
c Weight of Component 0.77 0.23
d Weights x Required Rate of Return 3.12% 1.35% 4.47%
The weighted average cost of capital is 4.47% (Ward, 1999). On the other hand, the WACC
of BHP is 5.21% ("BHP AUX", n.d.). This indicates that the company has better borrowing
power than its peer BHP since the company ended up borrowing capital at lesser cost than its
peer. This is because the company is largely dependent upon the share capital of the company
which has relatively lesser required rate of return than the debt of the company.
⊘ This is a preview!⊘
Do you want full access?
Subscribe today to unlock all pages.
Trusted by 1+ million students worldwide

Paraphrase This Document
Need a fresh take? Get an instant paraphrase of this document with our AI Paraphraser
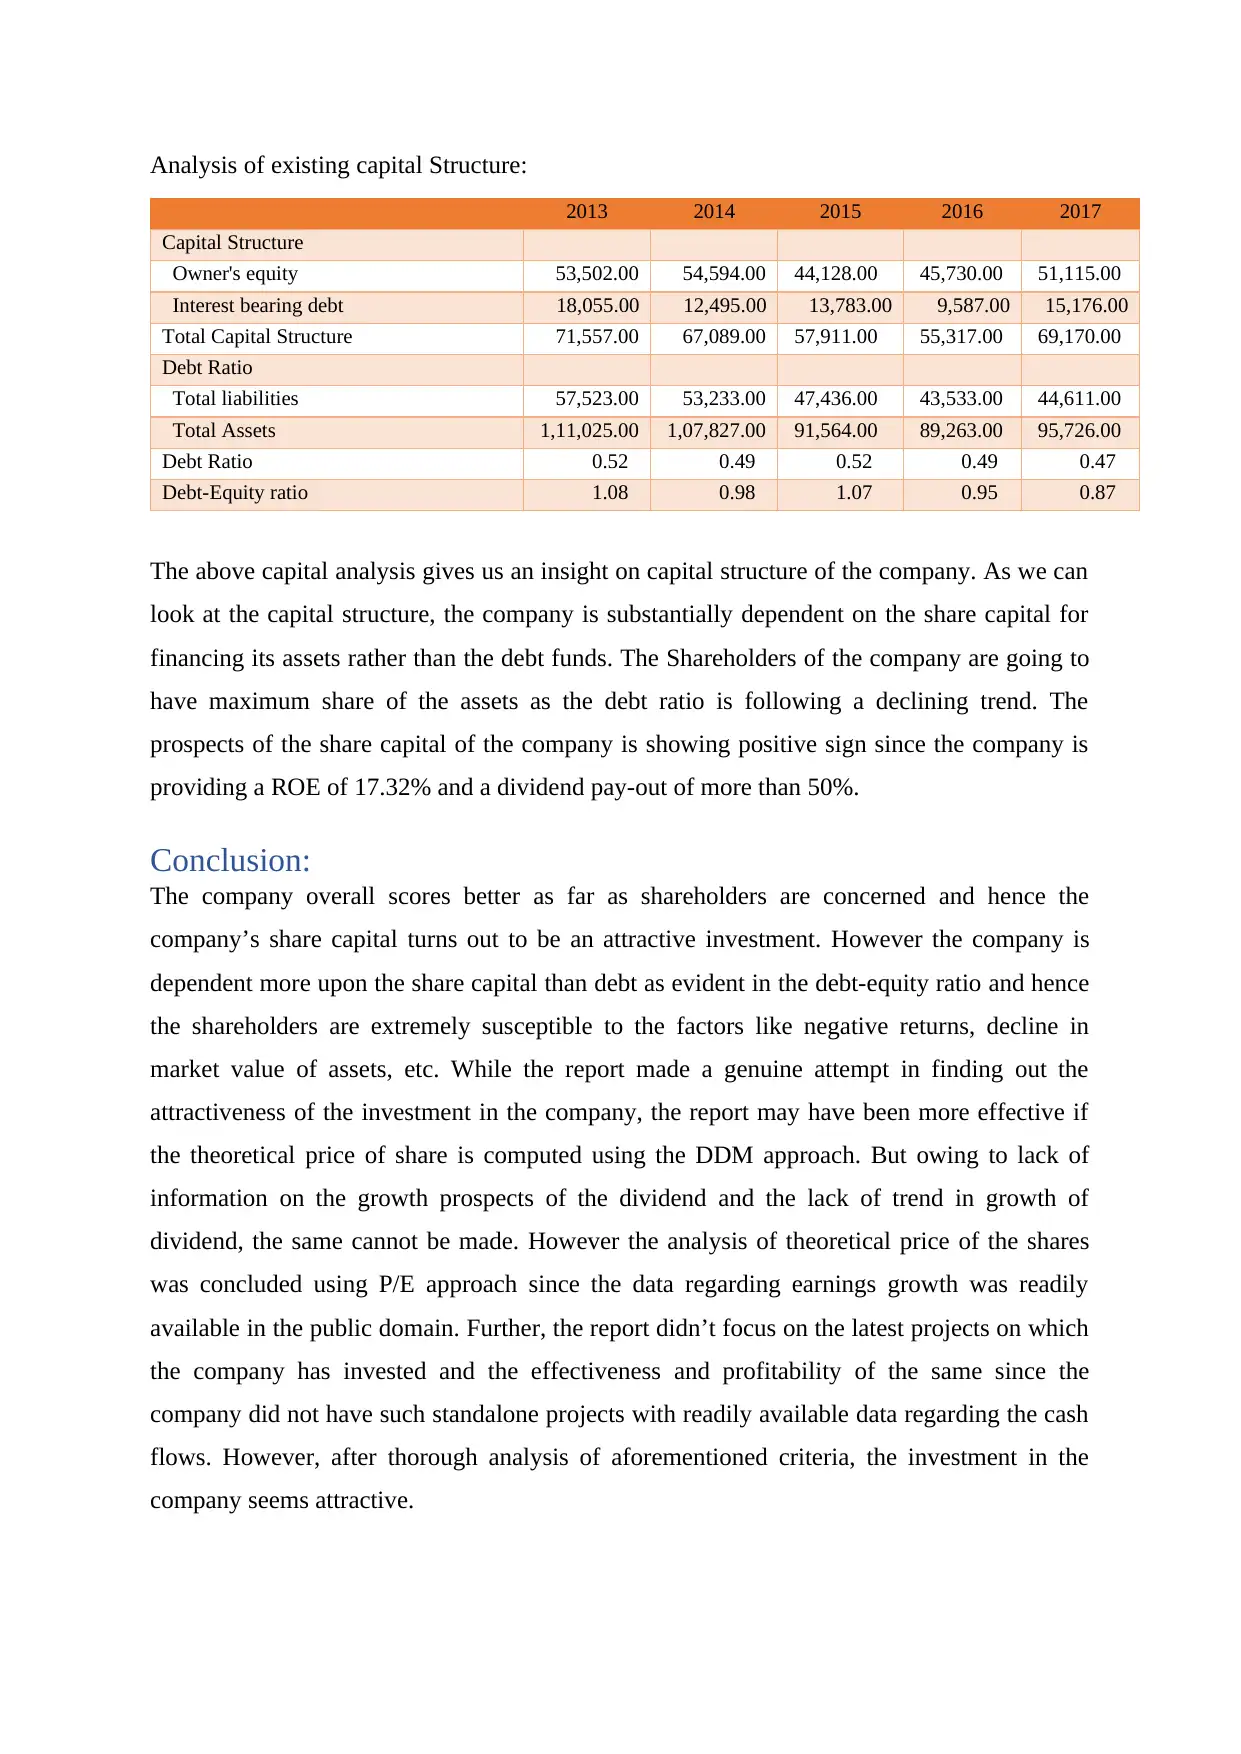
Analysis of existing capital Structure:
2013 2014 2015 2016 2017
Capital Structure
Owner's equity 53,502.00 54,594.00 44,128.00 45,730.00 51,115.00
Interest bearing debt 18,055.00 12,495.00 13,783.00 9,587.00 15,176.00
Total Capital Structure 71,557.00 67,089.00 57,911.00 55,317.00 69,170.00
Debt Ratio
Total liabilities 57,523.00 53,233.00 47,436.00 43,533.00 44,611.00
Total Assets 1,11,025.00 1,07,827.00 91,564.00 89,263.00 95,726.00
Debt Ratio 0.52 0.49 0.52 0.49 0.47
Debt-Equity ratio 1.08 0.98 1.07 0.95 0.87
The above capital analysis gives us an insight on capital structure of the company. As we can
look at the capital structure, the company is substantially dependent on the share capital for
financing its assets rather than the debt funds. The Shareholders of the company are going to
have maximum share of the assets as the debt ratio is following a declining trend. The
prospects of the share capital of the company is showing positive sign since the company is
providing a ROE of 17.32% and a dividend pay-out of more than 50%.
Conclusion:
The company overall scores better as far as shareholders are concerned and hence the
company’s share capital turns out to be an attractive investment. However the company is
dependent more upon the share capital than debt as evident in the debt-equity ratio and hence
the shareholders are extremely susceptible to the factors like negative returns, decline in
market value of assets, etc. While the report made a genuine attempt in finding out the
attractiveness of the investment in the company, the report may have been more effective if
the theoretical price of share is computed using the DDM approach. But owing to lack of
information on the growth prospects of the dividend and the lack of trend in growth of
dividend, the same cannot be made. However the analysis of theoretical price of the shares
was concluded using P/E approach since the data regarding earnings growth was readily
available in the public domain. Further, the report didn’t focus on the latest projects on which
the company has invested and the effectiveness and profitability of the same since the
company did not have such standalone projects with readily available data regarding the cash
flows. However, after thorough analysis of aforementioned criteria, the investment in the
company seems attractive.
Bibliography
RIO AX Analysis. (2019). Retrieved from https://in.finance.yahoo.com/quote/RIO.AX/analysis?p=RIO.AX
Rio Tinto. (2018). 2017 Annual Report. Melbourne.
Rio Tinto. (2017). 2016 Annual Report. Melbourne.
Rio Tinto. (2016). 2015 Annual Report. Melbourne.
Rio Tinto. (2015). 2014 Annual Report. Melbourne.
Rio Tinto. (2014). 2013 Annual Report. Melbourne.
Book Value per Share Definition. Retrieved from https://ycharts.com/glossary/terms/book_value_per_share
RIO ASX - Historical Data. (2019). Retrieved from https://in.finance.yahoo.com/quote/RIO.AX/history?
p=RIO.AX
Price Earnings Ratio - Formula, Examples and Guide to P/E Ratio. Retrieved from
https://corporatefinanceinstitute.com/resources/knowledge/valuation/price-earnings-ratio/
5 must-have metrics for value investors. Retrieved from https://www.investopedia.com/articles/fundamental-
analysis/09/five-must-have-metrics-value-investors.asp
Using the P/E Ratio to Value a Stock. Retrieved from https://www.thebalance.com/using-price-to-earnings-
356427
Ward, C. (1999). Estimating the cost of capital. Journal Of Corporate Real Estate, 1(3), 287-293. doi:
10.1108/14630019910811088
Editorial, R. ${Instrument_CompanyName} ${Instrument_Ric} Quote| Reuters.com. Retrieved from
https://www.reuters.com/finance/stocks/overview/RIO.AX
BHP AUX. Retrieved from https://in.finance.yahoo.com/quote/BHP.AX/key-statistics?p=BHP.AX
BHP AUX. Retrieved from https://in.finance.yahoo.com/quote/BHP.AX/financials?p=BHP.AX
⊘ This is a preview!⊘
Do you want full access?
Subscribe today to unlock all pages.
Trusted by 1+ million students worldwide
1 out of 12
Related Documents


Your All-in-One AI-Powered Toolkit for Academic Success.
+13062052269
info@desklib.com
Available 24*7 on WhatsApp / Email
![[object Object]](/_next/static/media/star-bottom.7253800d.svg)
Unlock your academic potential
Copyright © 2020–2026 A2Z Services. All Rights Reserved. Developed and managed by ZUCOL.