Statistics for Business: STA101 Assignment 1 Solution
VerifiedAdded on 2023/04/26
|4
|939
|291
Homework Assignment
AI Summary
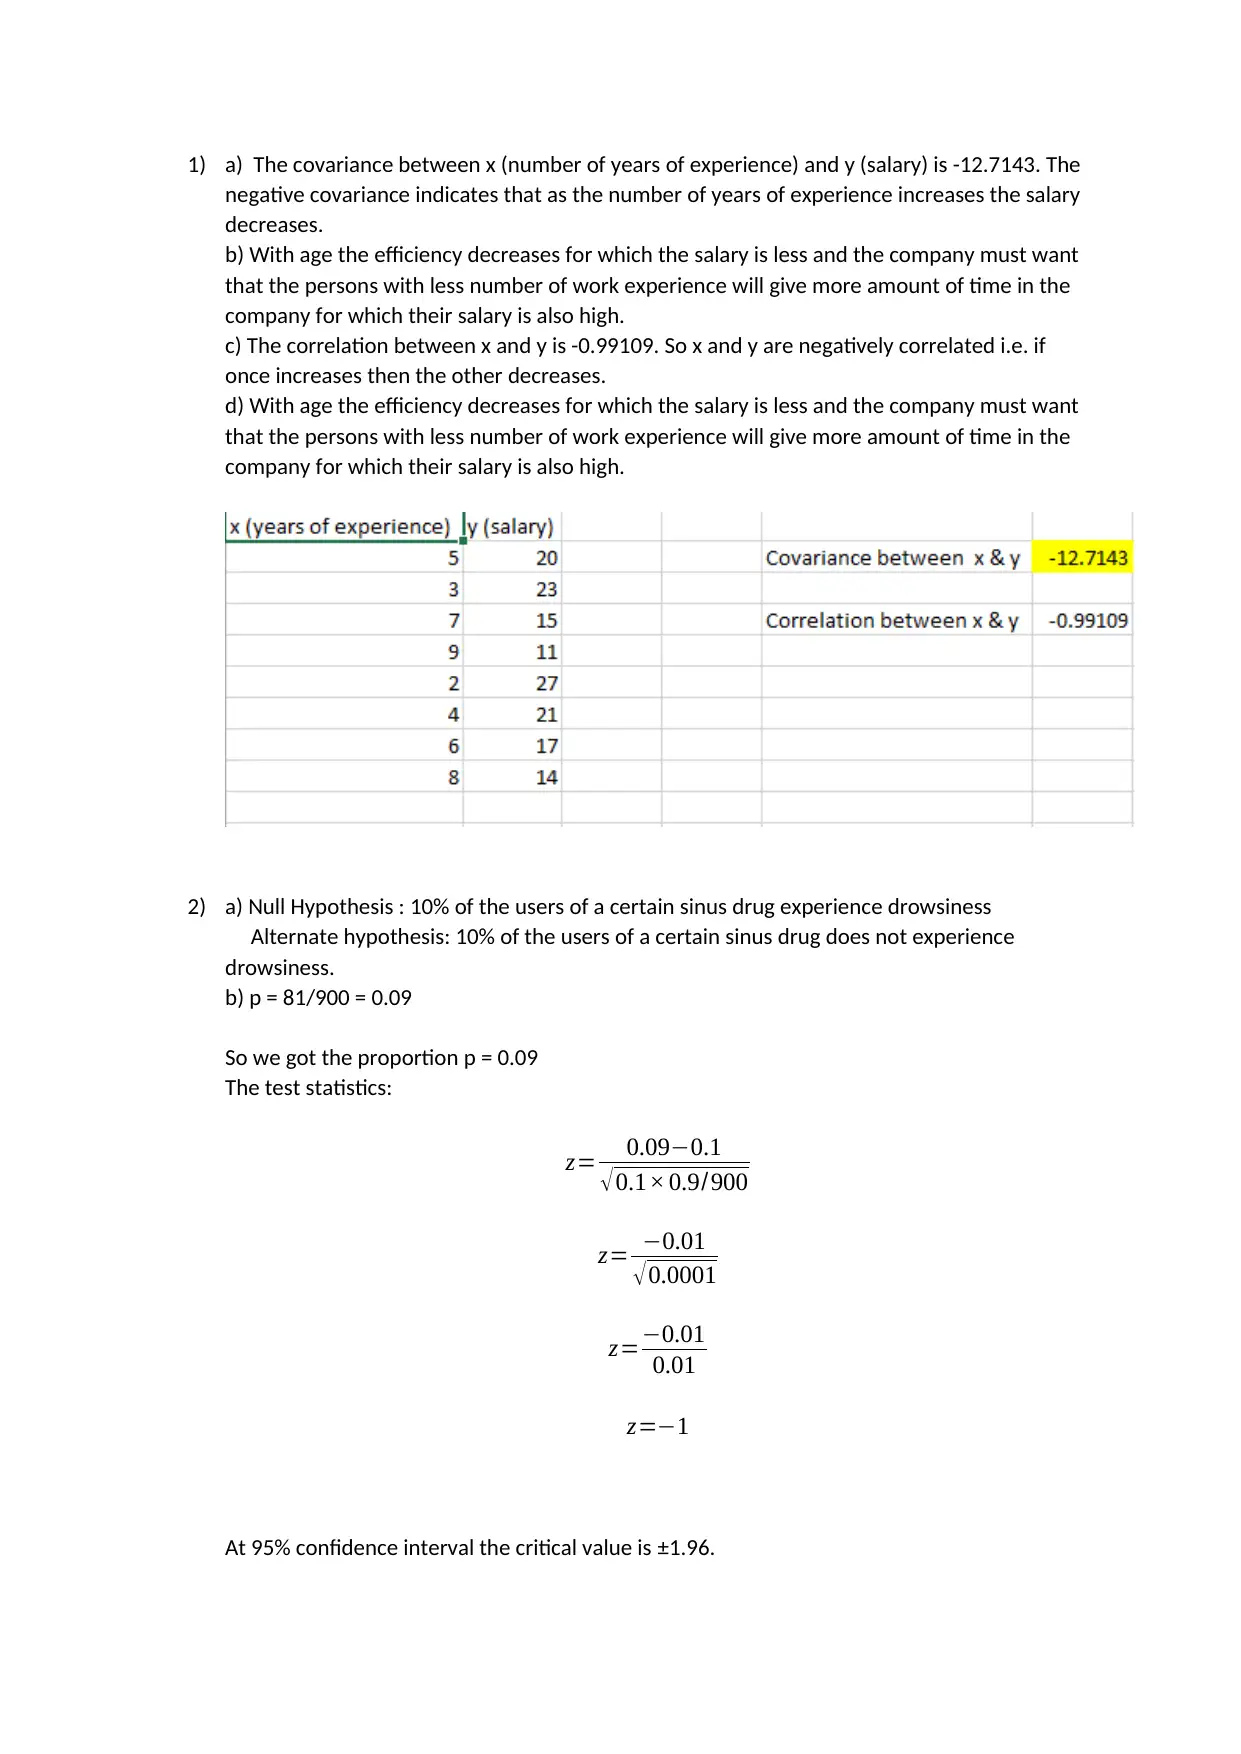
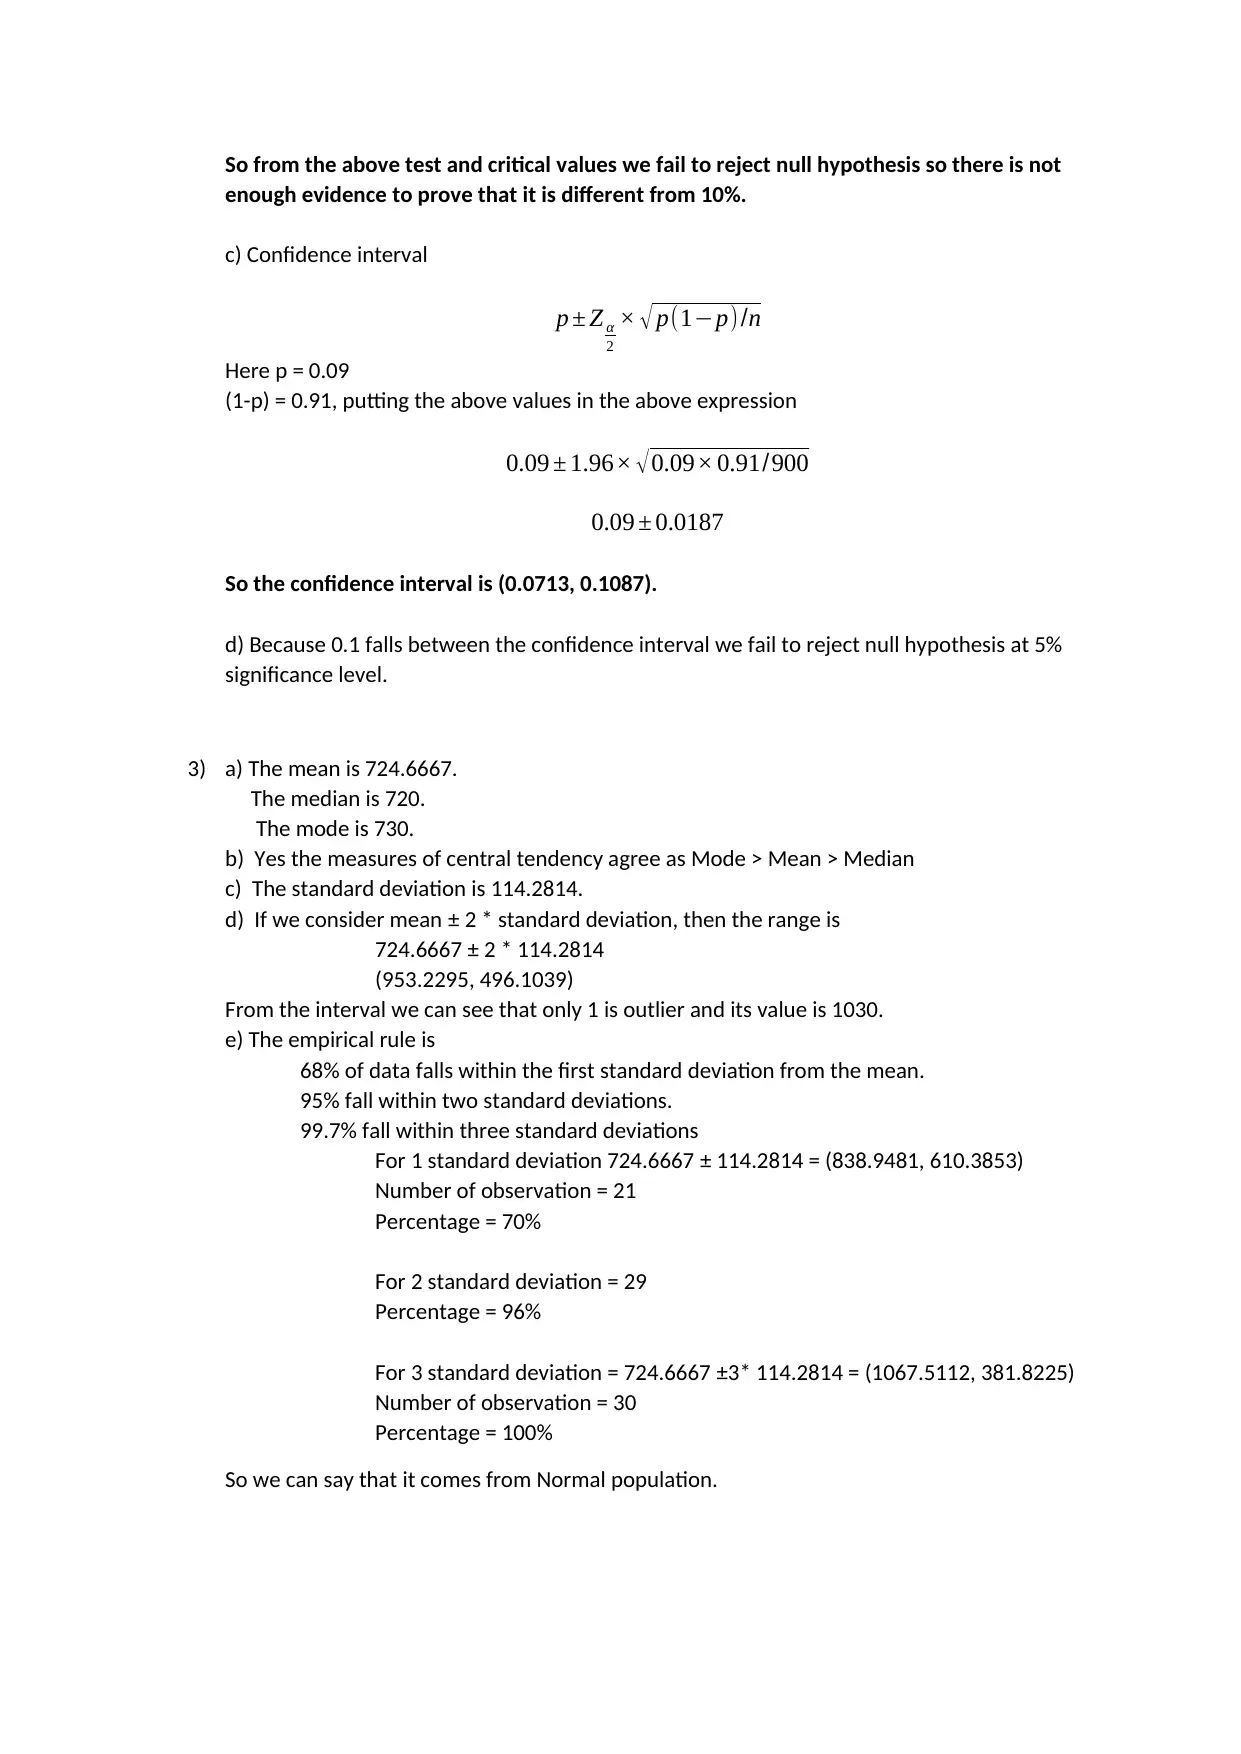
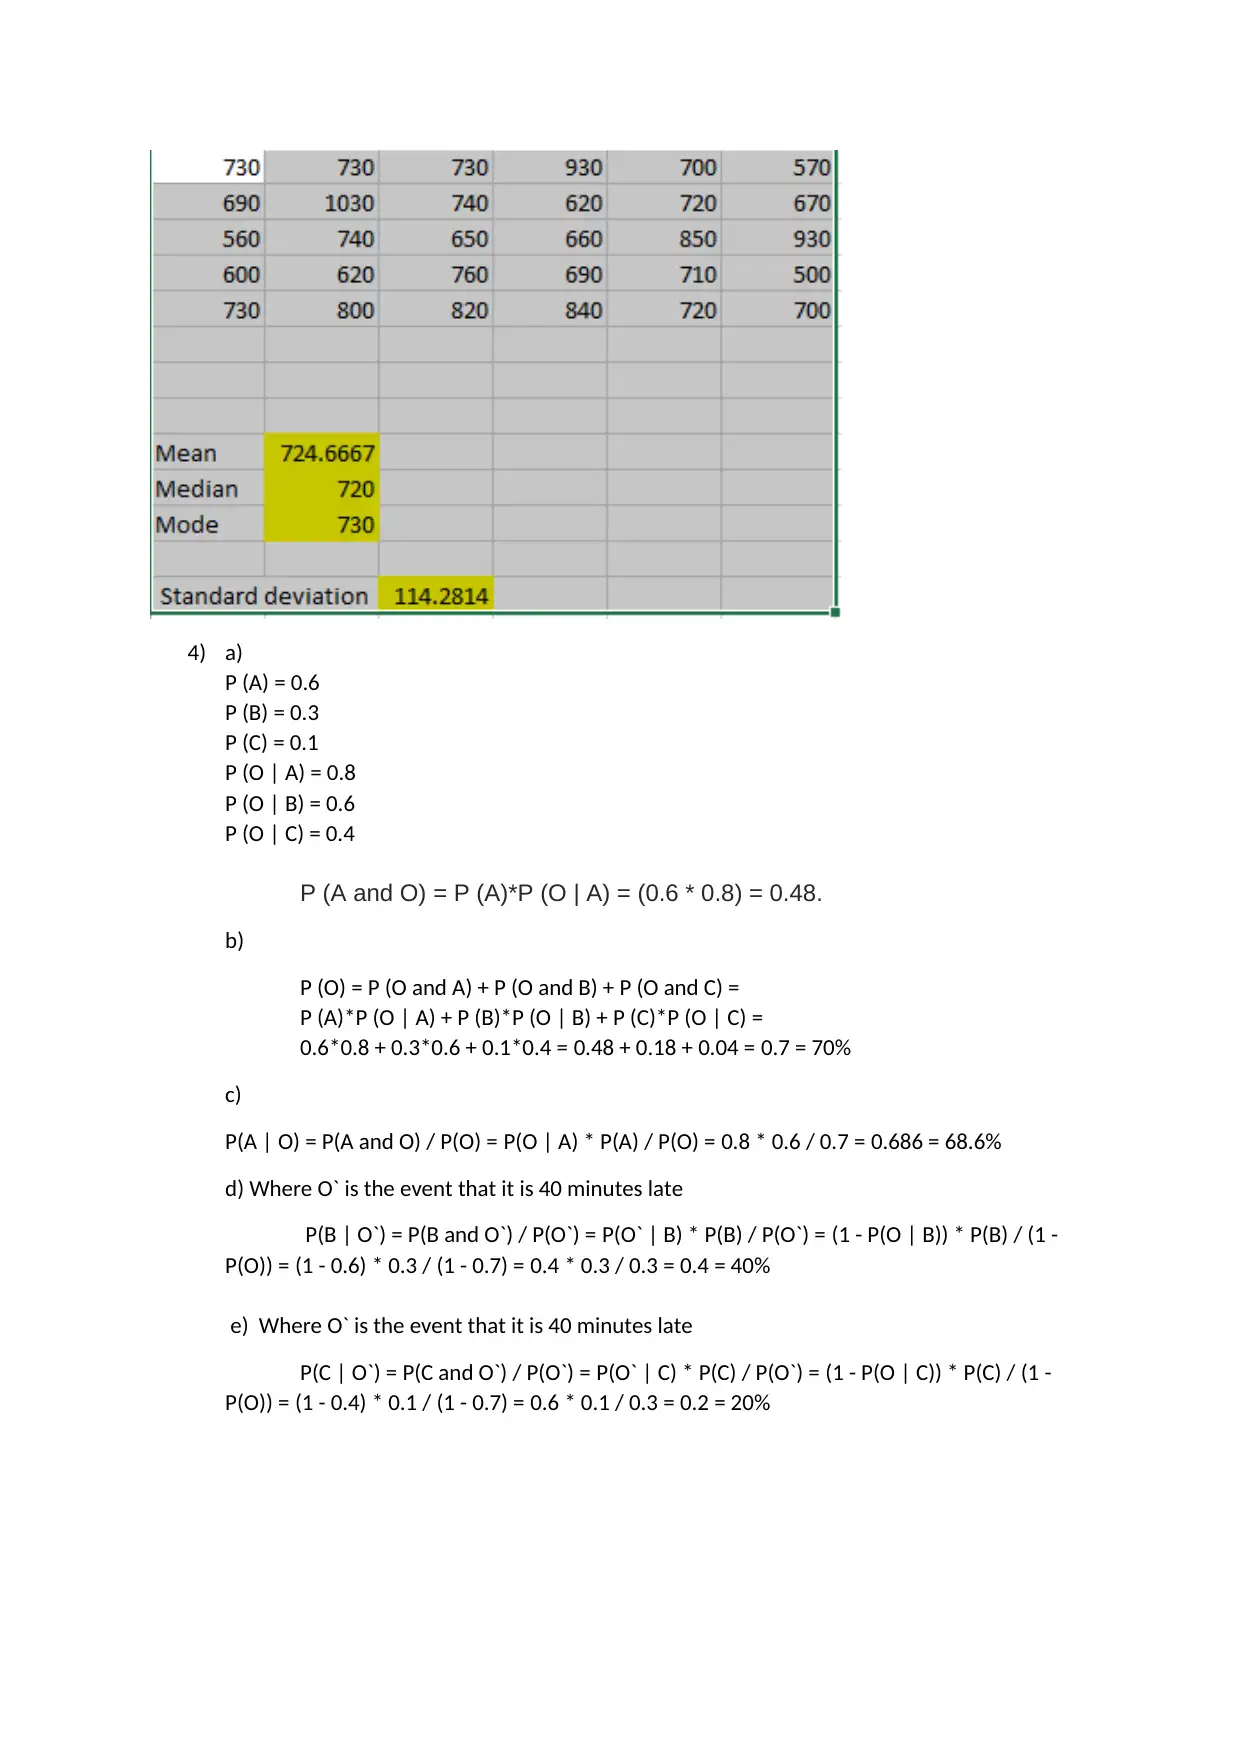
This document presents a complete solution to a STA101 Statistics for Business assignment. The solution includes detailed calculations and interpretations for each question. Question 1 covers covariance and correlation, exploring the relationship between years of experience and salary. Question 2 addresses hypothesis testing and confidence intervals related to a scenario involving a sinus drug. Question 3 delves into descriptive statistics, calculating mean, median, mode, standard deviation, identifying outliers, and applying the empirical rule. Finally, Question 4 explores probability, calculating probabilities of events, and conditional probabilities using Bayes' theorem. The assignment is fully explained and provides insights into statistical concepts.

1 out of 4
Related Documents


Your All-in-One AI-Powered Toolkit for Academic Success.
+13062052269
info@desklib.com
Available 24*7 on WhatsApp / Email
![[object Object]](/_next/static/media/star-bottom.7253800d.svg)
Copyright © 2020–2026 A2Z Services. All Rights Reserved. Developed and managed by ZUCOL.