Comparing Z-scores | Statistics and Probability -
Added on 2022-09-06
6 Pages980 Words18 Views
The first questions review z-scores and confidence intervals for normal distributions.
Suppose we are working with a normally-distributed data source with mean = 2 and
standard deviation = 1.
1) If we observe x = 3, what is the z-score?
Z= x −μ
δ =3−2
1 =1
2) If x = -2, what is the z-score?
Z= x −μ
δ =−2−2
1 =−4
3) What is the value of x that corresponds to a z-score of 3?
Z= x −μ
δ
3= x−2
1
3=x−2
x=5
4) 98% of the time we expect to see range of z-scores between _-3.9__ and
_2.055__ (fill in the blanks)
Using the Z tables
98 % corresponds ¿ a Z score of 2.055
That means 98% of the time the Z score ranges between -3.9 and 2.055
5) 98% of the time we expect to see a range of x-values between __-1.9__ and
4.055____ (fill in the blanks)
The Z scores changes to x values gives x=z +2
for -3.9
x=−3.9+2=−1.9
For 2.055
x=2.055+2=4.055
The next set of questions is about the basics of linear regression.
6) Given data about two variables x and y, where we think of x as a predictor of
y, linear regression produces a formula for a line to do the prediction. What is
the generic formula for that line?
Th general formula for a linear regression line is
y=ax+ b
where a is the slope and b the y intercept
7) Suppose we have two points (x,y) = (0,1) and (1,2). Find the equation for the
line between the points. Write the formula and draw the line and points.
Since it is exact, this is the same as the linear regression line.
F ormula : y=ax +b
Slope ¿ 2−1
1−0 =1
Using the point (1,2) and the slope
2= (1∗1 ) +b
1
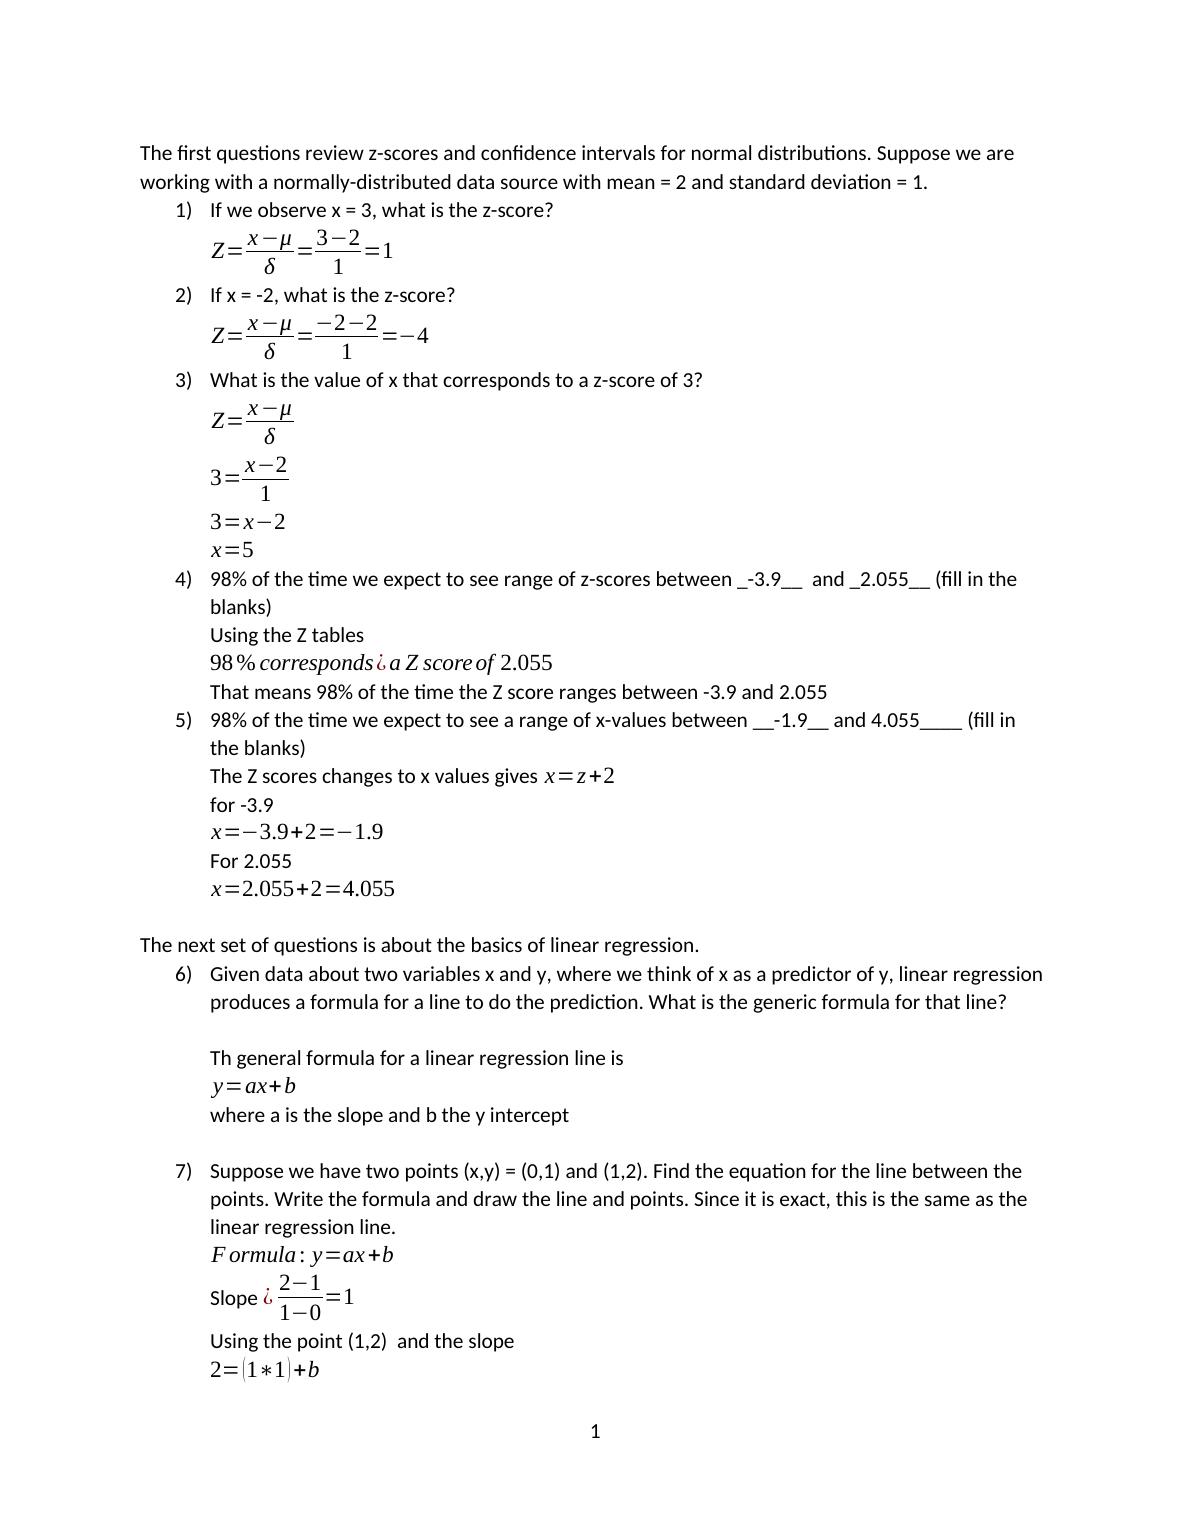
b=1
hence the linear equation is
y=x +1
Graph
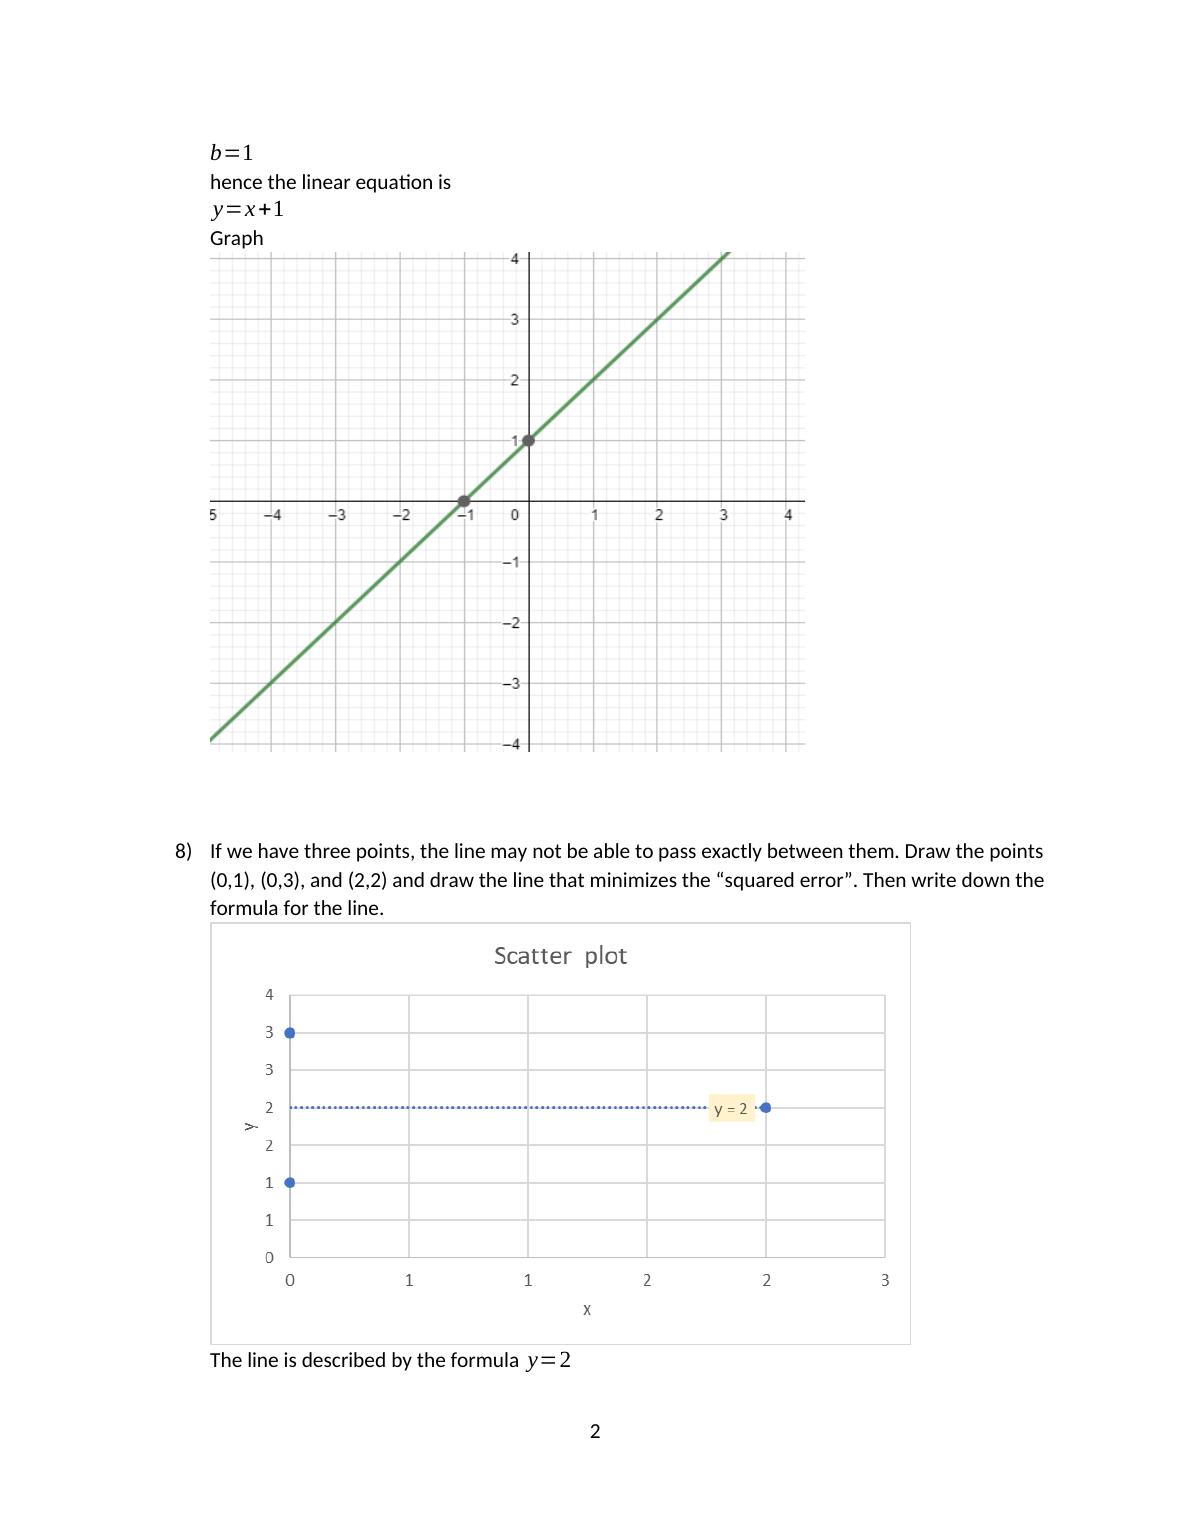
8) If we have three points, the line may not be able to pass exactly between
them. Draw the points (0,1), (0,3), and (2,2) and draw the line that minimizes
the “squared error”. Then write down the formula for the line.
The line is described by the formula y=2
2
hence the linear equation is
y=x +1
Graph
8) If we have three points, the line may not be able to pass exactly between
them. Draw the points (0,1), (0,3), and (2,2) and draw the line that minimizes
the “squared error”. Then write down the formula for the line.
The line is described by the formula y=2
2
9) Explain what it means that the regression line “minimizes squared error.”
Regression minimizes the squared error is the line of best fit, this is to say it’s
the line that best predicts the association between the y and x values.
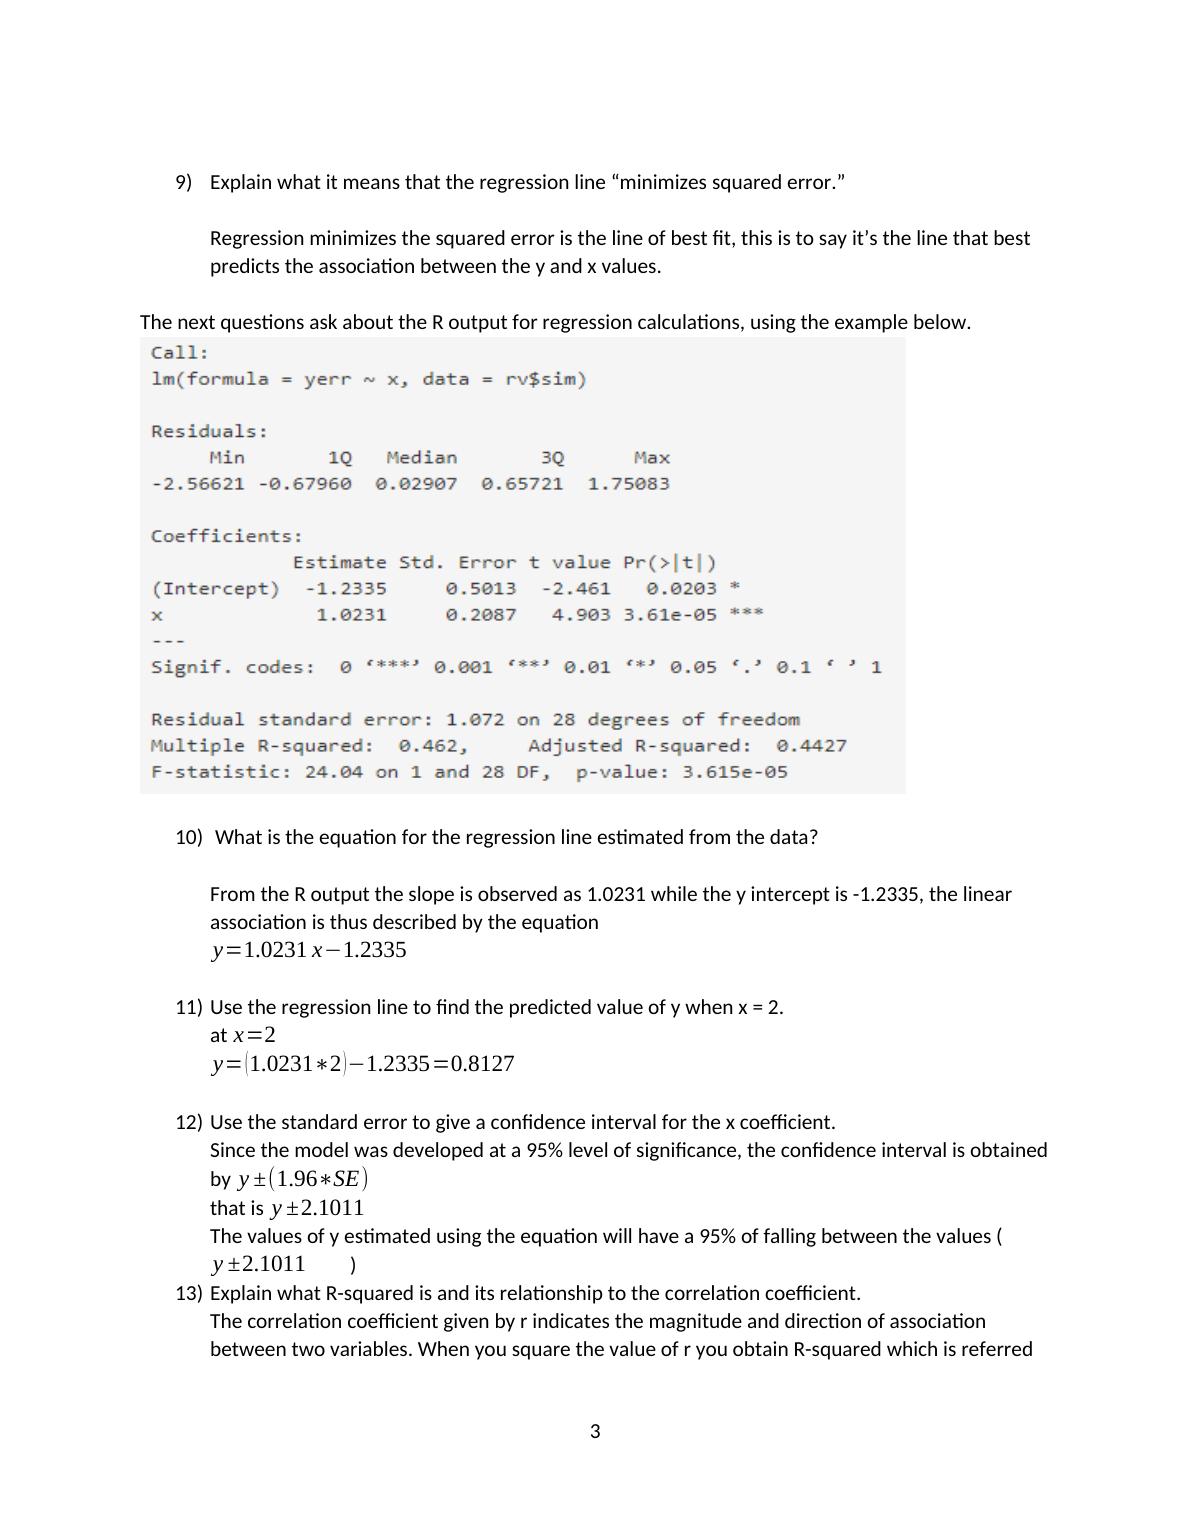
The next questions ask about the R output for regression calculations, using the
example below.
10) What is the equation for the regression line estimated from the data?
From the R output the slope is observed as 1.0231 while the y intercept is -
1.2335, the linear association is thus described by the equation
y=1.0231 x−1.2335
11) Use the regression line to find the predicted value of y when x = 2.
at x=2
y= ( 1.0231∗2 ) −1.2335=0.8127
12) Use the standard error to give a confidence interval for the x
coefficient.
Since the model was developed at a 95% level of significance, the confidence
interval is obtained by y ±(1.96∗SE)
that is y ±2.1011
The values of y estimated using the equation will have a 95% of falling
between the values ( y ±2.1011 )
13) Explain what R-squared is and its relationship to the correlation
coefficient.
The correlation coefficient given by r indicates the magnitude and direction of
association between two variables. When you square the value of r you
3
Regression minimizes the squared error is the line of best fit, this is to say it’s
the line that best predicts the association between the y and x values.
The next questions ask about the R output for regression calculations, using the
example below.
10) What is the equation for the regression line estimated from the data?
From the R output the slope is observed as 1.0231 while the y intercept is -
1.2335, the linear association is thus described by the equation
y=1.0231 x−1.2335
11) Use the regression line to find the predicted value of y when x = 2.
at x=2
y= ( 1.0231∗2 ) −1.2335=0.8127
12) Use the standard error to give a confidence interval for the x
coefficient.
Since the model was developed at a 95% level of significance, the confidence
interval is obtained by y ±(1.96∗SE)
that is y ±2.1011
The values of y estimated using the equation will have a 95% of falling
between the values ( y ±2.1011 )
13) Explain what R-squared is and its relationship to the correlation
coefficient.
The correlation coefficient given by r indicates the magnitude and direction of
association between two variables. When you square the value of r you
3
End of preview
Want to access all the pages? Upload your documents or become a member.
Related Documents
Regression Analysis | Statistics Assignmentlg...
|7
|843
|25
THE SIMPLE LINEAR REGRESSIONlg...
|11
|1622
|8
APPLIED MANAGERIAL STATISTICSlg...
|10
|1265
|18
SIimple & Multiple Regression Modellg...
|10
|600
|67
Linear Regression and Correlation Analysis Assignmentlg...
|13
|1372
|109
Regression Analysis | Assignment-1lg...
|7
|872
|19