TFP and Real GDP of Australia (Source: Developed by the learner) Case of France (Source: Developed by the learner)
VerifiedAdded on 2022/05/31
|17
|3156
|84
AI Summary
Both the real GDP and the TFP have increased simultaneously in most cases over time. Growth patterns vary from country to country (Gilpin, 2018). China's real GDP growth shows exponential growth while the growth of most other countries is a straight line.
Contribute Materials
Your contribution can guide someone’s learning journey. Share your
documents today.
1
MAE203 – THE GLOBAL ECONOMY
WRITTEN ASSIGNMENT
MAE203 – THE GLOBAL ECONOMY
WRITTEN ASSIGNMENT
Secure Best Marks with AI Grader
Need help grading? Try our AI Grader for instant feedback on your assignments.

2
Contents
Part 1..........................................................................................................................................3
Part B........................................................................................................................................11
Part C........................................................................................................................................12
Reference..................................................................................................................................14
3
Part 1
Question 1
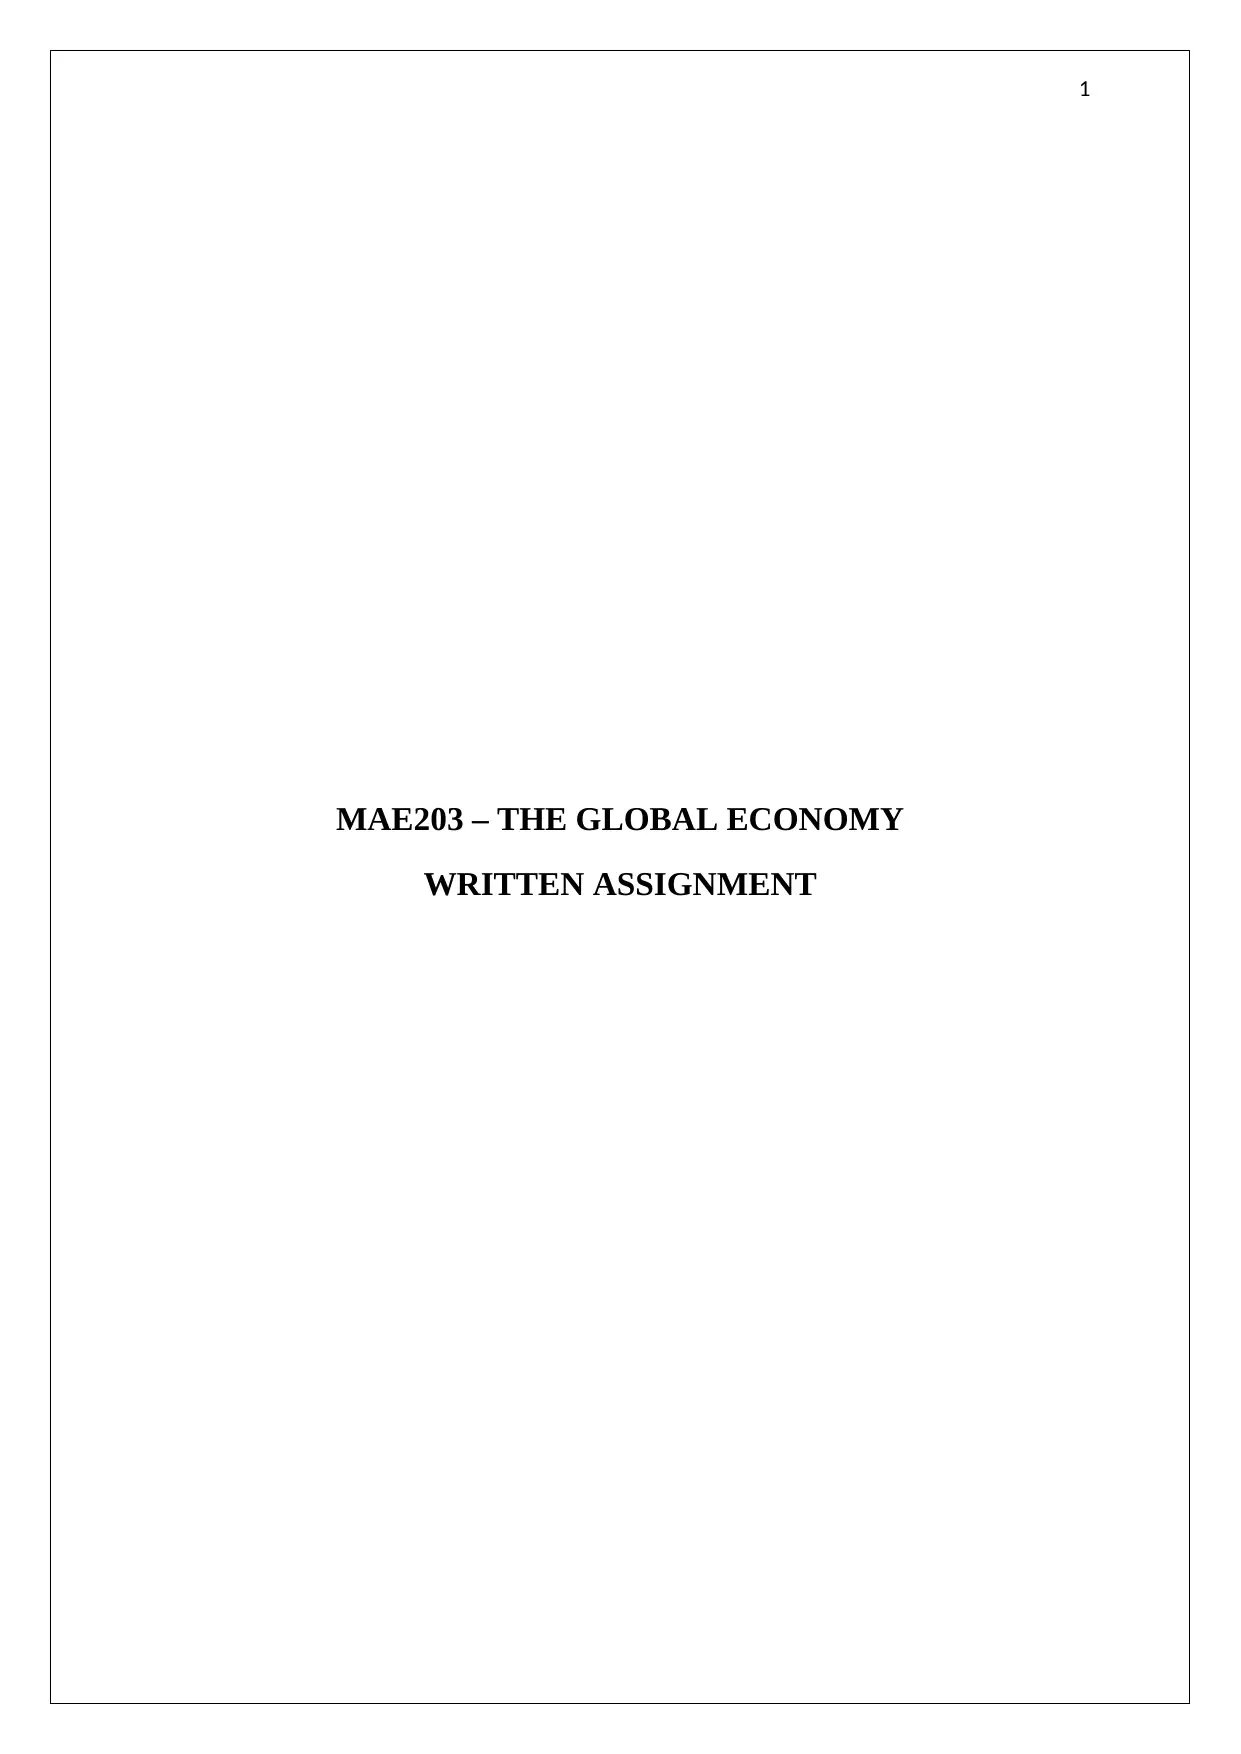
Case of Australia
1960
1963
1966
1969
1972
1975
1978
1981
1984
1987
1990
1993
1996
1999
2002
2005
2008
2011
2014
2017
0.00
200000.00
400000.00
600000.00
800000.00
1000000.00
1200000.00
0.00
0.20
0.40
0.60
0.80
1.00
1.20
TFP and real GDP for australia
Real GDP Total factor productivity
Year
Real GDP
Total Factor Productivity
Figure 1: the TFP and real GDP of Australia
(Source: Developed by the learner)
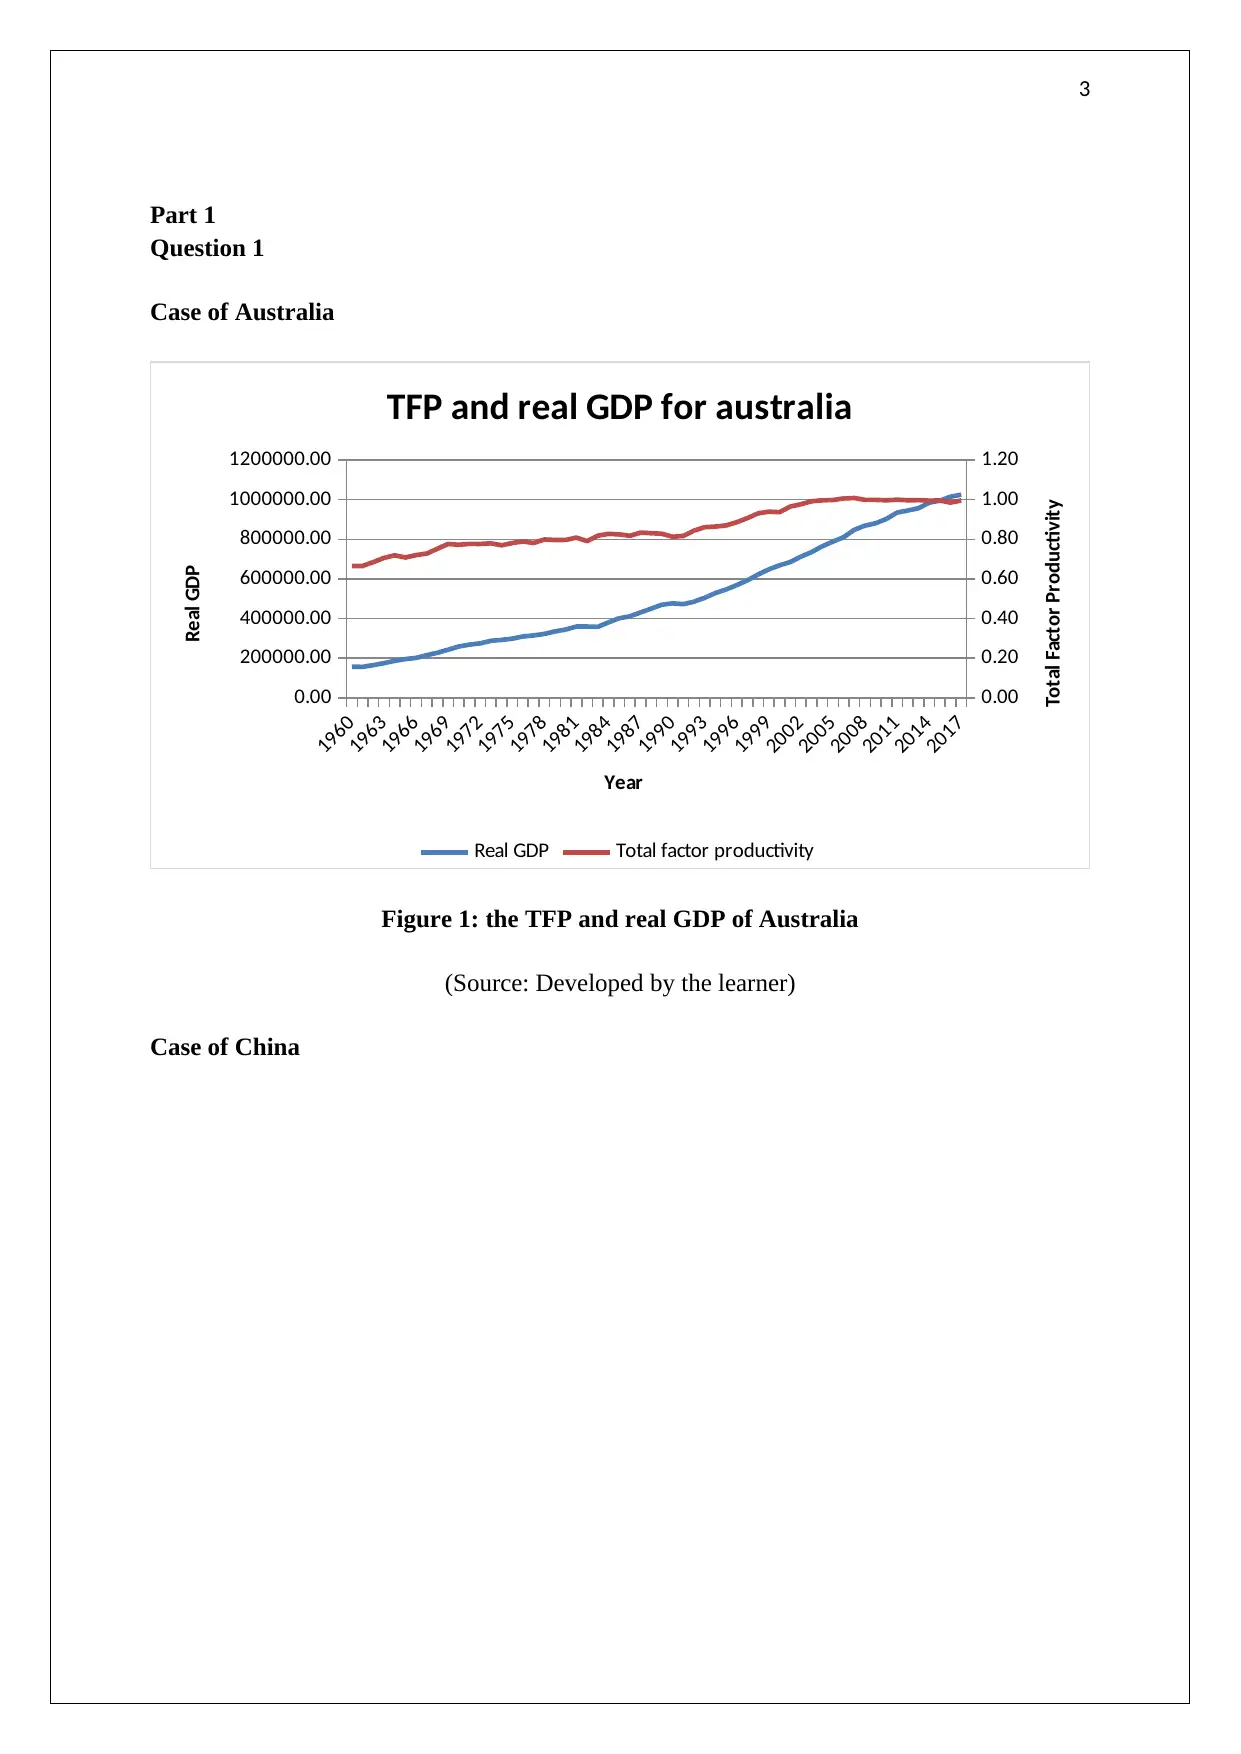
Case of China
Part 1
Question 1
Case of Australia
1960
1963
1966
1969
1972
1975
1978
1981
1984
1987
1990
1993
1996
1999
2002
2005
2008
2011
2014
2017
0.00
200000.00
400000.00
600000.00
800000.00
1000000.00
1200000.00
0.00
0.20
0.40
0.60
0.80
1.00
1.20
TFP and real GDP for australia
Real GDP Total factor productivity
Year
Real GDP
Total Factor Productivity
Figure 1: the TFP and real GDP of Australia
(Source: Developed by the learner)
Case of China
4
1952
1956
1960
1964
1968
1972
1976
1980
1984
1988
1992
1996
2000
2004
2008
2012
2016
0.00
0.20
0.40
0.60
0.80
1.00
1.20
0.00
2000000.00
4000000.00
6000000.00
8000000.00
10000000.00
12000000.00
14000000.00
16000000.00
18000000.00
20000000.00
TFP and real GDP of China
Total factor productivity Real GDP
Year
Real GDP
Total Factor Productivity
Figure 2: TFP and real GDP of China
(Source: Developed by the learner)
Case of France
1950
1954
1958
1962
1966
1970
1974
1978
1982
1986
1990
1994
1998
2002
2006
2010
2014
0.00
500000.00
1000000.00
1500000.00
2000000.00
2500000.00
3000000.00
0.00
0.20
0.40
0.60
0.80
1.00
1.20
TFP and Real GDP of France
Real GDP Total Factor Productivity
Year
Real GDP
Total Factor Productivity
Figure 3: TFP and Real GDP of France
(Source: Developed by the learner)
Secure Best Marks with AI Grader
Need help grading? Try our AI Grader for instant feedback on your assignments.
5
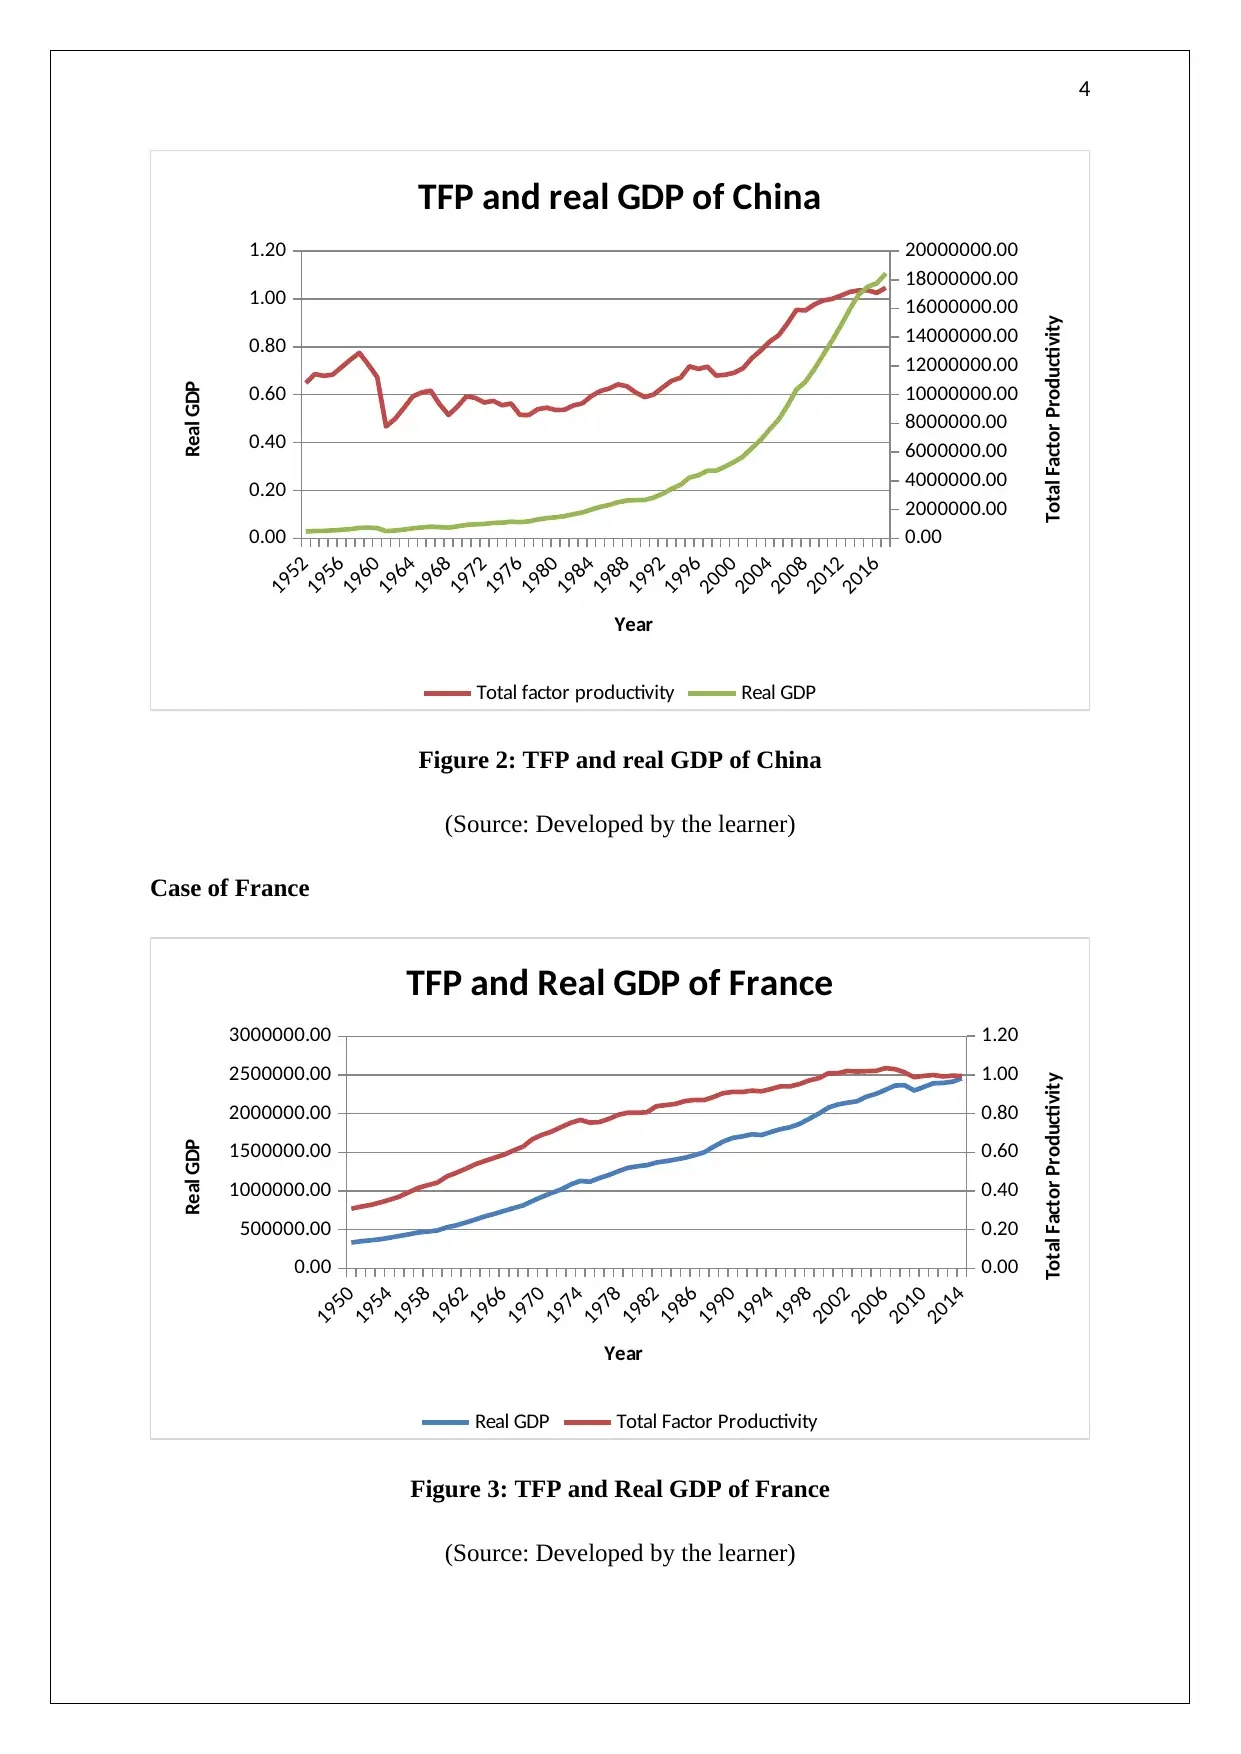
Case of Germany
1950
1954
1958
1962
1966
1970
1974
1978
1982
1986
1990
1994
1998
2002
2006
2010
2014
0.00
500000.00
1000000.00
1500000.00
2000000.00
2500000.00
3000000.00
3500000.00
4000000.00
0.00
0.20
0.40
0.60
0.80
1.00
1.20
TFP and Real GDP of Germany
Real GDP Total Factor Productivity
Year
Real GDP
Total Factor Productivity
Figure 4: The TFP and the real GDP of Germany
(Source: Developed by the learner)
Case of Japan
1950
1954
1958
1962
1966
1970
1974
1978
1982
1986
1990
1994
1998
2002
2006
2010
2014
0.00
500000.00
1000000.00
1500000.00
2000000.00
2500000.00
3000000.00
3500000.00
4000000.00
4500000.00
5000000.00
0.00
0.20
0.40
0.60
0.80
1.00
1.20
1.40
TFP and Real GDP of Japan
Real GDP Total Factor Productivity
Year
Real GDP
Total Factor Productivity
Figure 5: The TFP and real GDP of Japan
(Source: Developed by the learner)
6
Case of Spain
1950
1954
1958
1962
1966
1970
1974
1978
1982
1986
1990
1994
1998
2002
2006
2010
2014
0.00
200,000.00
400,000.00
600,000.00
800,000.00
1,000,000.00
1,200,000.00
1,400,000.00
1,600,000.00
1,800,000.00
0.00
0.20
0.40
0.60
0.80
1.00
1.20
TFP and real GDP of Spain
Real GDP Total Factor Productivity
Year
Real GDP
Total Factor Productivity
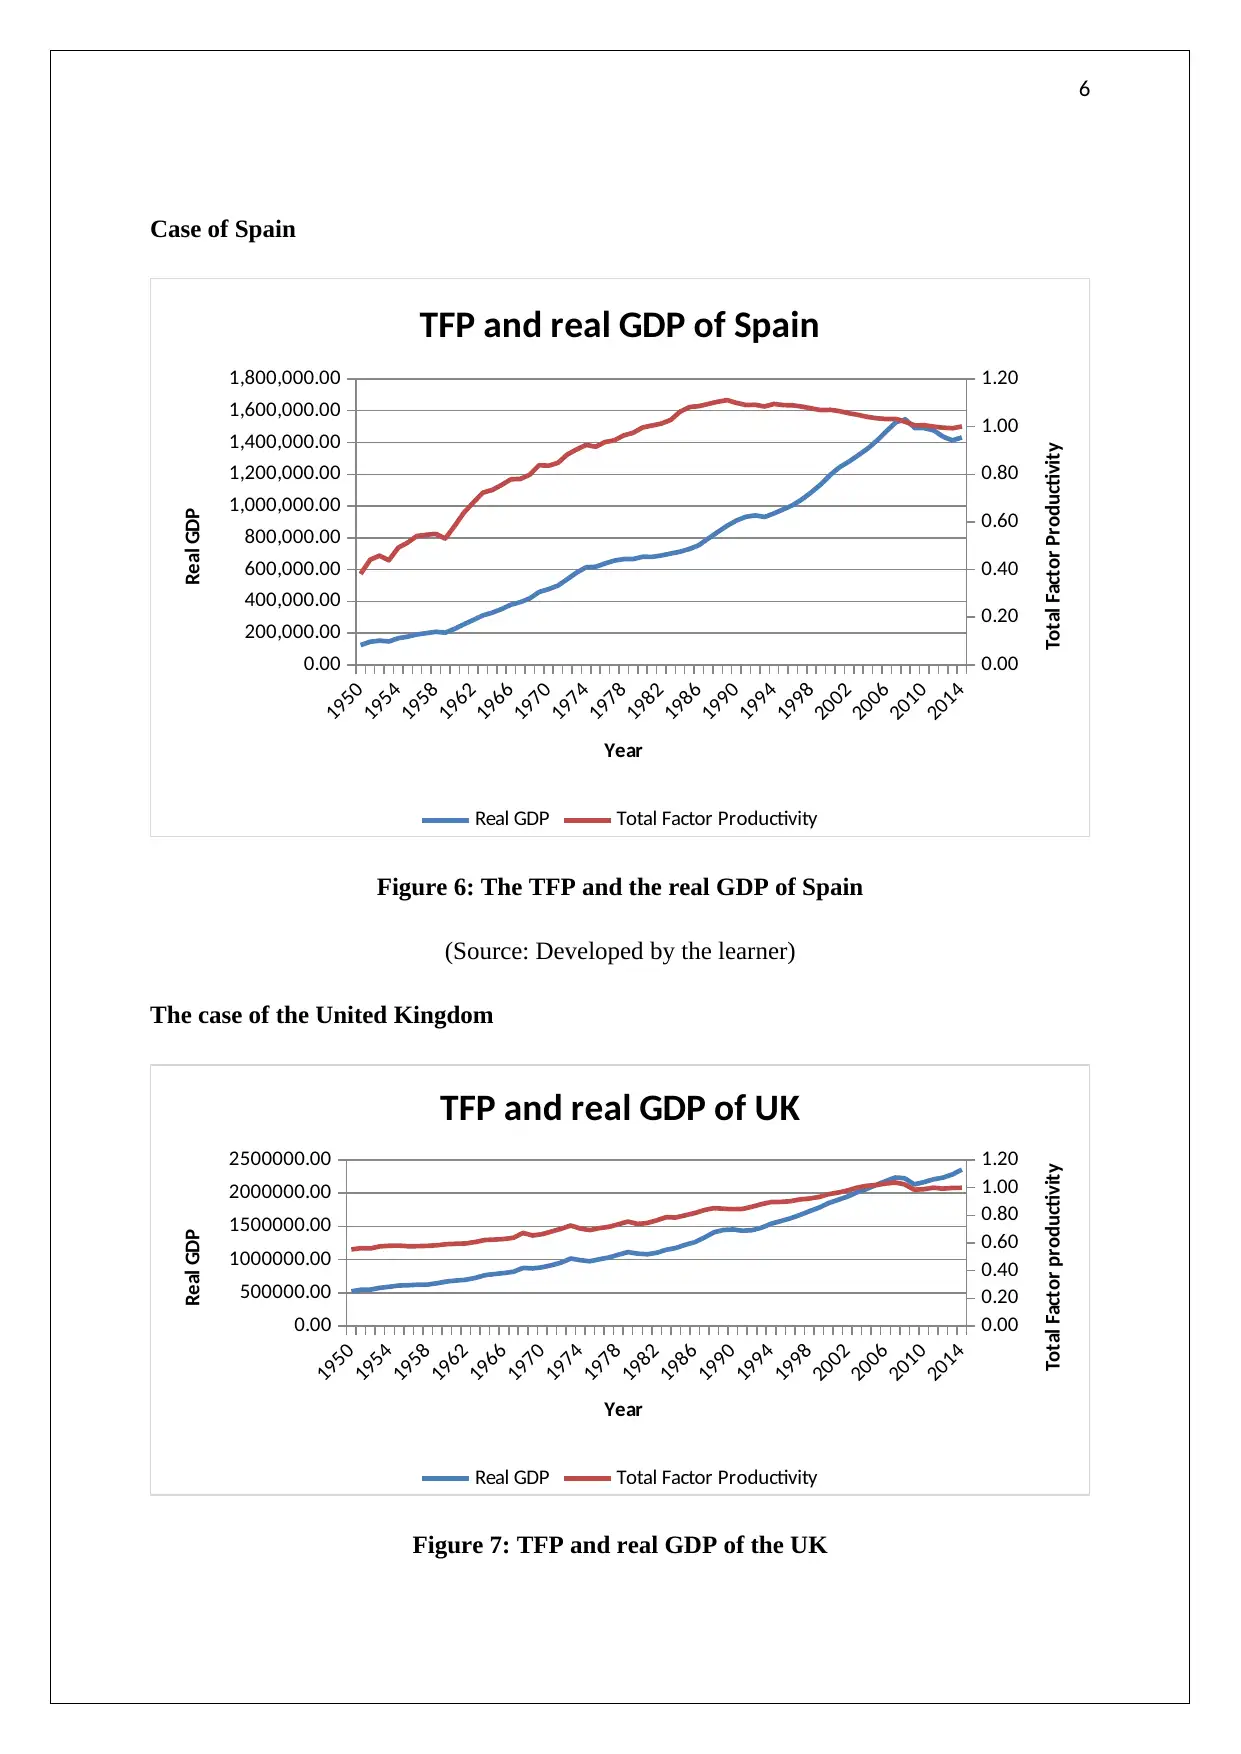
Figure 6: The TFP and the real GDP of Spain
(Source: Developed by the learner)
The case of the United Kingdom
1950
1954
1958
1962
1966
1970
1974
1978
1982
1986
1990
1994
1998
2002
2006
2010
2014
0.00
500000.00
1000000.00
1500000.00
2000000.00
2500000.00
0.00
0.20
0.40
0.60
0.80
1.00
1.20
TFP and real GDP of UK
Real GDP Total Factor Productivity
Year
Real GDP
Total Factor productivity
Figure 7: TFP and real GDP of the UK
Case of Spain
1950
1954
1958
1962
1966
1970
1974
1978
1982
1986
1990
1994
1998
2002
2006
2010
2014
0.00
200,000.00
400,000.00
600,000.00
800,000.00
1,000,000.00
1,200,000.00
1,400,000.00
1,600,000.00
1,800,000.00
0.00
0.20
0.40
0.60
0.80
1.00
1.20
TFP and real GDP of Spain
Real GDP Total Factor Productivity
Year
Real GDP
Total Factor Productivity
Figure 6: The TFP and the real GDP of Spain
(Source: Developed by the learner)
The case of the United Kingdom
1950
1954
1958
1962
1966
1970
1974
1978
1982
1986
1990
1994
1998
2002
2006
2010
2014
0.00
500000.00
1000000.00
1500000.00
2000000.00
2500000.00
0.00
0.20
0.40
0.60
0.80
1.00
1.20
TFP and real GDP of UK
Real GDP Total Factor Productivity
Year
Real GDP
Total Factor productivity
Figure 7: TFP and real GDP of the UK
7
(Source: Developed by the learner)
The case of the USA
1950
1954
1958
1962
1966
1970
1974
1978
1982
1986
1990
1994
1998
2002
2006
2010
2014
0.00
2000000.00
4000000.00
6000000.00
8000000.00
10000000.00
12000000.00
14000000.00
16000000.00
18000000.00
0.00
0.20
0.40
0.60
0.80
1.00
1.20
TFP and real GDP of the USA
Real GDP Total Factor Productivity
year
Real GDP
Total Factor Productivity
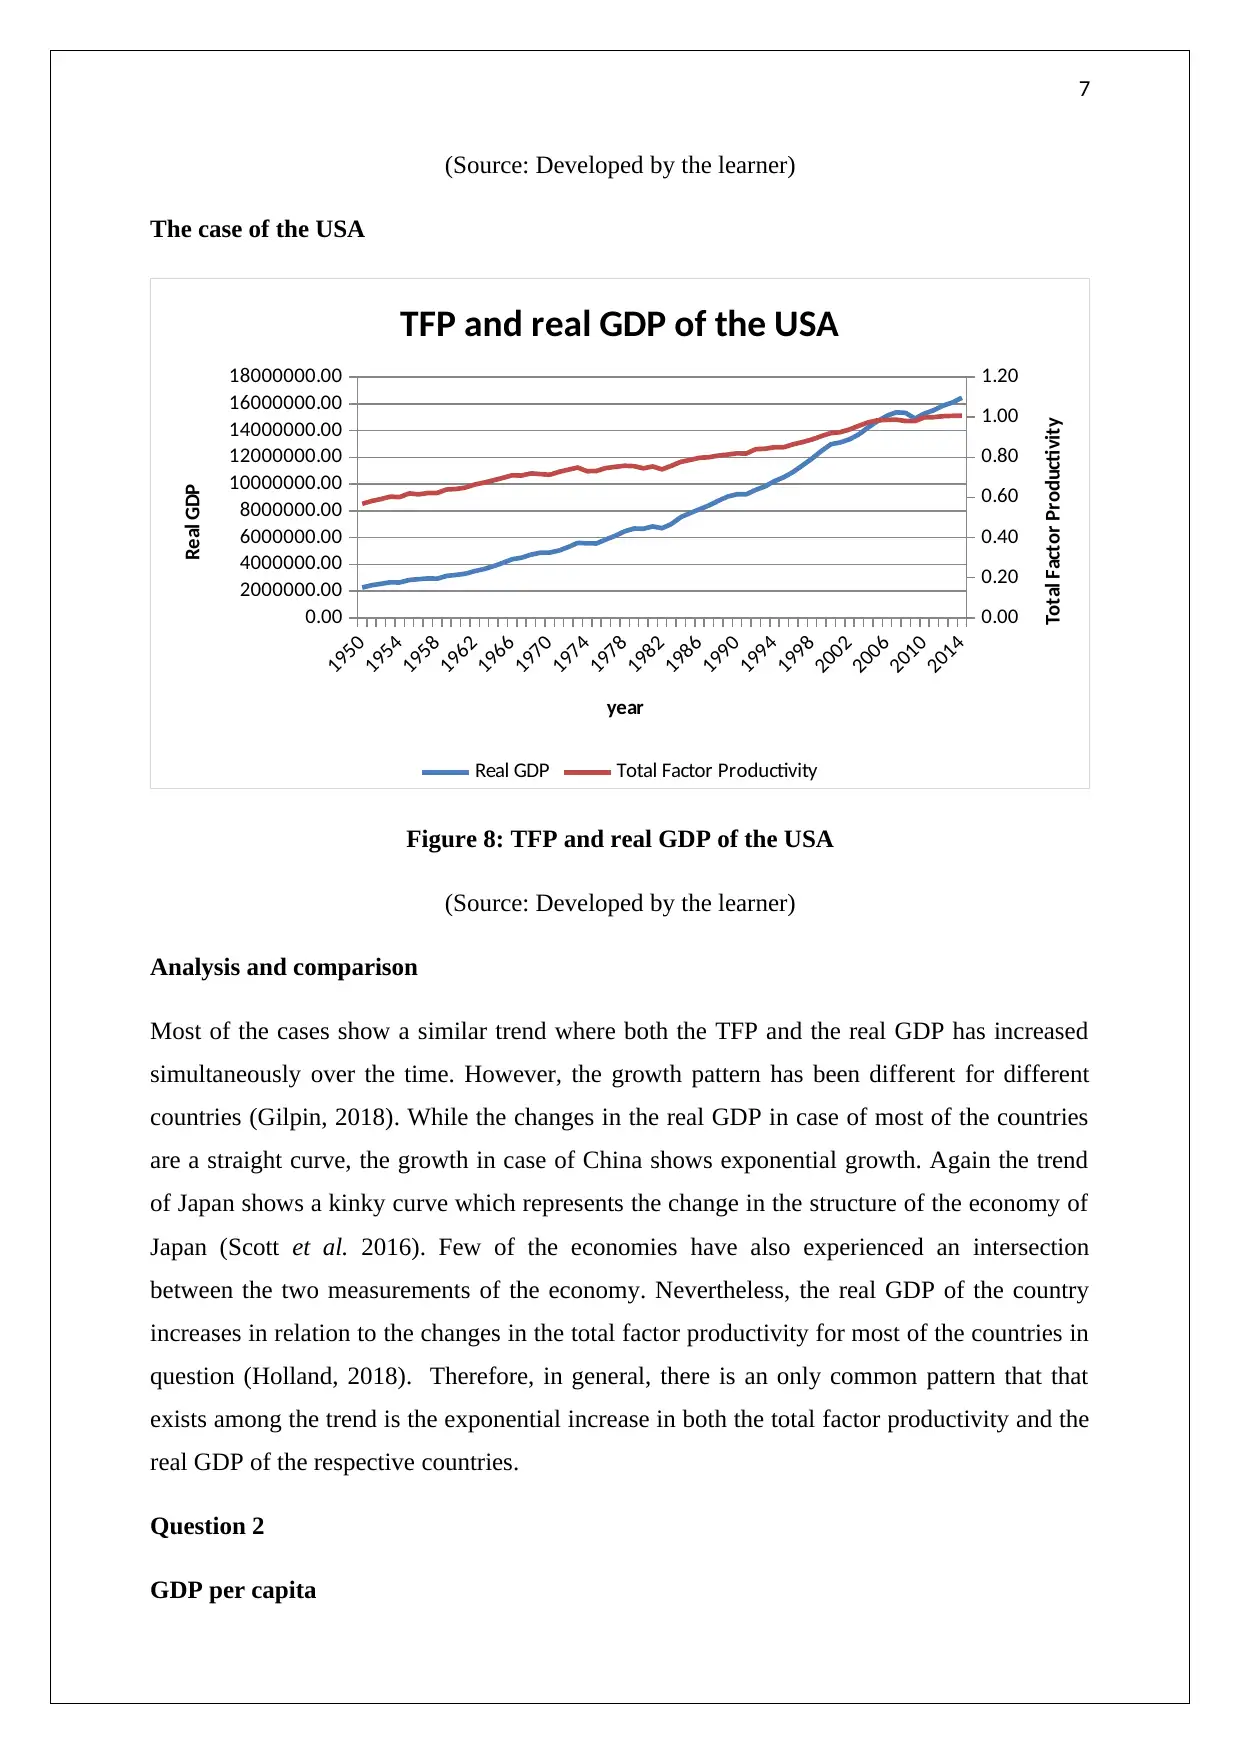
Figure 8: TFP and real GDP of the USA
(Source: Developed by the learner)
Analysis and comparison
Most of the cases show a similar trend where both the TFP and the real GDP has increased
simultaneously over the time. However, the growth pattern has been different for different
countries (Gilpin, 2018). While the changes in the real GDP in case of most of the countries
are a straight curve, the growth in case of China shows exponential growth. Again the trend
of Japan shows a kinky curve which represents the change in the structure of the economy of
Japan (Scott et al. 2016). Few of the economies have also experienced an intersection
between the two measurements of the economy. Nevertheless, the real GDP of the country
increases in relation to the changes in the total factor productivity for most of the countries in
question (Holland, 2018). Therefore, in general, there is an only common pattern that that
exists among the trend is the exponential increase in both the total factor productivity and the
real GDP of the respective countries.
Question 2
GDP per capita
(Source: Developed by the learner)
The case of the USA
1950
1954
1958
1962
1966
1970
1974
1978
1982
1986
1990
1994
1998
2002
2006
2010
2014
0.00
2000000.00
4000000.00
6000000.00
8000000.00
10000000.00
12000000.00
14000000.00
16000000.00
18000000.00
0.00
0.20
0.40
0.60
0.80
1.00
1.20
TFP and real GDP of the USA
Real GDP Total Factor Productivity
year
Real GDP
Total Factor Productivity
Figure 8: TFP and real GDP of the USA
(Source: Developed by the learner)
Analysis and comparison
Most of the cases show a similar trend where both the TFP and the real GDP has increased
simultaneously over the time. However, the growth pattern has been different for different
countries (Gilpin, 2018). While the changes in the real GDP in case of most of the countries
are a straight curve, the growth in case of China shows exponential growth. Again the trend
of Japan shows a kinky curve which represents the change in the structure of the economy of
Japan (Scott et al. 2016). Few of the economies have also experienced an intersection
between the two measurements of the economy. Nevertheless, the real GDP of the country
increases in relation to the changes in the total factor productivity for most of the countries in
question (Holland, 2018). Therefore, in general, there is an only common pattern that that
exists among the trend is the exponential increase in both the total factor productivity and the
real GDP of the respective countries.
Question 2
GDP per capita
Paraphrase This Document
Need a fresh take? Get an instant paraphrase of this document with our AI Paraphraser
8
Year Australia France Japan Germany
2000.0
0 44313.32 38460.68 42169.73 42169.73
2001.0
0 44564.98 38928.03 42239.18 42239.18
2002.0
0 45786.64 39078.20 42190.80 42190.80
2003.0
0 46575.42 39120.20 42744.01 42744.01
2004.0
0 47880.61 39915.26 43671.68 43671.68
2005.0
0 48760.36 40252.42 44393.63 44393.63
2006.0
0 49408.05 40922.08 44995.49 44995.49
2007.0
0 50955.06 41630.09 45687.27 45687.27
2008.0
0 51770.91 41478.94 45165.79 45165.79
2009.0
0 51689.91 40052.31 42724.76 42724.76
2010.0
0 51936.89 40638.33 44507.68 44507.68
2011.0
0 52475.66 41283.15 44538.73 44538.73
2012.0
0 53553.23 41158.88 45276.87 45276.87
2013.0
0 54008.71 41183.51 46249.21 46249.21
2014.0
0 54546.20 41374.76 46484.16 46484.16
2015.0
0 55017.25 41642.31 47163.49 47163.49
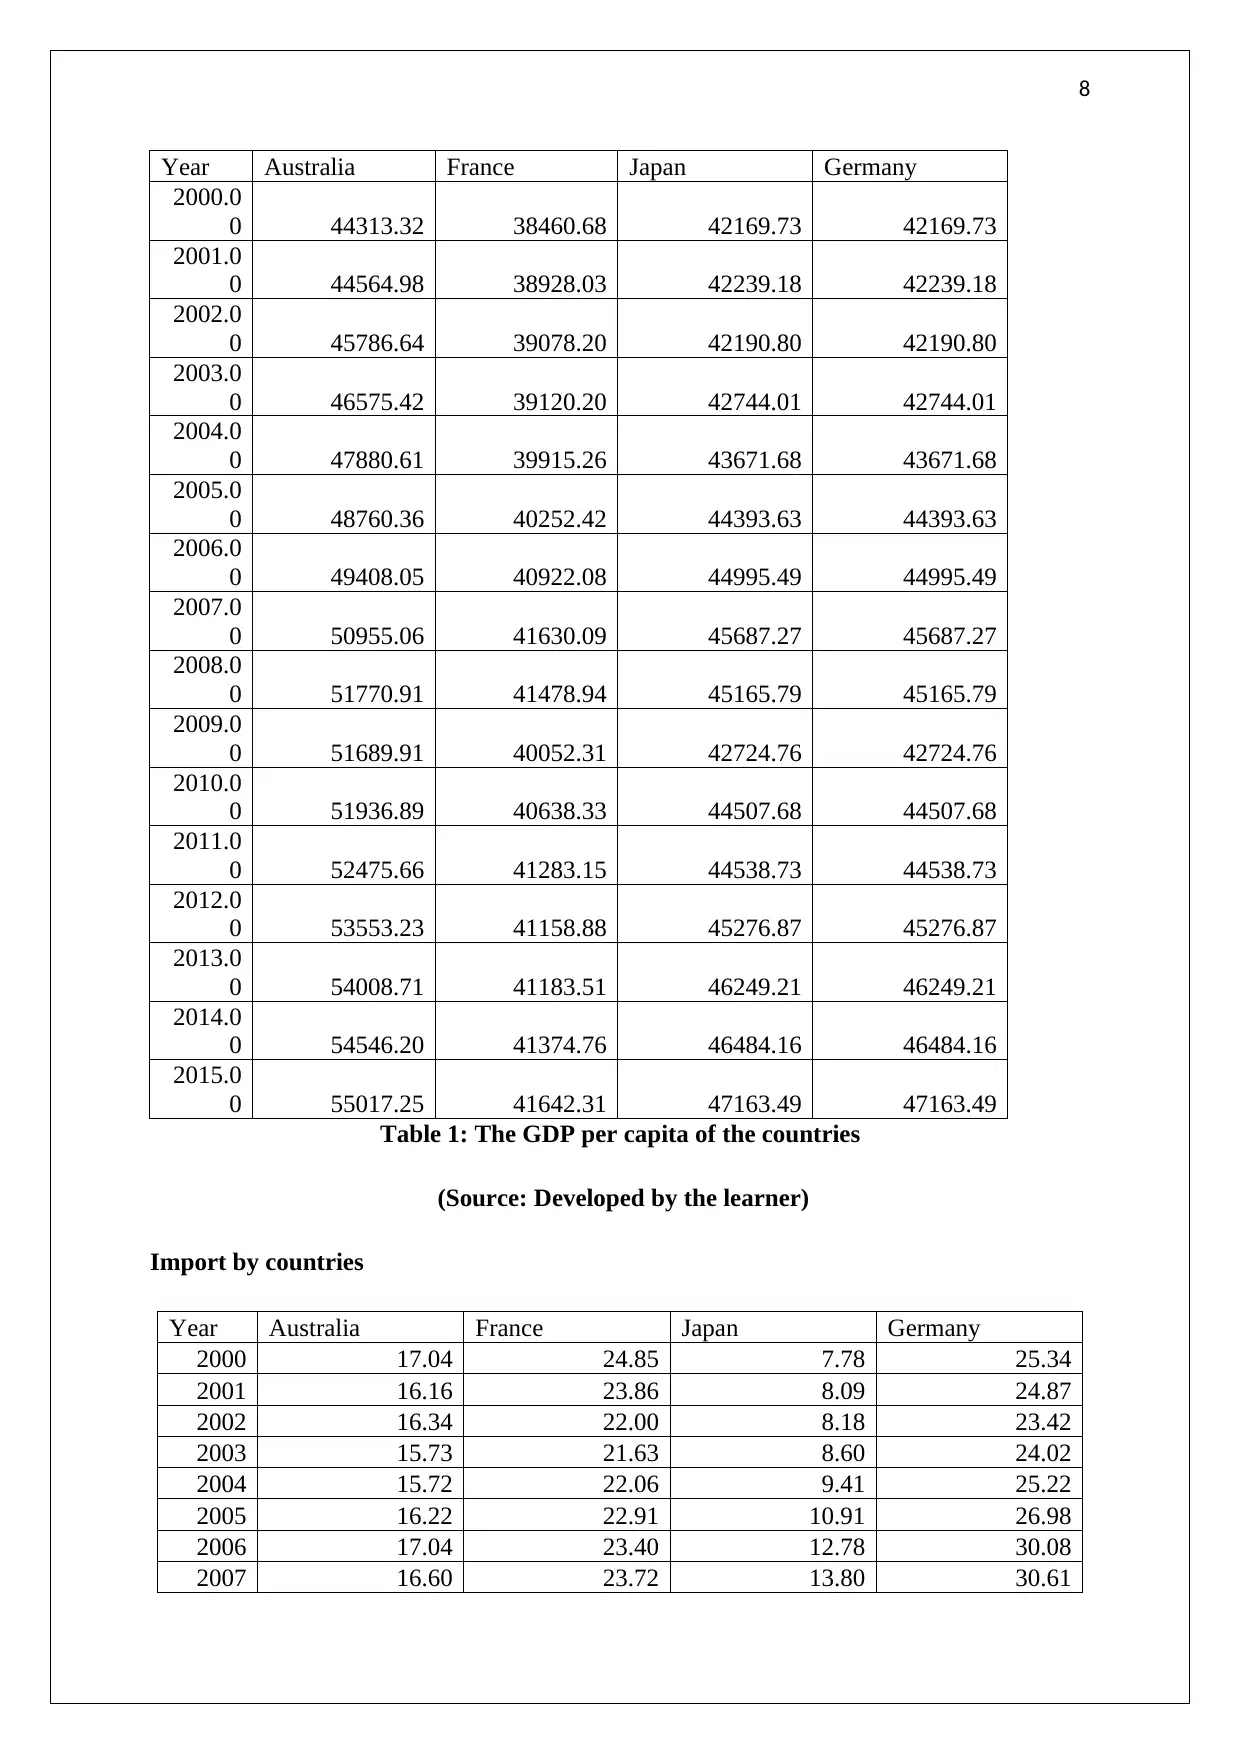
Table 1: The GDP per capita of the countries
(Source: Developed by the learner)
Import by countries
Year Australia France Japan Germany
2000 17.04 24.85 7.78 25.34
2001 16.16 23.86 8.09 24.87
2002 16.34 22.00 8.18 23.42
2003 15.73 21.63 8.60 24.02
2004 15.72 22.06 9.41 25.22
2005 16.22 22.91 10.91 26.98
2006 17.04 23.40 12.78 30.08
2007 16.60 23.72 13.80 30.61
Year Australia France Japan Germany
2000.0
0 44313.32 38460.68 42169.73 42169.73
2001.0
0 44564.98 38928.03 42239.18 42239.18
2002.0
0 45786.64 39078.20 42190.80 42190.80
2003.0
0 46575.42 39120.20 42744.01 42744.01
2004.0
0 47880.61 39915.26 43671.68 43671.68
2005.0
0 48760.36 40252.42 44393.63 44393.63
2006.0
0 49408.05 40922.08 44995.49 44995.49
2007.0
0 50955.06 41630.09 45687.27 45687.27
2008.0
0 51770.91 41478.94 45165.79 45165.79
2009.0
0 51689.91 40052.31 42724.76 42724.76
2010.0
0 51936.89 40638.33 44507.68 44507.68
2011.0
0 52475.66 41283.15 44538.73 44538.73
2012.0
0 53553.23 41158.88 45276.87 45276.87
2013.0
0 54008.71 41183.51 46249.21 46249.21
2014.0
0 54546.20 41374.76 46484.16 46484.16
2015.0
0 55017.25 41642.31 47163.49 47163.49
Table 1: The GDP per capita of the countries
(Source: Developed by the learner)
Import by countries
Year Australia France Japan Germany
2000 17.04 24.85 7.78 25.34
2001 16.16 23.86 8.09 24.87
2002 16.34 22.00 8.18 23.42
2003 15.73 21.63 8.60 24.02
2004 15.72 22.06 9.41 25.22
2005 16.22 22.91 10.91 26.98
2006 17.04 23.40 12.78 30.08
2007 16.60 23.72 13.80 30.61
9
2008 18.18 24.39 15.18 31.41
2009 15.90 20.87 10.51 26.92
2010 15.44 22.97 12.14 30.67
2011 15.47 25.09 13.89 33.18
2012 15.97 25.11 14.24 32.56
2013 15.34 24.34 16.12 31.42
2014 15.65 23.82 16.69 30.86
2015 16.25 23.56 14.74 30.97
2016 14.96 23.21 12.26 30.08
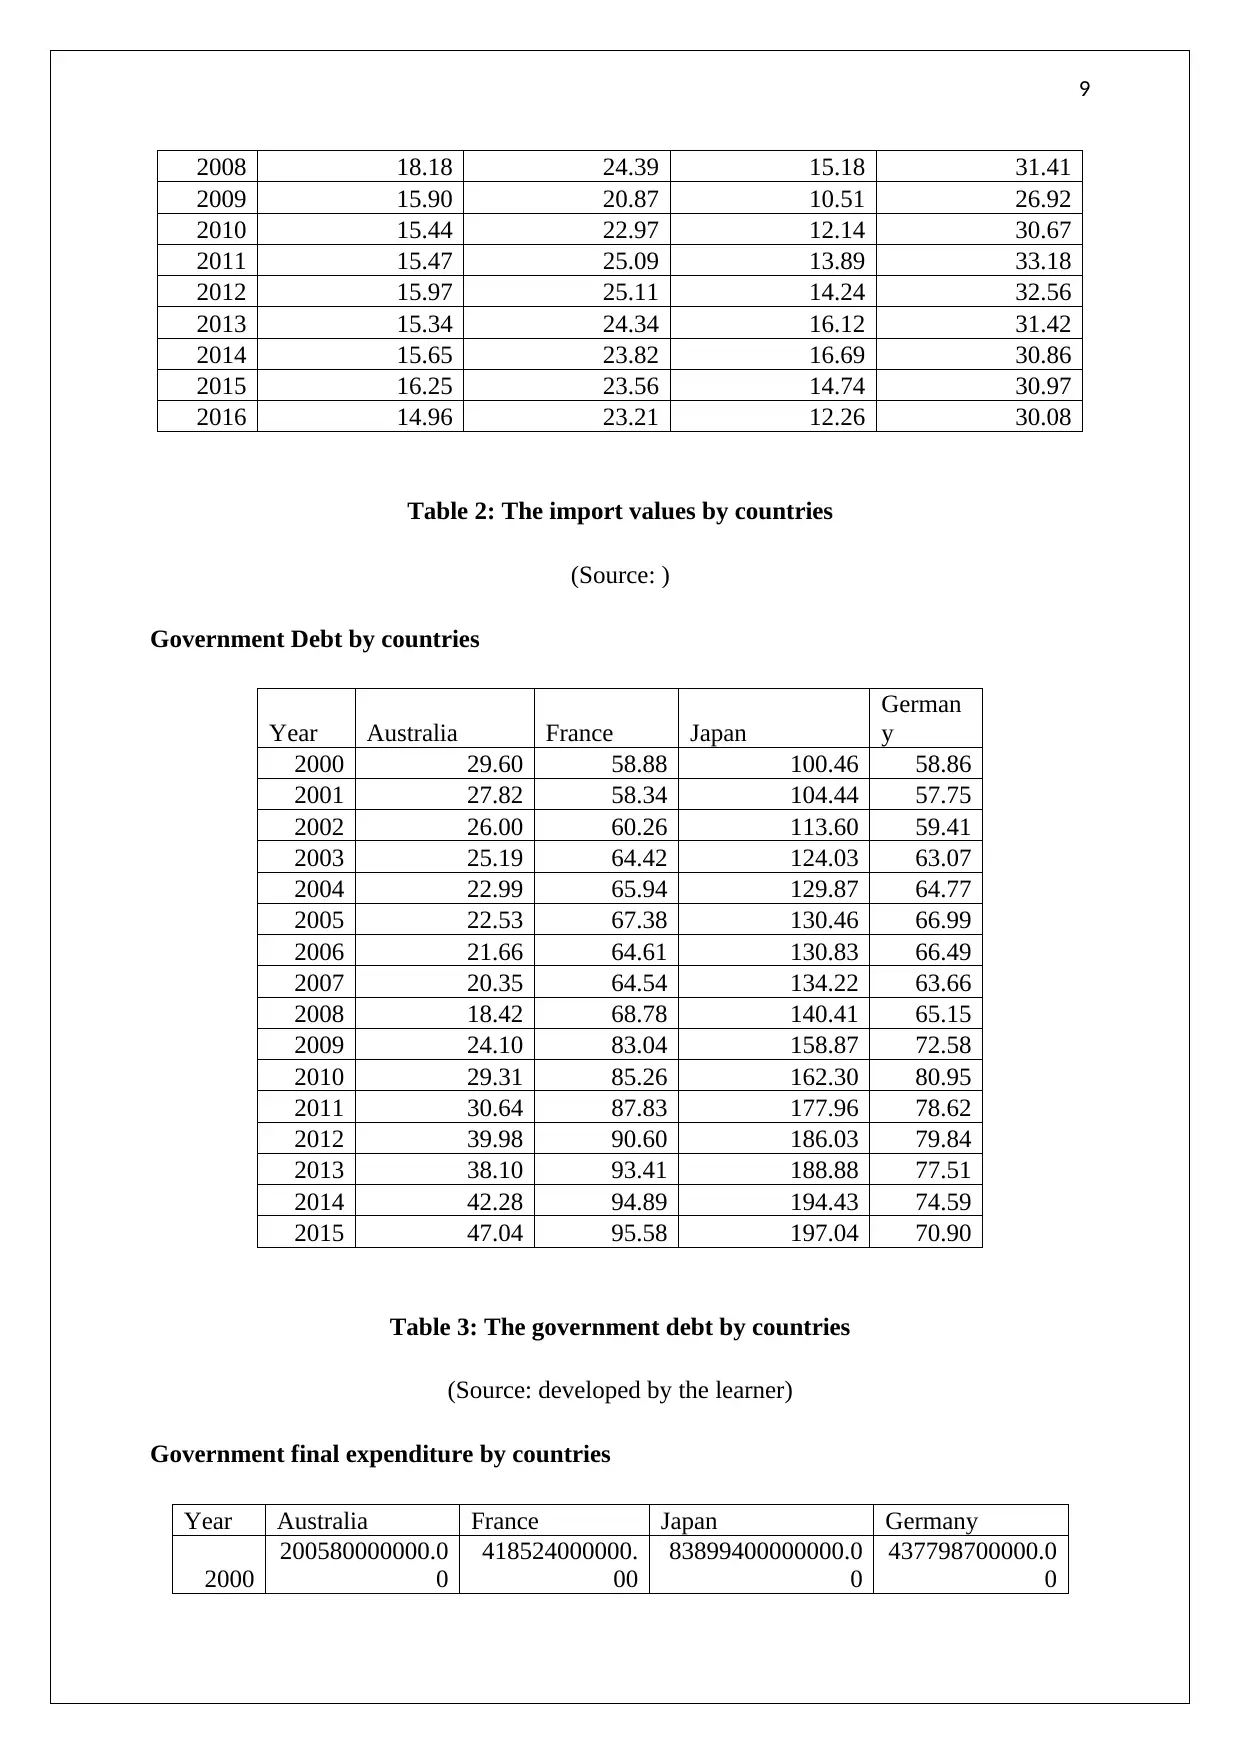
Table 2: The import values by countries
(Source: )
Government Debt by countries
Year Australia France Japan
German
y
2000 29.60 58.88 100.46 58.86
2001 27.82 58.34 104.44 57.75
2002 26.00 60.26 113.60 59.41
2003 25.19 64.42 124.03 63.07
2004 22.99 65.94 129.87 64.77
2005 22.53 67.38 130.46 66.99
2006 21.66 64.61 130.83 66.49
2007 20.35 64.54 134.22 63.66
2008 18.42 68.78 140.41 65.15
2009 24.10 83.04 158.87 72.58
2010 29.31 85.26 162.30 80.95
2011 30.64 87.83 177.96 78.62
2012 39.98 90.60 186.03 79.84
2013 38.10 93.41 188.88 77.51
2014 42.28 94.89 194.43 74.59
2015 47.04 95.58 197.04 70.90
Table 3: The government debt by countries
(Source: developed by the learner)
Government final expenditure by countries
Year Australia France Japan Germany
2000
200580000000.0
0
418524000000.
00
83899400000000.0
0
437798700000.0
0
2008 18.18 24.39 15.18 31.41
2009 15.90 20.87 10.51 26.92
2010 15.44 22.97 12.14 30.67
2011 15.47 25.09 13.89 33.18
2012 15.97 25.11 14.24 32.56
2013 15.34 24.34 16.12 31.42
2014 15.65 23.82 16.69 30.86
2015 16.25 23.56 14.74 30.97
2016 14.96 23.21 12.26 30.08
Table 2: The import values by countries
(Source: )
Government Debt by countries
Year Australia France Japan
German
y
2000 29.60 58.88 100.46 58.86
2001 27.82 58.34 104.44 57.75
2002 26.00 60.26 113.60 59.41
2003 25.19 64.42 124.03 63.07
2004 22.99 65.94 129.87 64.77
2005 22.53 67.38 130.46 66.99
2006 21.66 64.61 130.83 66.49
2007 20.35 64.54 134.22 63.66
2008 18.42 68.78 140.41 65.15
2009 24.10 83.04 158.87 72.58
2010 29.31 85.26 162.30 80.95
2011 30.64 87.83 177.96 78.62
2012 39.98 90.60 186.03 79.84
2013 38.10 93.41 188.88 77.51
2014 42.28 94.89 194.43 74.59
2015 47.04 95.58 197.04 70.90
Table 3: The government debt by countries
(Source: developed by the learner)
Government final expenditure by countries
Year Australia France Japan Germany
2000
200580000000.0
0
418524000000.
00
83899400000000.0
0
437798700000.0
0
10
2001
204860000000.0
0
422854000000.
00
86760000000000.0
0
440043370000.0
0
2002 208934000000.0
0
430462000000.
00
89061900000000.0
0
445334410000.0
0
2003 219511000000.0
0
438778000000.
00
90709000000000.0
0
447776420000.0
0
2004 227255000000.0
0
448349000000.
00
91776100000000.0
0
444224410000.0
0
2005 234178000000.0
0
454011000000.
00
92505000000000.0
0
446370420000.0
0
2006 242452000000.0
0
460108000000.
00
92567200000000.0
0
450674760000.0
0
2007 248355000000.0
0
468472000000.
00
93635500000000.0
0
457273140000.0
0
2008 258692000000.0
0
473796000000.
00
93561600000000.0
0
472788560000.0
0
2009 264920000000.0
0
485207000000.
00
95472300000000.0
0
487021300000.0
0
2010 271855000000.0
0
491420000000.
00
97323800000000.0
0
493336000000.0
0
2011 283507000000.0
0
496592000000.
00
99204600000000.0
0
497961020000.0
0
2012 287703000000.0
0
504532000000.
00
100869000000000.
00
503202730000.0
0
2013 291900000000.0
0
511967000000.
00
102382200000000.
00
510010760000.0
0
2014 293823000000.0
0
518650000000.
00
102937600000000.
00
517965810000.0
0
2015 305274000000.0
0
523869000000.
00
104524000000000.
00
533160550000.0
0
2016 321026000000.0
0
531063000000.
00
105914000000000.
00
554225990000.0
0
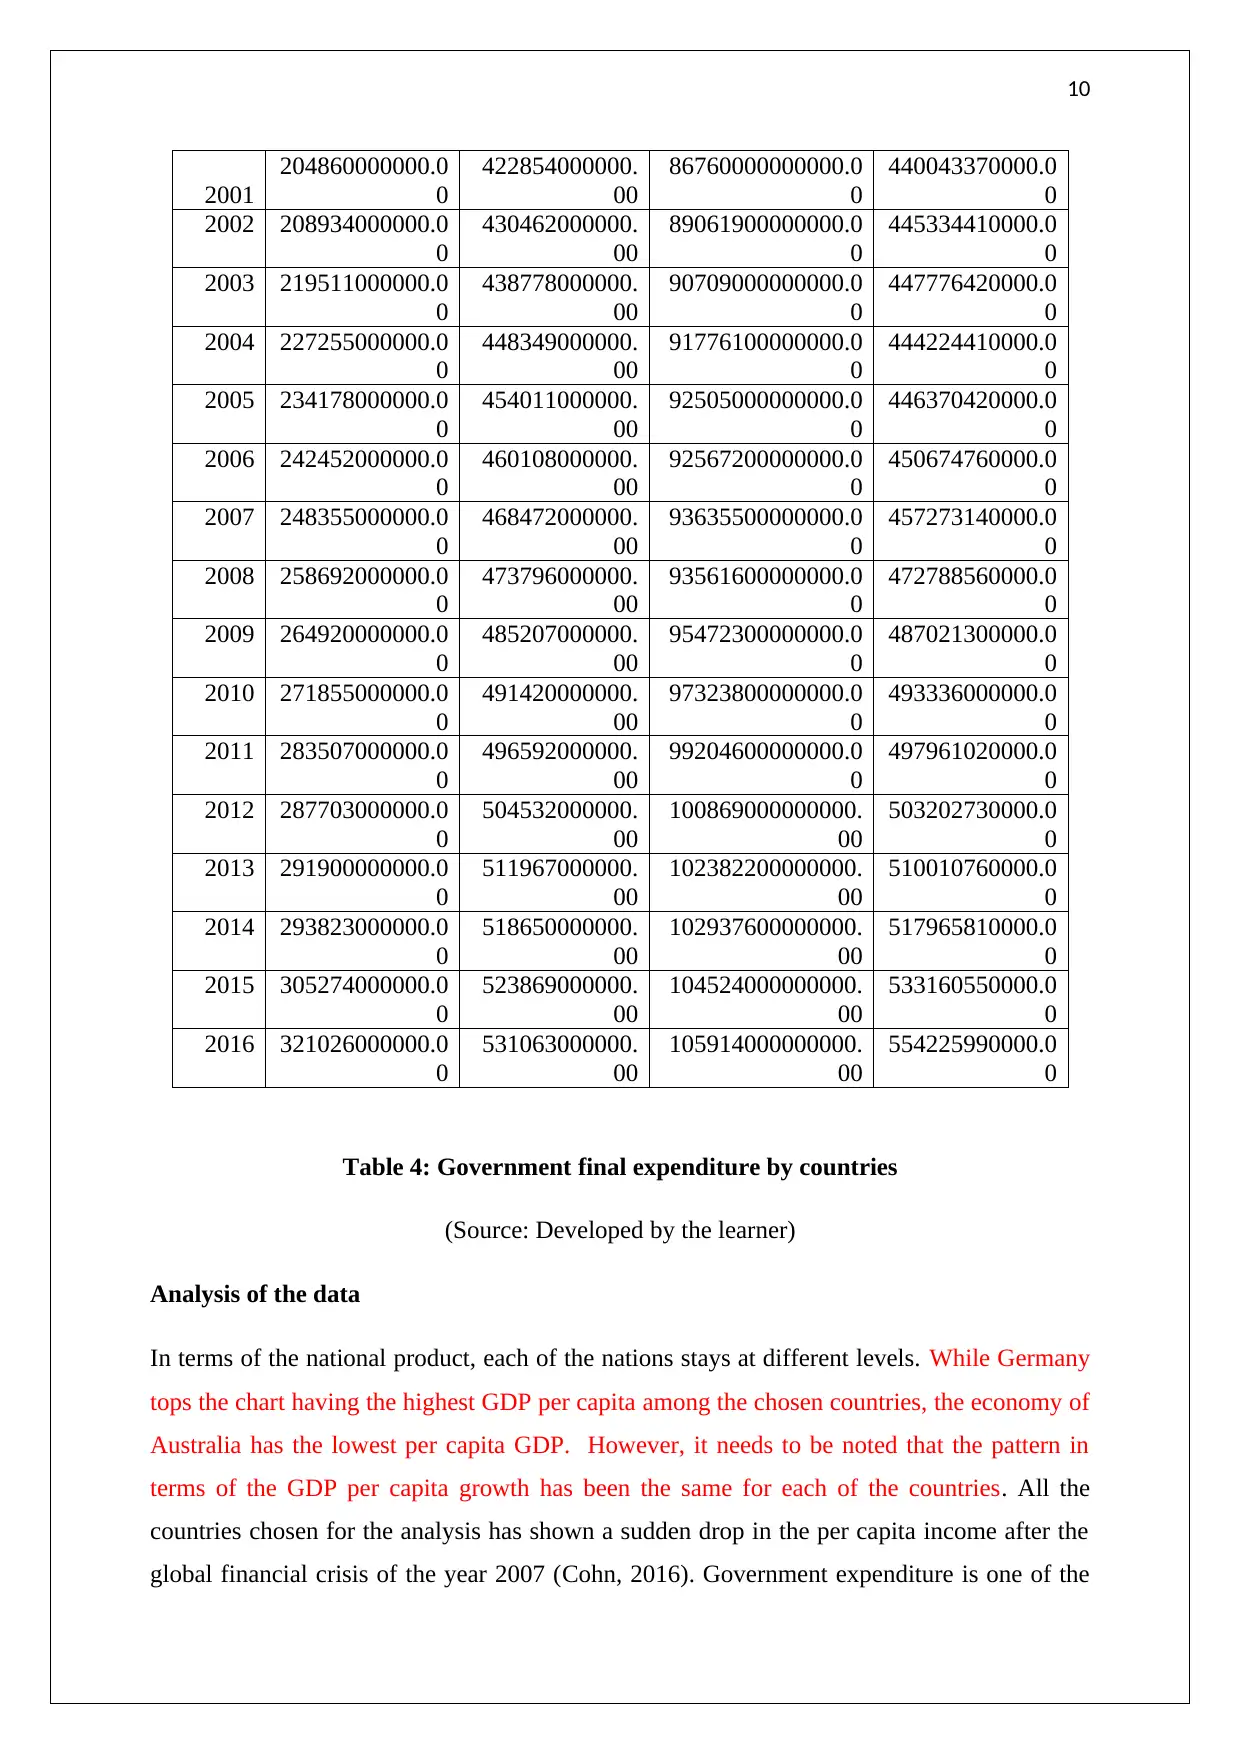
Table 4: Government final expenditure by countries
(Source: Developed by the learner)
Analysis of the data
In terms of the national product, each of the nations stays at different levels. While Germany
tops the chart having the highest GDP per capita among the chosen countries, the economy of
Australia has the lowest per capita GDP. However, it needs to be noted that the pattern in
terms of the GDP per capita growth has been the same for each of the countries. All the
countries chosen for the analysis has shown a sudden drop in the per capita income after the
global financial crisis of the year 2007 (Cohn, 2016). Government expenditure is one of the
2001
204860000000.0
0
422854000000.
00
86760000000000.0
0
440043370000.0
0
2002 208934000000.0
0
430462000000.
00
89061900000000.0
0
445334410000.0
0
2003 219511000000.0
0
438778000000.
00
90709000000000.0
0
447776420000.0
0
2004 227255000000.0
0
448349000000.
00
91776100000000.0
0
444224410000.0
0
2005 234178000000.0
0
454011000000.
00
92505000000000.0
0
446370420000.0
0
2006 242452000000.0
0
460108000000.
00
92567200000000.0
0
450674760000.0
0
2007 248355000000.0
0
468472000000.
00
93635500000000.0
0
457273140000.0
0
2008 258692000000.0
0
473796000000.
00
93561600000000.0
0
472788560000.0
0
2009 264920000000.0
0
485207000000.
00
95472300000000.0
0
487021300000.0
0
2010 271855000000.0
0
491420000000.
00
97323800000000.0
0
493336000000.0
0
2011 283507000000.0
0
496592000000.
00
99204600000000.0
0
497961020000.0
0
2012 287703000000.0
0
504532000000.
00
100869000000000.
00
503202730000.0
0
2013 291900000000.0
0
511967000000.
00
102382200000000.
00
510010760000.0
0
2014 293823000000.0
0
518650000000.
00
102937600000000.
00
517965810000.0
0
2015 305274000000.0
0
523869000000.
00
104524000000000.
00
533160550000.0
0
2016 321026000000.0
0
531063000000.
00
105914000000000.
00
554225990000.0
0
Table 4: Government final expenditure by countries
(Source: Developed by the learner)
Analysis of the data
In terms of the national product, each of the nations stays at different levels. While Germany
tops the chart having the highest GDP per capita among the chosen countries, the economy of
Australia has the lowest per capita GDP. However, it needs to be noted that the pattern in
terms of the GDP per capita growth has been the same for each of the countries. All the
countries chosen for the analysis has shown a sudden drop in the per capita income after the
global financial crisis of the year 2007 (Cohn, 2016). Government expenditure is one of the
Secure Best Marks with AI Grader
Need help grading? Try our AI Grader for instant feedback on your assignments.
11
prime measures of the activity of the government. However, it is different for different
economies chosen for the study. Australia's government spending is too low compared to the
other nations. Another important fact is that government spending also follows a similar
pattern and hence the curve coincides in the case of Germany, France, and Japan. The
economy of Australia has also shown a difference in terms of government debt as well (Liu,
Adam and Walker, 2018). The government of the other countries chosen for the analysis has
taken debt from the external market. Japan economy has a huge budget deficit and that
reflects on the external debt that the government has. And in terms of import, Germany ranks
first as it imports the highest as a percentage of its GDP (Sassen, 2016). There has been a
pattern that is followed by all the countries in terms of import which has also dropped during
the financial crisis of the year 2007. France on the other hand showed a strong relation
between the GDP and the government final consumption. The final consumption of the
government is the independent variable that influences the value of the GDP. In the case of
Germany, the high GDP of the economy requires the government to spend a heavy amount on
the economy that increases the final consumption.
Question 3
1980-01-01
1981-10-01
1983-07-01
1985-04-01
1987-01-01
1988-10-01
1990-07-01
1992-04-01
1994-01-01
1995-10-01
1997-07-01
1999-04-01
2001-01-01
2002-10-01
2004-07-01
2006-04-01
2008-01-01
2009-10-01
2011-07-01
2013-04-01
2015-01-01
2016-10-01
0.0
50000.0
100000.0
150000.0
200000.0
250000.0
0.0
2.0
4.0
6.0
8.0
10.0
12.0
14.0
Unfilled job and unemployment australia
Job vacancies Unemployment
years and quarters
Unfilled Job vacancies
Unemployment rate
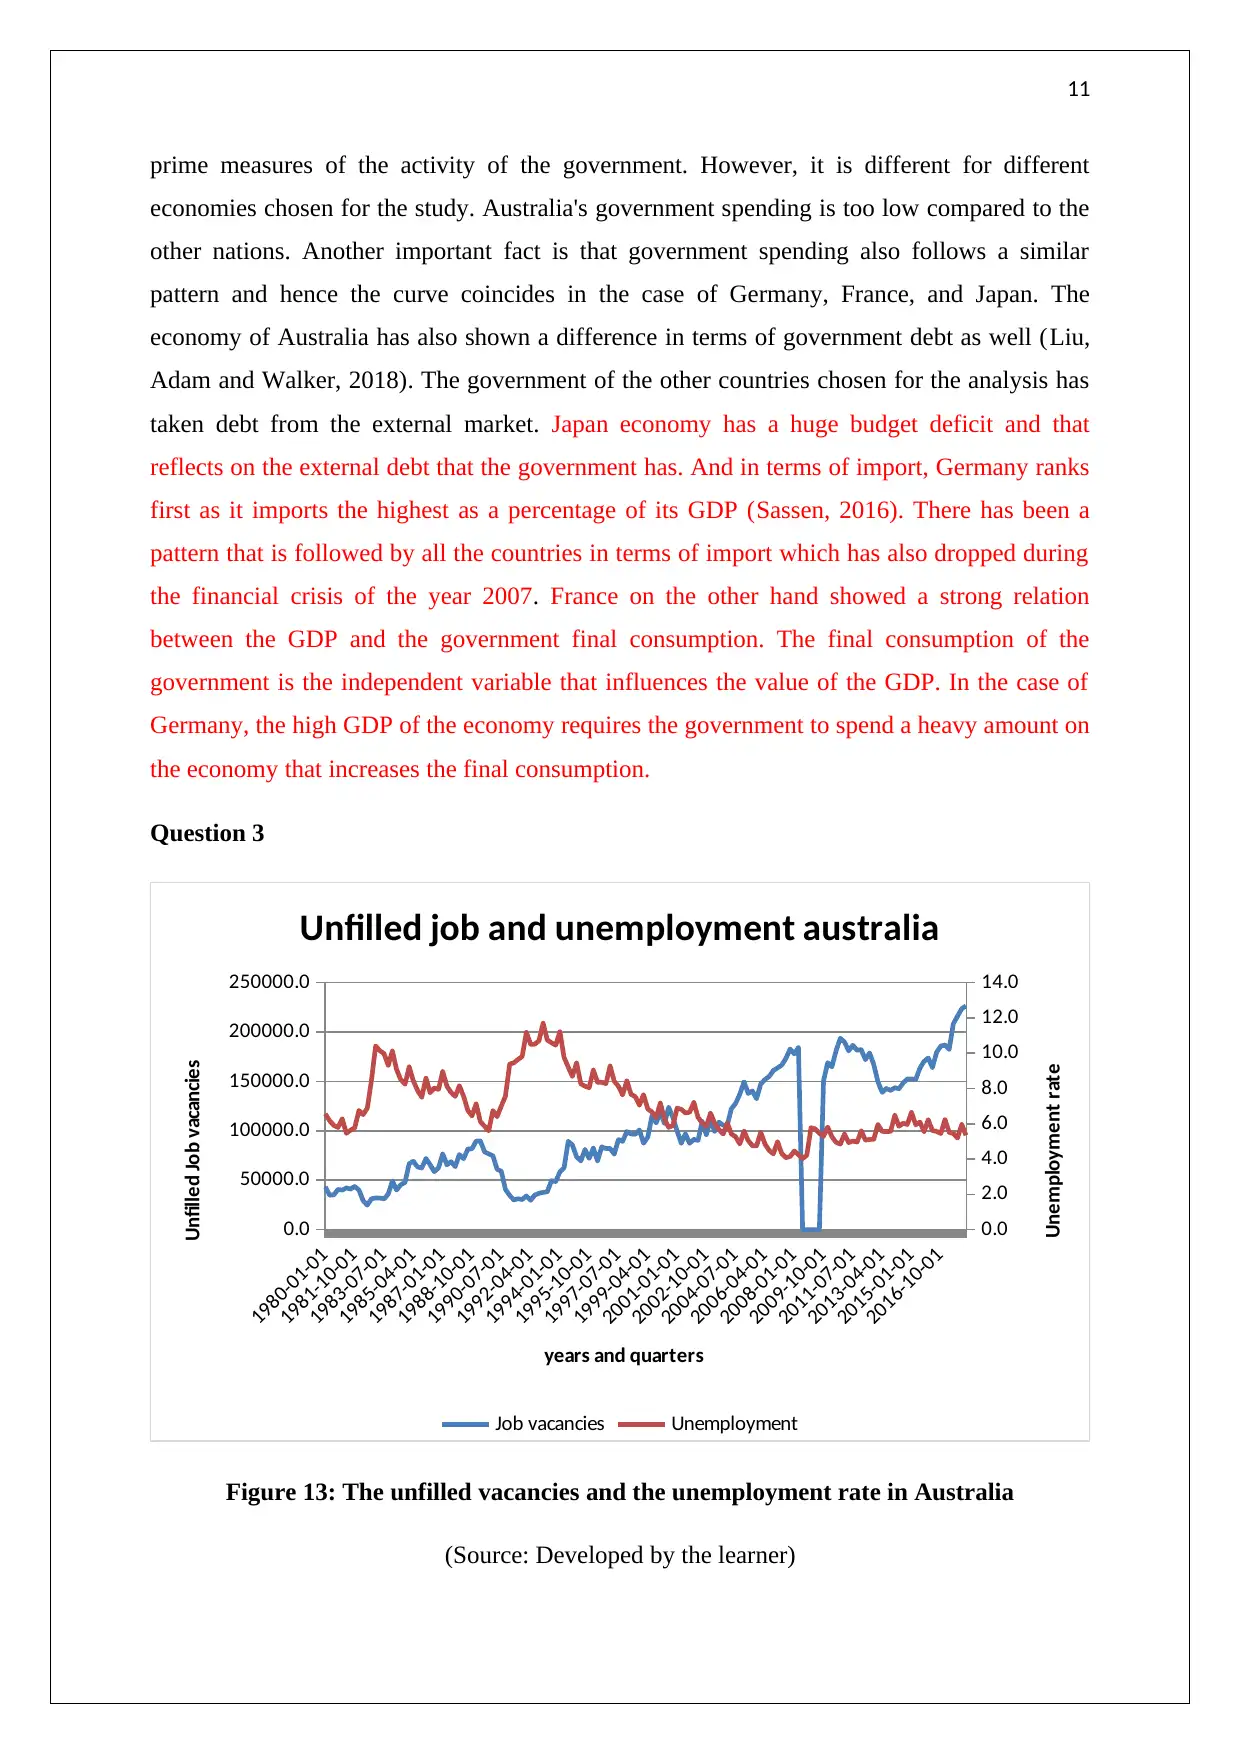
Figure 13: The unfilled vacancies and the unemployment rate in Australia
(Source: Developed by the learner)
prime measures of the activity of the government. However, it is different for different
economies chosen for the study. Australia's government spending is too low compared to the
other nations. Another important fact is that government spending also follows a similar
pattern and hence the curve coincides in the case of Germany, France, and Japan. The
economy of Australia has also shown a difference in terms of government debt as well (Liu,
Adam and Walker, 2018). The government of the other countries chosen for the analysis has
taken debt from the external market. Japan economy has a huge budget deficit and that
reflects on the external debt that the government has. And in terms of import, Germany ranks
first as it imports the highest as a percentage of its GDP (Sassen, 2016). There has been a
pattern that is followed by all the countries in terms of import which has also dropped during
the financial crisis of the year 2007. France on the other hand showed a strong relation
between the GDP and the government final consumption. The final consumption of the
government is the independent variable that influences the value of the GDP. In the case of
Germany, the high GDP of the economy requires the government to spend a heavy amount on
the economy that increases the final consumption.
Question 3
1980-01-01
1981-10-01
1983-07-01
1985-04-01
1987-01-01
1988-10-01
1990-07-01
1992-04-01
1994-01-01
1995-10-01
1997-07-01
1999-04-01
2001-01-01
2002-10-01
2004-07-01
2006-04-01
2008-01-01
2009-10-01
2011-07-01
2013-04-01
2015-01-01
2016-10-01
0.0
50000.0
100000.0
150000.0
200000.0
250000.0
0.0
2.0
4.0
6.0
8.0
10.0
12.0
14.0
Unfilled job and unemployment australia
Job vacancies Unemployment
years and quarters
Unfilled Job vacancies
Unemployment rate
Figure 13: The unfilled vacancies and the unemployment rate in Australia
(Source: Developed by the learner)
12
The unfilled job vacancies in Australia and the unemployment rate in the economy are
directly related to each other (Carpenter and Whitelaw, 2017). This figure and the
measurement also depict the shortage of skill sets among the existing labours force of the
market as well. It is important to note that the unemployment for the economy has reduced
over the years while the unfilled job vacancies have increased. Chiu (2018) stated that
unfilled job vacancies also is negatively related to the unemployment rate of the economy as
well. As the vacancies for the job increases for respective skill sets, the rate of unemployment
reduces in the economy. It also needs to be noted that, Unemployment rate has started to
reduce after the economy of Australia opened its economy to the global economy. Foreign
inflow increased and that increased the vacancies in the economy and created more jobs.
Apart from that, there are short term fluctuations in the unemployment which is very normal
and influenced by the changes in the business cycle. Temporary changes in the vacancies
have also been seen in the economy of Australia since the year 1990.
Part B
Long run case
The aggregate demand and the aggregate supply of the economy determine the overall
demand and the supply for all the goods and the services in the market. When the government
increases its spending in the economy in the long run, it mainly crowds out the investment in
the market. However, in the long run,, the output comes back to the same level while in the
short run; it increases the output of the economy (Forsgren, 2017). When the government
spending increases, it increases the aggregate demand in the economy and hence the output
increase. Now as the output in the demand for the money inverses increasing the interest rate
in the market. In the short run, the government spending while on one hand increases the
investment, it also decreases the investment through the increase in the interest rate.
However, the real impact on the aggregate demand depends on how the financial market
changes with the increase in government spending (Mohaddes and Pesaran, 2017).
The government spending increases the price level in the short run as the aggregate supply
remains the same (Matsuyama, 2017). Therefore the labours of the market demand a higher
salary from the employers owing to the rising prices. Now as the wage of the labours who are
also the consumers of the market rises, the demand for the goods and the services rise and
hence the price level rises (Spring, 2017). This increase in the rise in the price reduces the
real money supplied in the market and from the financial market the interest rate increases.
13
This increase in the interest rate in the short run and the no change in the investment ensures
that the increased government spending reduces the investment in the long run. This is called
the crowding out effects of government spending where the increase in spending reduces the
same amount of investment from the economy keeping the output at the same level in the
long run.
Part C
Introduction to the organisation
Sheng Long Bio-Tech International Co.Ltd is a manufacturing and marketing company
located in Vietnam. The company mainly deals with the aquatic feeds and animal health
product. After the inception in the year 2003, the company management has used various
networking and contacts to make it grow since. The company is completely owned by foreign
investors and hence its reputation is good in the global market. The company in the last 3
years have grown by 900% in the wake of falling agricultural output in the country
(Arkolakis et al. 2018). The company has a huge production facility that helps the company
to reduce per unit cost which further helps the company to have a competitive edge over the
other rivals of the market.
Summary of the role that has been chosen and the qualities for fulfilling it
The role that has been chosen is for the post of economist for the company. An economist is a
person that observes the data and tries to get insight from the information. Apart from that,
the role also requires critical analysis of the changes around the economy and the company
(Allen, 2016). Data collection and analysis is an integral part of the job that provides detailed
information regarding the changing environment.
The requirement of the job perfectly matches the quality of mine and hence I will be able to
do the job perfectly than anybody else. I have an innovating mind and hence the kind of job
that suits me the best is the technical jobs like that of an economist. I am thoughtful and a
critical thinker who uses common sense to bring out solutions to trickiest problems of the
world. I shape my opinion and views based on the facts and hence a job role intensive in
data-driven decision making will be perfect for me. Therefore, this job role in the Sheng
Long Bio-Tech International Co.Ltd as an economist is the best for me and given my
expertise I will be able to serve the company in a better way than any other else.
Paraphrase This Document
Need a fresh take? Get an instant paraphrase of this document with our AI Paraphraser

14
Things that drew me to the job
First and the foremost thing that drew me to the chosen position of the company is the value
that I have for data-driven decision making. Data-driven decision making increases the
robustness of the decision and makes it fruitful for the company. Apart from that my interest
in the technical field also draws me to this position of the company. I have an interest in real
life data collection and analysis that gives out meaningful insights regarding the behaviour
and the changes in the external environment. Apart from that, I have a keen interest in
thoughtful decision making and finding out a solution for any problem. In addition to that my
personality traits are also in line with the requirement of the job role. I have a huge curiosity
regarding how the world works and hence the job of economist draws me to it. Lastly, the
skills are the thing that attracts to the requirement and the role of the position. My major is
management where I learnt the management of resources in order to have better productivity
for the organisation. I also learnt the interdependence of economic agent and hence it draws
me to the position of economist at Sheng Long Bio-Tech International Co.Ltd.
Reflection on the economist interview
First interesting aspect of the interview is that it shows why economics should be studied by
someone. As he pointed out, economies allow you to understand how the economies and the
government work. Apart from that, the interview also furnishes how the knowledge of
economics is used in a professional space. Apart from that, he also pointed out the things that
need to be done in order to get hired by large companies of the market as an economist.
These aspects of the interview would help me in setting the right direction in the future as an
economist. The areas of concern that has been raised are that professional experience as an
economist is important to have a better contribution to a company and hence a student must
do an internship before they get absorbed by companies. There are a number of unanswered
question that the interview has left me with. The most important question that has come is if
the government can find the solution to the economic problems then why not they do it right
away. I can discuss the questions with the teachers and the mentors but I also understand that
economic problems are complex and hence cannot have a black and white solution.
Review of the action plan
I have set up an action plan based on the interview that will help me take a decision through
the journey before I get a job as an economist in a company. First and the foremost thing that

15
I am working on are to improve my conceptual knowledge of the subject economics. I want
to have deeper knowledge and theoretical depth in that field. Apart from that, I have also
planned to have practical working knowledge using the theories of economics. I will work as
an intern in the businesses to have adequate working experience and implementation skills of
the theories. Lastly, as has been mentioned in the interview, I will look for a job as an
economist that will enable me to have a bigger impact on the decision making of the
company through data-driven insights.
16
Reference
Allen, R.E., 2016. Financial crises and recession in the global economy. Edward Elgar
Publishing.
Arkolakis, C., Ramondo, N., Rodríguez-Clare, A. and Yeaple, S., 2018. Innovation and
production in the global economy. American Economic Review, 108(8), pp.2128-73.
Carpenter, J.N. and Whitelaw, R.F., 2017. The development of China's stock market and
stakes for the global economy. Annual Review of Financial Economics, 9, pp.233-257.
Chiu, S.W.K., 2018. City states in the global economy: Industrial restructuring in Hong
Kong and Singapore. Routledge.
Cohn, T.H., 2016. Global political economy: Theory and practice. Routledge.
Forsgren, M., 2017. Theories of the multinational firm: A multidimensional creature in the
global economy. Edward Elgar Publishing.
Gilpin, R., 2018. The challenge of global capitalism: The world economy in the 21st century.
Princeton University Press.
Holland, J.H., 2018. The global economy as an adaptive process. The economy as an evolving
complex system (pp. 117-124). CRC Press.
Liu, Z., Adams, M. and Walker, T.R., 2018. Are exports of recyclables from developed to
developing countries waste pollution transfer or part of the global circular
economy?. Resources, Conservation and Recycling, 136, pp.22-23.
Matsuyama, K., 2017. Engel’s Law in the Global Economy: Demand-Induced Patterns of
Structural Change and Trade across Countries. mimeo, Northwestern University.
Mohaddes, K. and Pesaran, M.H., 2017. Oil prices and the global economy: Is it different this
time around?. Energy Economics, 65, pp.315-325.
Sassen, S., 2016. The Global City: Strategic Site, New Frontier. In Managing Urban
Futures (pp. 89-104). Routledge.
Secure Best Marks with AI Grader
Need help grading? Try our AI Grader for instant feedback on your assignments.
17
Scott, D., Gössling, S., Hall, C.M. and Peeters, P., 2016. Can tourism be part of the
decarbonized global economy? The costs and risks of alternate carbon reduction policy
pathways. Journal of Sustainable Tourism, 24(1), pp.52-72.
Spring, J., 2017. The intersection of cultures: Multicultural education in the United States
and the global economy. Routledge.
1 out of 17
Related Documents


Your All-in-One AI-Powered Toolkit for Academic Success.
+13062052269
info@desklib.com
Available 24*7 on WhatsApp / Email
![[object Object]](/_next/static/media/star-bottom.7253800d.svg)
Unlock your academic potential
© 2024 | Zucol Services PVT LTD | All rights reserved.