The Impact of Hormone Use Perception on Consumer Meat Preference
VerifiedAdded on 2022/01/23
|22
|6365
|240
Report
AI Summary
This research paper, prepared for the Southern Agricultural Economics Association Annual Meeting in 2017 by Ruoye Yang, Kellie Curry Raper, and Jayson L. Lusk from Oklahoma State University, investigates the impact of consumer perception of hormone use on meat preferences. The study addresses the discrepancy between consumer understanding of hormone use in meat production and actual practices, particularly concerning beef, pork, and chicken. The authors analyze how consumer perceptions affect choices for unlabeled meat products and willingness to pay (WTP) premiums for products labeled as "no added hormones" (NAH). Using choice experiment data from the Oklahoma State University monthly Food Demand Survey, the research reveals that consumers often underestimate hormone use in cattle production but overestimate it in pork and chicken. The findings, based on a conditional logit model and a Tobit model, suggest that consumer perception of hormone use and demographic characteristics significantly influence food preferences and WTP for NAH labels. The paper contributes to the understanding of consumer behavior in the meat market, highlighting the importance of consumer beliefs in purchase decisions and the potential for misleading welfare estimates if consumer perceptions are not considered.
The Impact of Hormone Use Perception on Consumer Meat Preference
Ruoye Yang
Ph.D. Student
Department of Agricultural Economics
Oklahoma State University
522 Agricultural Hall
Stillwater, OK 74078
Email: Ruoye.yang@okstate.edu
Kellie Curry Raper
Associate Professor
Department of Agricultural Economics
Oklahoma State University
514 Agricultural Hall
Stillwater, OK 74078
Email: kellie.raper@okstate.edu
Jayson L. Lusk
Professor
Department of Agricultural Economics
Oklahoma State University
411 Agricultural Hall
Stillwater, OK 74078
Email: jayson.lusk@okstate.edu
Selected Paper prepared for presentation at the Southern Agricultural Economics Association
Annual Meeting, Mobile, AL, February 4-7, 2017
Copyright 2017 by Ruoye Yang, Kellie Curry Raper, and Jayson L. Lusk. All rights reserved. Readers may
make verbatim copies of this document for non-commercial purposes by any means, provided that this
copyright notice appears on all such copies.
Paraphrase This Document
Need a fresh take? Get an instant paraphrase of this document with our AI Paraphraser
Abstract
Consumers see retail beef products labeled as produced with no added hormones (NAH),
but also see similar labels on pork and chicken products on market shelves despite the fact that
added hormones are not used in production. This may mislead consumers to think hormones are
used in meat production as a whole. This research examines the impact of hormone use
perception on consumer preference for meat products. Specifically, we assess consumer
perception of hormone use in different livestock species as compared to actual use in production.
We then assess whether hormone use perception affects consumer choice for unlabeled meat
products. Finally, we identify whether consumer perception of hormone use affects willingness
to pay (WTP) premiums for meat products labeled as produced with NAH. Choice experiment
data was collected using Oklahoma State University monthly Food Demand Survey. Results
indicate that consumers underestimate the rate of hormone use in cattle production, but
overestimate the rate of hormone use in pork and chicken production. Results from a conditional
logit model suggest that consumer perception of hormone use can affect food preferences for
unlabeled meat products. Using a Tobit model, we also found WTP premiums for the NAH label
are affected by consumer perception of hormone use and by demographic characteristics.
Impact of Hormone Use Perception on Consumer Meat Preference
Introduction
Hormone use in meat production has received much recent attention from media,
consumer groups and other sources. Hormones act as growth promotants in animals for improved
weight gain and feed efficiency before slaughter in meat industries. It is estimated that more than
90 percent of all U.S. feedlot cattle are injected with hormones to improve growth rates (USDA,
2013). Six different kinds of steroid hormones are currently approved by Food and Drug
Administration (FDA) for use in beef production: estradiol, progesterone, testosterone, zeranol,
trenbolone acetate, and melengestrol acetate (FDA 2015). Currently, federal regulations do not
allow these or other hormones to be used in poultry (chickens, turkeys, ducks) or hog production
(USDA, 2015). FDA does allow the use of recombinant bovine growth hormone (rbGH) to
increase milk production in dairy cattle, but it is not used in beef cattle (FDA 2015). Though
hormone use is prohibited by federal regulations in poultry and swine production, other growth
promotants are used in production. In swine production, beta-agonists (e.g. Ractopamine) are
widely used to enhance lean muscle gain and feed conversion by stimulating receptors on cell
surfaces and promoting proteins synthesis in muscle tissue. Beta-agonists work at a cellular level
without affecting the hormone levels of the animal (American Meat Science Association, 2015).
Beta-agonists, such as Ractopamine and Zilpaterol, are also used in 60% to 80% of feedlot cattle
in the U.S. (Penn State Extension, 2016). Controversy has been raised on the impact of beta-
agonists on animal welfare and export issues (Agweb, 2013).
Consumers, however, may think differently about the prevalence of hormone use in
livestock production. Given the prevalence of news and information about hormone use,
consumers may perceive that prevalence of hormone use in the meat industry as a whole is very
high. Research indicates that hormone use in cattle does not pose a risk to human beings or the
⊘ This is a preview!⊘
Do you want full access?
Subscribe today to unlock all pages.
Trusted by 1+ million students worldwide
environment and its use is approved by FDA (Capper and Hayes, 2015; Cattle network, 2012;
FDA, 2015). Still, consumer concerns exist regarding hormone use, including potential health
risks (Organic Consumers Association, 2007; Health, 2016).
Consumer concern about the safety of hormone use in livestock production is relatively
high. A study conducted by the Food Marketing Institute (1995) found that 50% of consumers
said hormones were a serious hazard. Lusk, Fox, and McIlvain (1999) found that consumer
concern about animal growth enhancers, including hormones, was higher than concern for
additives, preservatives, and antibiotic use, but lower than concern for bacteria, spoilage, and
chemicals. Moreover, research shows that consumers do not always equally believe the
information on probabilities presented in advertisements, experiments or surveys (Hayes et al.,
1995). Teisl and Roe (2010) show that people’s perceptions of the likelihood of getting sick from
food-borne illness can differ from the probabilities of food contamination in reality. Similarly,
consumer perception of hormone use for different livestock species may differ from reality.
Introduction of food labels can also create uncertainty and influence beliefs about the quality of
unlabeled products (Dannenberg, Scatasta and Strum, 2011). Consumers see beef products
labeled as produced with no added hormones (NAH), but also see similar labels on pork and
poultry products on market shelves despite the fact that added hormones are not used in
production. This may mislead consumers to think hormones are used in pork and poultry
production. What are consumer perceptions of hormone use in production of beef, pork and
poultry? Does consumer perception of hormone use affect demand for beef, pork or chicken?
Are consumers willing to pay more for meat products labeled as produced with NAH over those
without the label?
Paraphrase This Document
Need a fresh take? Get an instant paraphrase of this document with our AI Paraphraser
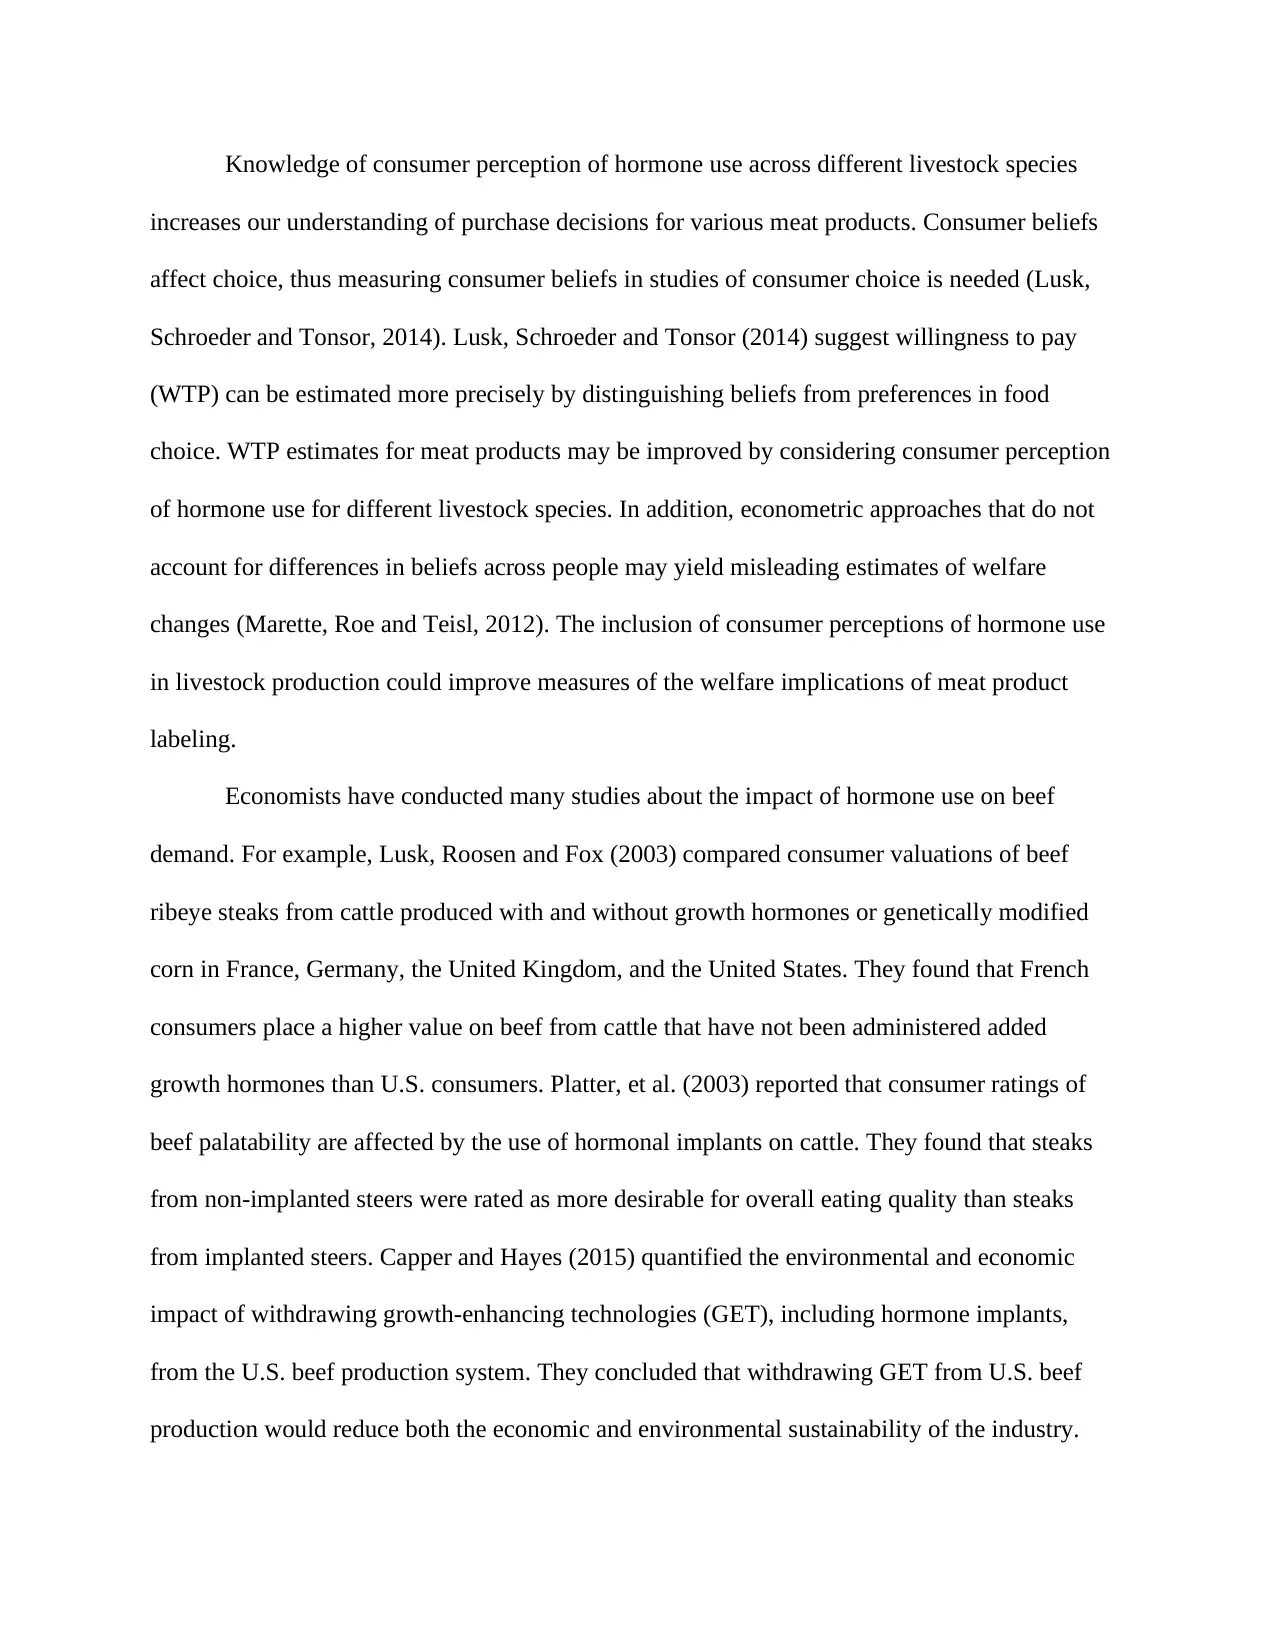
Knowledge of consumer perception of hormone use across different livestock species
increases our understanding of purchase decisions for various meat products. Consumer beliefs
affect choice, thus measuring consumer beliefs in studies of consumer choice is needed (Lusk,
Schroeder and Tonsor, 2014). Lusk, Schroeder and Tonsor (2014) suggest willingness to pay
(WTP) can be estimated more precisely by distinguishing beliefs from preferences in food
choice. WTP estimates for meat products may be improved by considering consumer perception
of hormone use for different livestock species. In addition, econometric approaches that do not
account for differences in beliefs across people may yield misleading estimates of welfare
changes (Marette, Roe and Teisl, 2012). The inclusion of consumer perceptions of hormone use
in livestock production could improve measures of the welfare implications of meat product
labeling.
Economists have conducted many studies about the impact of hormone use on beef
demand. For example, Lusk, Roosen and Fox (2003) compared consumer valuations of beef
ribeye steaks from cattle produced with and without growth hormones or genetically modified
corn in France, Germany, the United Kingdom, and the United States. They found that French
consumers place a higher value on beef from cattle that have not been administered added
growth hormones than U.S. consumers. Platter, et al. (2003) reported that consumer ratings of
beef palatability are affected by the use of hormonal implants on cattle. They found that steaks
from non-implanted steers were rated as more desirable for overall eating quality than steaks
from implanted steers. Capper and Hayes (2015) quantified the environmental and economic
impact of withdrawing growth-enhancing technologies (GET), including hormone implants,
from the U.S. beef production system. They concluded that withdrawing GET from U.S. beef
production would reduce both the economic and environmental sustainability of the industry.
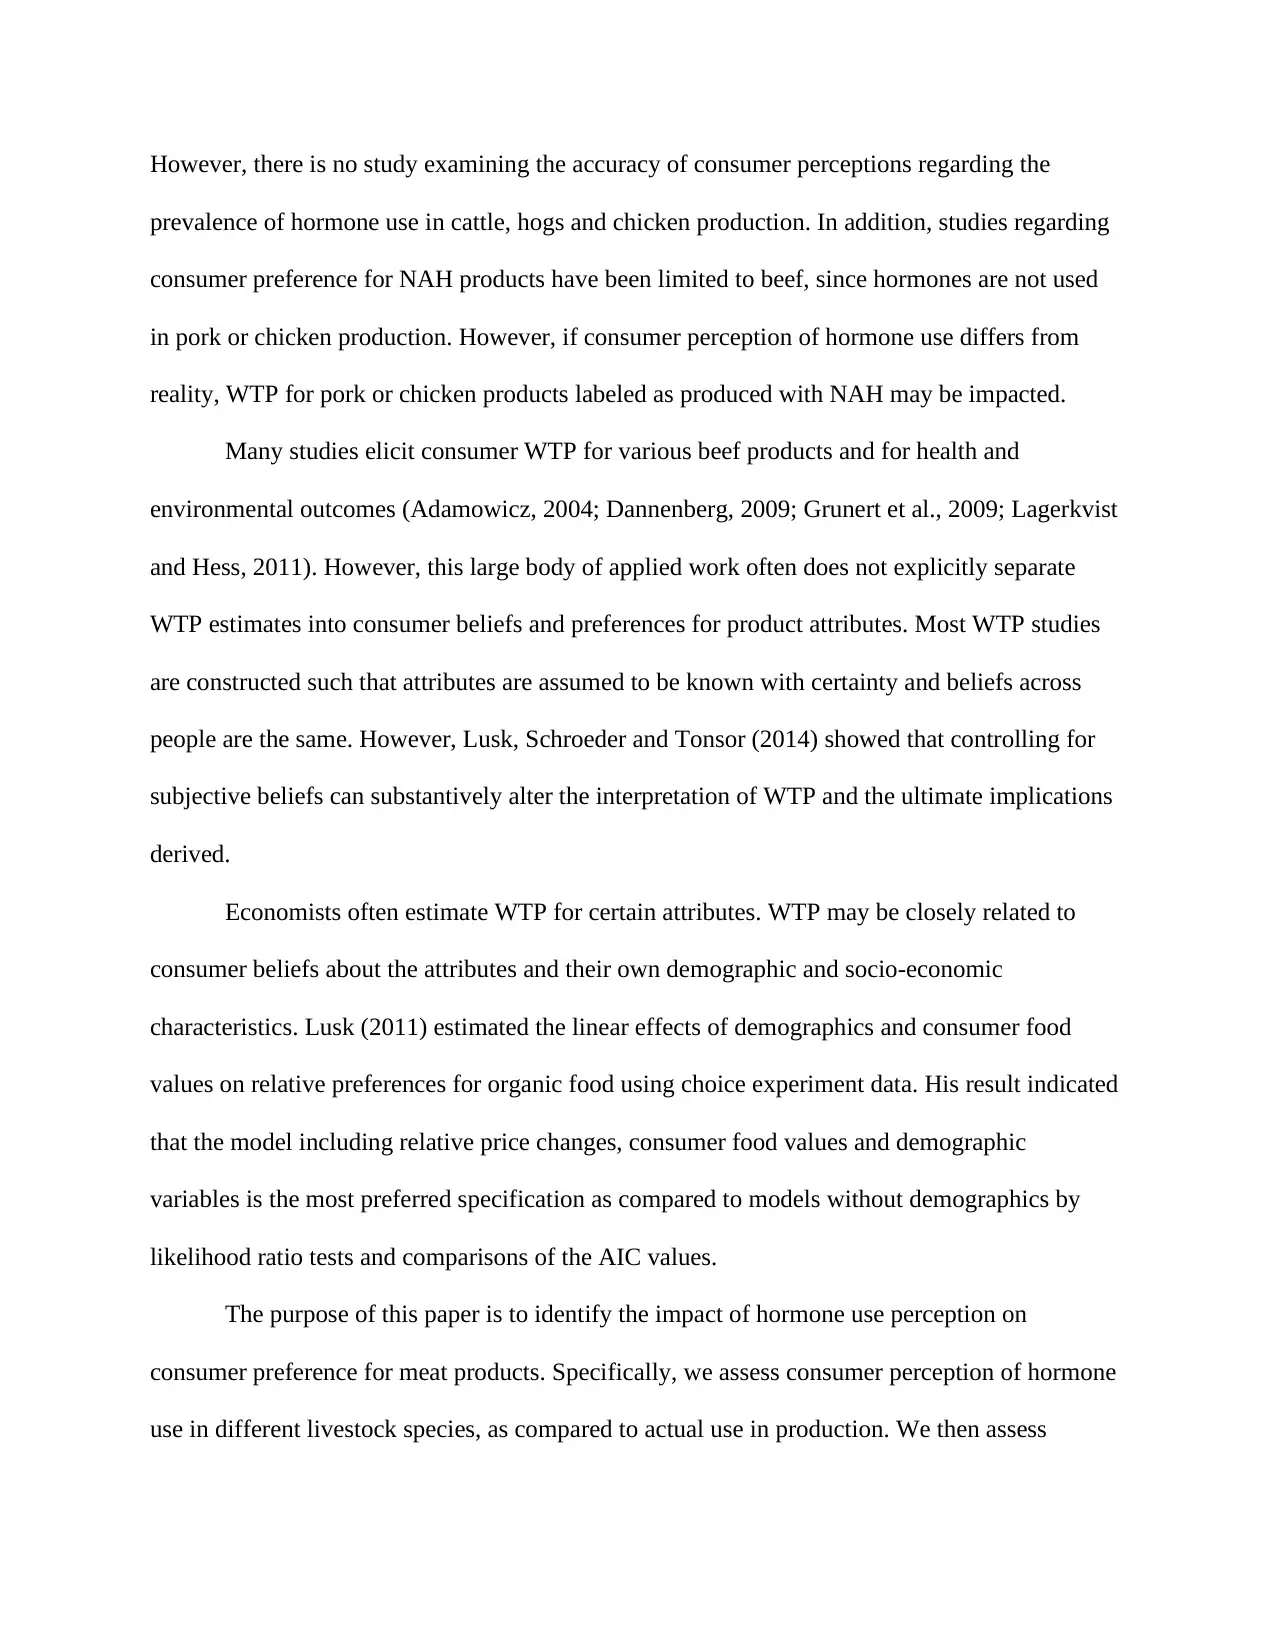
However, there is no study examining the accuracy of consumer perceptions regarding the
prevalence of hormone use in cattle, hogs and chicken production. In addition, studies regarding
consumer preference for NAH products have been limited to beef, since hormones are not used
in pork or chicken production. However, if consumer perception of hormone use differs from
reality, WTP for pork or chicken products labeled as produced with NAH may be impacted.
Many studies elicit consumer WTP for various beef products and for health and
environmental outcomes (Adamowicz, 2004; Dannenberg, 2009; Grunert et al., 2009; Lagerkvist
and Hess, 2011). However, this large body of applied work often does not explicitly separate
WTP estimates into consumer beliefs and preferences for product attributes. Most WTP studies
are constructed such that attributes are assumed to be known with certainty and beliefs across
people are the same. However, Lusk, Schroeder and Tonsor (2014) showed that controlling for
subjective beliefs can substantively alter the interpretation of WTP and the ultimate implications
derived.
Economists often estimate WTP for certain attributes. WTP may be closely related to
consumer beliefs about the attributes and their own demographic and socio-economic
characteristics. Lusk (2011) estimated the linear effects of demographics and consumer food
values on relative preferences for organic food using choice experiment data. His result indicated
that the model including relative price changes, consumer food values and demographic
variables is the most preferred specification as compared to models without demographics by
likelihood ratio tests and comparisons of the AIC values.
The purpose of this paper is to identify the impact of hormone use perception on
consumer preference for meat products. Specifically, we assess consumer perception of hormone
use in different livestock species, as compared to actual use in production. We then assess
⊘ This is a preview!⊘
Do you want full access?
Subscribe today to unlock all pages.
Trusted by 1+ million students worldwide
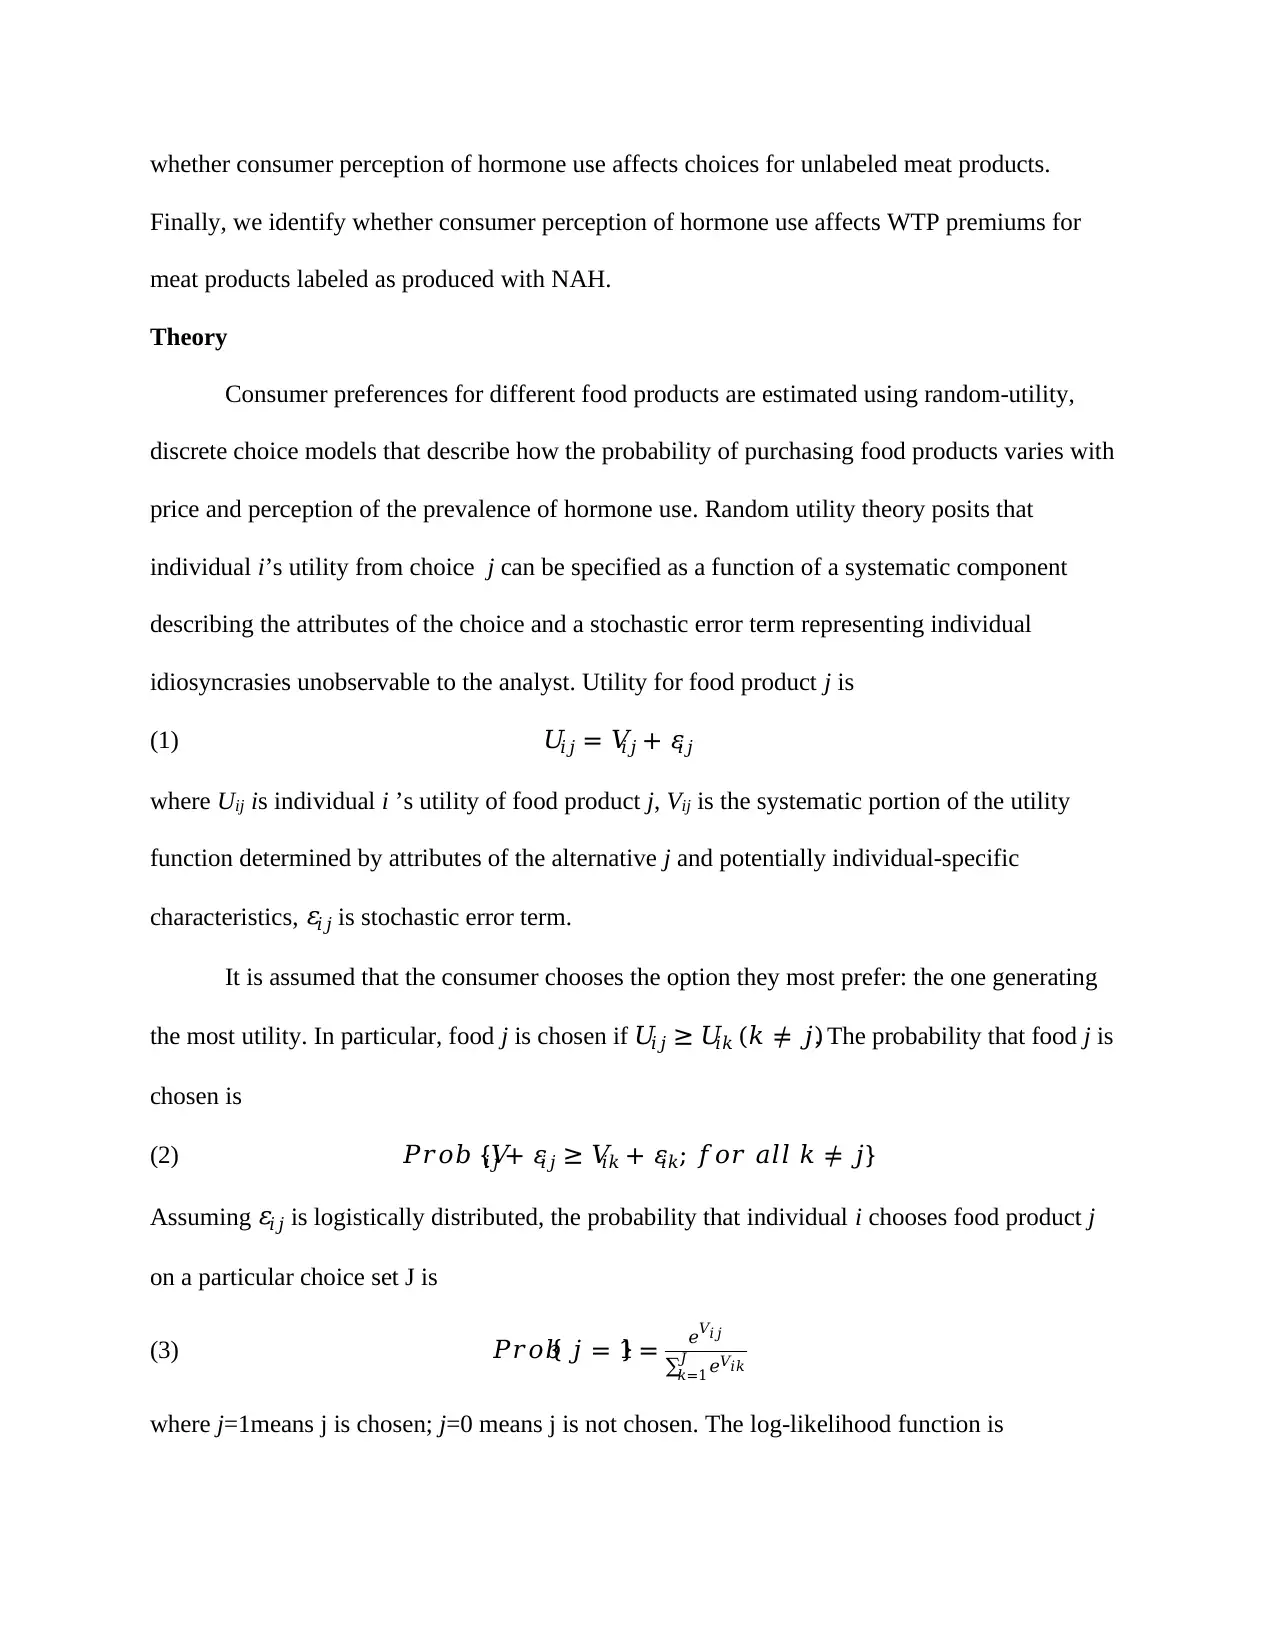
whether consumer perception of hormone use affects choices for unlabeled meat products.
Finally, we identify whether consumer perception of hormone use affects WTP premiums for
meat products labeled as produced with NAH.
Theory
Consumer preferences for different food products are estimated using random-utility,
discrete choice models that describe how the probability of purchasing food products varies with
price and perception of the prevalence of hormone use. Random utility theory posits that
individual i’s utility from choice j can be specified as a function of a systematic component
describing the attributes of the choice and a stochastic error term representing individual
idiosyncrasies unobservable to the analyst. Utility for food product j is
(1) 𝑈𝑖𝑗 = 𝑉𝑖𝑗 + 𝜀𝑖𝑗
where Uij is individual i ’s utility of food product j, Vij is the systematic portion of the utility
function determined by attributes of the alternative j and potentially individual-specific
characteristics, 𝜀𝑖𝑗 is stochastic error term.
It is assumed that the consumer chooses the option they most prefer: the one generating
the most utility. In particular, food j is chosen if 𝑈𝑖𝑗 ≥ 𝑈𝑖𝑘 (𝑘 ≠ 𝑗). The probability that food j is
chosen is
(2) 𝑃𝑟𝑜𝑏 {𝑉𝑖𝑗 + 𝜀𝑖𝑗 ≥ 𝑉𝑖𝑘 + 𝜀𝑖𝑘; 𝑓𝑜𝑟 𝑎𝑙𝑙 𝑘 ≠ 𝑗}
Assuming 𝜀𝑖𝑗 is logistically distributed, the probability that individual i chooses food product j
on a particular choice set J is
(3) 𝑃𝑟𝑜𝑏{ 𝑗 = 1} = 𝑒𝑉𝑖𝑗
∑ 𝑒𝑉𝑖𝑘
𝐽
𝑘=1
where j=1means j is chosen; j=0 means j is not chosen. The log-likelihood function is
Paraphrase This Document
Need a fresh take? Get an instant paraphrase of this document with our AI Paraphraser
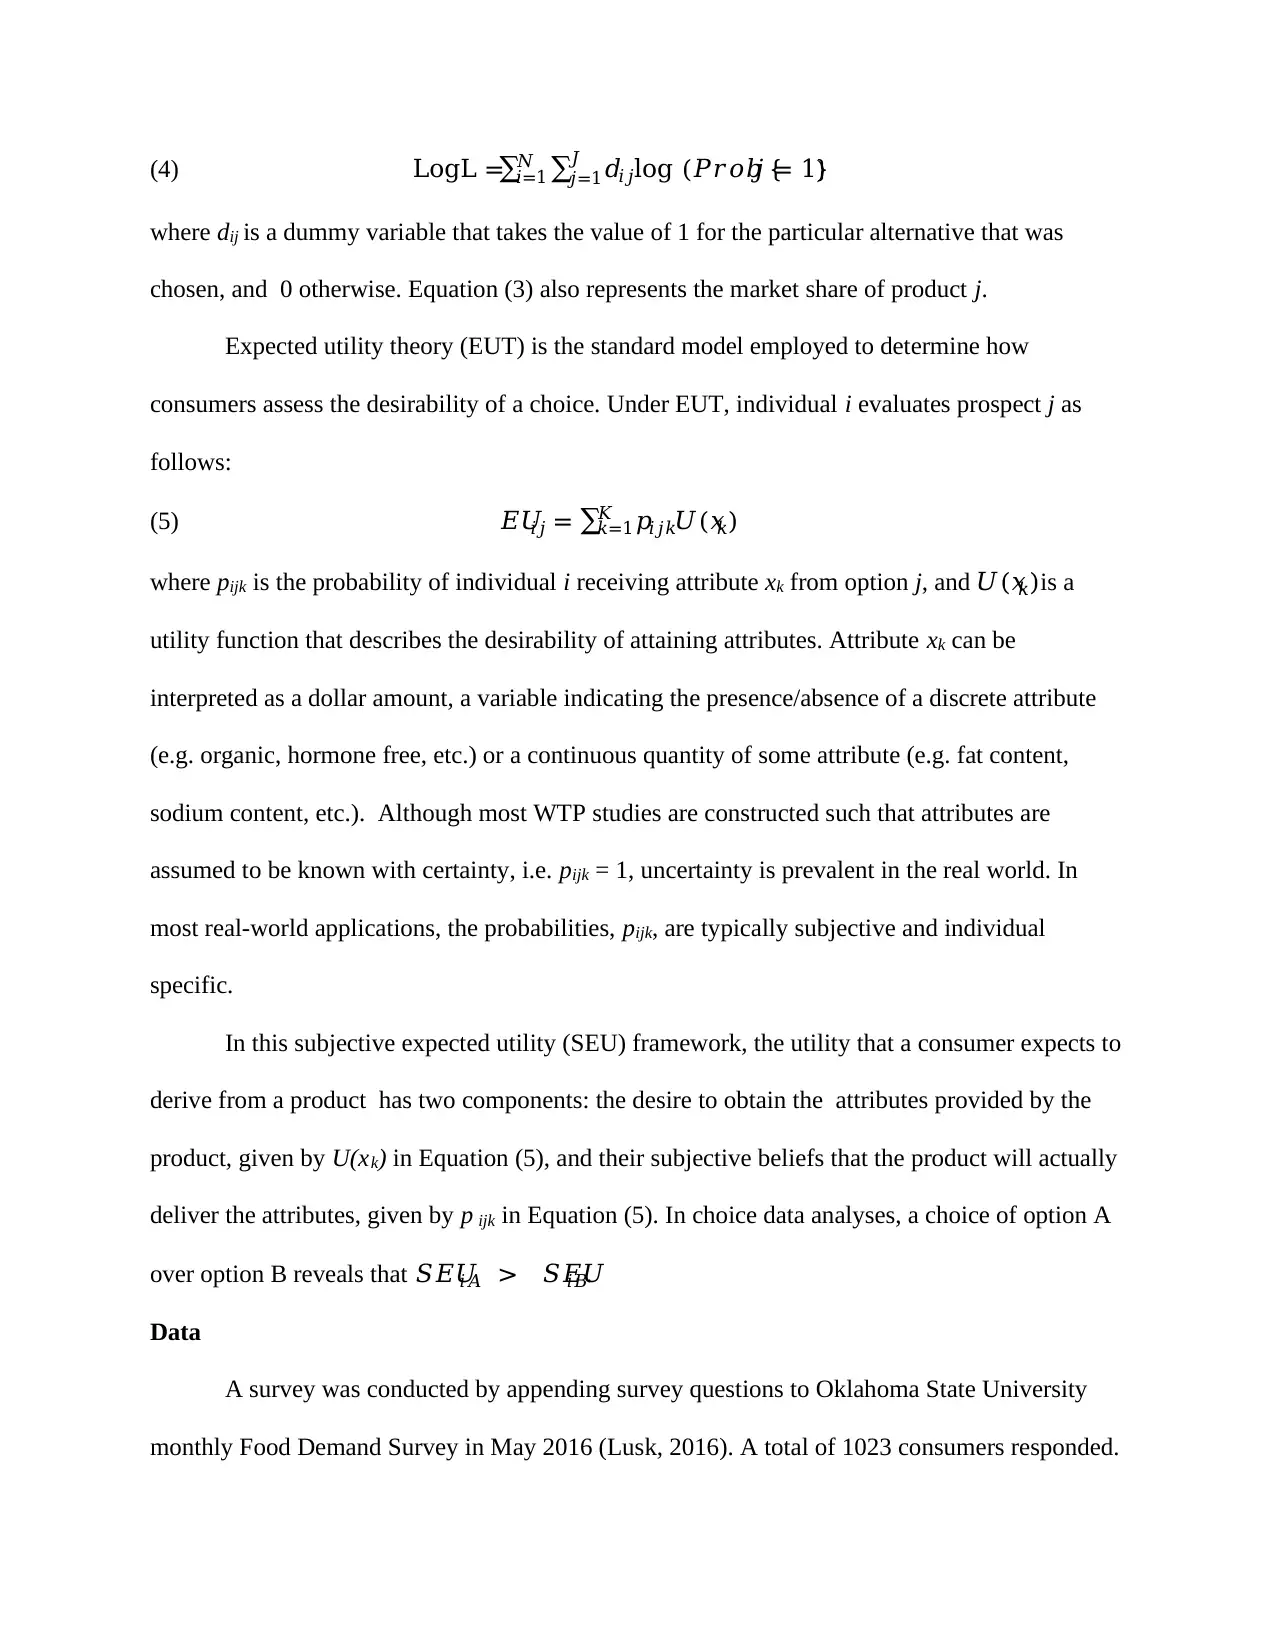
(4) LogL =∑ ∑ 𝑑𝑖𝑗log (𝑃𝑟𝑜𝑏 {
𝐽
𝑗=1
𝑁
𝑖=1 𝑗 = 1})
where dij is a dummy variable that takes the value of 1 for the particular alternative that was
chosen, and 0 otherwise. Equation (3) also represents the market share of product j.
Expected utility theory (EUT) is the standard model employed to determine how
consumers assess the desirability of a choice. Under EUT, individual i evaluates prospect j as
follows:
(5) 𝐸𝑈𝑖𝑗 = ∑ 𝑝𝑖𝑗𝑘𝑈(𝑥𝑘)𝐾
𝑘=1
where pijk is the probability of individual i receiving attribute xk from option j, and 𝑈(𝑥𝑘)is a
utility function that describes the desirability of attaining attributes. Attribute xk can be
interpreted as a dollar amount, a variable indicating the presence/absence of a discrete attribute
(e.g. organic, hormone free, etc.) or a continuous quantity of some attribute (e.g. fat content,
sodium content, etc.). Although most WTP studies are constructed such that attributes are
assumed to be known with certainty, i.e. pijk = 1, uncertainty is prevalent in the real world. In
most real-world applications, the probabilities, pijk, are typically subjective and individual
specific.
In this subjective expected utility (SEU) framework, the utility that a consumer expects to
derive from a product has two components: the desire to obtain the attributes provided by the
product, given by U(xk) in Equation (5), and their subjective beliefs that the product will actually
deliver the attributes, given by p ijk in Equation (5). In choice data analyses, a choice of option A
over option B reveals that 𝑆𝐸𝑈𝑖𝐴 > 𝑆𝐸𝑈𝑖𝐵.
Data
A survey was conducted by appending survey questions to Oklahoma State University
monthly Food Demand Survey in May 2016 (Lusk, 2016). A total of 1023 consumers responded.
Subjects were asked about their perception of the prevalence of hormone use in production of
different livestock species including beef cattle, pigs, and broiler chickens. They were also asked
to make 9 discrete choices. In each choice, subjects chose between 8 types of food products
including hamburger, steak, pork chop, ham, chicken breast, chicken wings, bean, pasta and a
“no purchase” option. Prices of each food products varied across the 9 choices. Willingness-to-
pay premiums were solicited for meat products labeled as produced with NAH. Demographic
information was collected, including farm experience, age, household income, education level,
regions and presence of children in the household.
Methods and Procedures
Standard t-tests are used to examine consumer perception of hormone use rates in meat
production across cattle, hogs and chicken as compared to actual use in production. Ordinary
least squares (OLS) is used to assess whether consumer perception of hormone use rates differ
across education levels, ages, income levels and regions. Random expected utility models are
used to identify relative preferences for hormone added meat products over NAH meat products.
The conventional model estimated in choice experiment studies includes belief variables:
(6) 𝐸𝑈𝑗 = 𝛾𝑗 − 𝛼𝑃𝑟𝑖𝑐𝑒𝑗
where 𝐸𝑈𝑗 is expected utility of product j, 𝑃𝑟𝑖𝑐𝑒𝑗 is the price of product j, 𝛾𝑗 is the fixed effect
of product j and incorporates beliefs about hormone use in food product j.
We estimate a random expected utility model:
(7) 𝐸𝑈𝑖𝑗 = 𝛾𝑗 + 𝑃𝑖𝑗𝑈(𝐻) − 𝛼𝑃𝑟𝑖𝑐𝑒𝑗
where Pij is subject i’s belief that product j is hormone added, U(H) is relative preference for
hormone added product over NAH product. The preference for NAH, U(NH), has implicitly been
normalized to zero for identification such that U(H) is the difference in utilities of hormone
⊘ This is a preview!⊘
Do you want full access?
Subscribe today to unlock all pages.
Trusted by 1+ million students worldwide
added and NAH: U(H) − U(NH). This allows isolation of the relative contributions of hormone
added from the overall preference for product j.
An additional consideration is that consumers’ relative preference for NAH meat can
vary across different species. The random expected utility model becomes
(8) 𝐸𝑈𝑖𝑗 = 𝛾𝑗 + 𝑃𝑖𝑗𝑈(𝐻)𝑗 − 𝛼𝑃𝑟𝑖𝑐𝑒𝑗
where 𝑈(𝐻)𝑗 is relative preference for NAH product j over hormone added product j. We allow
relative preferences for NAH meat products to differ from each other. The -2 Log L and AIC
model selection criteria are used to test whether random expected utility models (Equation (7)
and Equation (8)) fit the data better than the conventional model (Equation (6)).
Meat product demand is analyzed for 1) consumer perceived hormone use rates, 2) actual
hormone use rates, and 3) NAH (only for cattle). The demand for meat product j on a particular
choice set J is
(9) 𝐷𝑖𝑗 = 𝑒𝐸𝑈𝑖𝑗
∑ 𝑒𝐸𝑈𝑖𝑘
𝐽
𝑘=1
Since consumer perceptions may vary across demographic groups, a Tobit model is used
to identify whether WTP premiums for product labeled as produced with NAH are affected by
consumer perception of hormone use and demographic factors. The Tobit model is chosen
because maximum WTP premiums were censored. Demographic factors include farm
experience, age, household income, education level, regions, and presence of children in the
household.
Results
Consumer perception of hormone use prevalence ranged from 0 to 100% for each specie
(Figure1). Perception patterns are similar across species with peaks of consumers near 50% and
near 100% for each species. The average perceived hormone use rate is approximately 62% for
Paraphrase This Document
Need a fresh take? Get an instant paraphrase of this document with our AI Paraphraser
cattle, 55% for hogs, and 57% for chicken. Compared to actual hormone use rates, consumer
perceived hormone use rates are significantly different at the 99% level. Interestingly, on
average, consumers underestimate hormone use in beef and overestimate hormone use in pork
and poultry.
Table 1 reports results of three model specifications, including the conventional model
(Equation (6)), random expected utility model incorporating beliefs and identification of
preferences for hormone added (Equation (7)), and the modified random expected utility model
allowing different preference for hormone added (U(H)) across meat products (Equation (8)).
Magnitude and significance of shared parameters are similar across models. The -2 Log L and
AIC model selection criteria clearly favor the expected utility models incorporating beliefs over
the conventional model.
In general, consumers derive the highest utility from steak and the least utility from ham
among meat products represented in all three models (Table 1). The marginal utility of hormone
use rate (U(H)-U(NH) (mean)) is negative in the random expected utility model indicating if a
consumer believes a meat product is hormone added, he is less likely to choose the meat. The
marginal utilities of hormone use rate for individual meat products are also negative in the
modified random expected utility model. The marginal utility of hormone use rate for steak
(0.554) is the highest and for ham (0.125) is the lowest. The fact that the marginal utilities of
hormone use rate are different across meat products implying that the marginal utility of
hormone use rate for high value meat is higher than for low value meat.
Demand for the meat products in this study is affected by perceived hormone use rate in
different livestock species (Figure 2). Figure 2 simulates demand graphs reflecting market share
among the 9 options in our choice experiment across perceived, actual, and –in the case of beef-
no hormones, at various prices according to Equation 9. Predicted market share for steak with
perceived hormone use (62%) at any price is larger than with actual hormone use (90%).
Predicted market share for hormone free steak is the largest among perceived, actual and none.
The impact of hormone use perception on demand for burger is similar to steak. If consumers
perceived NAH in pork or chicken production, the market share for chops, ham, chicken breasts
and wings would be larger.
Generally, consumers are willing to pay more for meat products labeled as produced with
NAH. WTP premiums for NAH steak are the highest across the 6 meat products while WTP
premiums for NAH chicken wings are the lowest (Table 2). Table 3 reports three model
specifications associated with WTP premiums for meat products labeled as produced with NAH.
Model 1 shows that WTP premiums for meat products labeled as produced with NAH are indeed
sensitive to consumer perception of hormone use rate in different livestock species. Model 2 and
Model 3 incorporate demographic characteristics. Model 2 focuses only on the linear effects of
demographics on WTP premiums. Model 3 includes interaction effects between consumer
perception of hormone use and demographics. AIC and Log Likelihood values indicate that
Model 3 is the preferred specification. Results indicate that consumer perception of hormone use
is significantly related to WTP premiums for meat products labeled as produced with NAH.
Coefficients from Model 3 suggest that demographic factors including farm experience,
age, household income, education level, regions, and presence of children in the household affect
WTP premiums for NAH labeled meat products. For example, WTP premiums for consumers
who have farm experience are higher than for people without farm experience. In general, WTP
premiums increase in response to increased perceived hormone use rate across different
demographic characteristics. For example, WTP premiums for consumers with incomes more
⊘ This is a preview!⊘
Do you want full access?
Subscribe today to unlock all pages.
Trusted by 1+ million students worldwide
1 out of 22
Your All-in-One AI-Powered Toolkit for Academic Success.
+13062052269
info@desklib.com
Available 24*7 on WhatsApp / Email
![[object Object]](/_next/static/media/star-bottom.7253800d.svg)
Unlock your academic potential
Copyright © 2020–2026 A2Z Services. All Rights Reserved. Developed and managed by ZUCOL.