AF4S997 Quantitative Methods: DDM Analysis of British American Tobacco
VerifiedAdded on 2022/08/29
|17
|3500
|20
Report
AI Summary
This report conducts a comprehensive dividend discount model (DDM) analysis of British American Tobacco (BAT). It begins with an introduction to equity valuation and the DDM, explaining its relevance and application. The report then provides a company profile, detailing BAT's business operations and suitability for DDM valuation. Different types of DDM, including the zero-growth, constant-growth, two-stage, and H-model, are discussed. The report focuses on the constant growth and H-models for valuation, justifying the selection. It includes the derivation of the dividend growth rate, calculating both the average historical and CAGR growth rates. The required return is calculated using the Capital Asset Pricing Model (CAPM). Finally, the intrinsic value of the company is calculated using the chosen DDM models, followed by an investment recommendation and conclusion.

Running head: DDM
DDM
Name of the Student:
Name of the University:
Author Note:
DDM
Name of the Student:
Name of the University:
Author Note:
Paraphrase This Document
Need a fresh take? Get an instant paraphrase of this document with our AI Paraphraser
1DDM
Table of Contents
Introduction:...............................................................................................................................2
Discussion:.................................................................................................................................3
Company Profile:...................................................................................................................3
Suitability of the company for DDM:....................................................................................4
Types of DDM:......................................................................................................................4
Model for the Valuation of the Company:.............................................................................6
Derivation of Dividend Growth Rate:....................................................................................7
Calculation of Required Return:............................................................................................9
Intrinsic Value of the company:...........................................................................................11
Constant Growth Rate of Dividend:.................................................................................11
H – Model:.......................................................................................................................12
Investment Recommendation:..............................................................................................12
Conclusion:..............................................................................................................................13
References:...............................................................................................................................14
2DDM
Introduction:
The value of the company is measured by the price of the shares which is trading at
the market or the stock exchange. This represents the value which has been given by the
investors to the company depending on the business prospects of the company and by also
considering the future business opportunity of the company. However, the share price of the
company which is trading at the stock market depends on the demand supply factor and is
affected by the financial news which affects the price of the stock at the exchange (Thomas
2017).
The method to determine the value at which the shares of the company should be
trading at the market taking into consideration all the factors which might affect the value of
the company and its business prospects is known as intrinsic value of the company. The
intrinsic value of the company is calculated either by absolute valuation or relative valuation
of measurement of equity value. The absolute valuation means considering the cash flows
which can be generated from the projects which is being operated by the business which can
be measured by the free cash flow valuation method. Another method of valuation of the
share price is by using the dividend discount model, which considers the dividend which is
being paid by the company to the shareholders and discounts it to measure the share price of
the company. The relative valuation can be done by taking the multiples of the company and
comparing with the industry averages and calculating the should be price or the intrinsic
value of the shares. Also comparable company valuation can also be used to calculate the
share price of the company which should be the intrinsic value of the company (Gacus and
Hinlo 2018).
The aim of this report is to use the absolute method of equity valuation to calculate
the intrinsic value of the company. The method which is used for the calculation of the
⊘ This is a preview!⊘
Do you want full access?
Subscribe today to unlock all pages.
Trusted by 1+ million students worldwide
3DDM
intrinsic value is the dividend discount model and the company which is analysed is the
British American Tobacco. The company is listed in the FTSE Stock exchange and has been
paying dividends over 20 years.
The report tends to provide the rational for the use of dividend discount model and the
properties of this model in equity valuation. The various assumptions and estimates which are
used in the valuation of the company is also provided in the report.
Discussion:
Company Profile:
The company which is being analysed in this report is British American Tobacco
which is a leading company around the globe which provides and develops various products
made from Tobacco. The company is listed in the FTSE 100 index and has its business
operations which is from 1902. The company provides its goods to almost all the 6 continents
around the globe and employs 53000 individuals directly or indirectly.
The company is successful for its product which is cigarettes and has a portfolio of
some of the best brands which are consumed around the globe. The brands Dun Hill, Pall
Mall , Lucky Strike and Kent belongs to the company British American Tobacco and is the
second largest company in the tobacco industry around the globe. The company has changed
its business strategy to manufacture less harmful products than cigarettes but provides the
same level of satisfaction to the consumers. Thus the company has invested billions of dollars
in its research division for the new products which carry significant potential in the future.
The existing products of the company have a base of consumer’s loyalty which
provides a stable revenue for the company which the company would expand with its new
products. Thus upon analysing the business model of the company it seemed to be a matured
Paraphrase This Document
Need a fresh take? Get an instant paraphrase of this document with our AI Paraphraser
4DDM
company which can transition to the growth stage of a company with its new products. The
company has stable cash flows and provides dividends to the shareholders which make it
suitable for the valuation using the dividend discount model. The intrinsic value of the
company British American Tobacco would be calculated using the Dividend Discount Model
(www.bat.com 2020).
Suitability of the company for DDM:
The reason for which the company is suitable to be valued using the Dividend
Discount Model is provided in the following points.
The company is a mature company which is in the stable stage of operations and is
growing at a stable rate of growth.
The company has a history of paying dividends which acts as a benchmark for using
the dividend discount model of valuation.
The company is expected to pay dividends in the future, hence can be valued using
the dividend discount model
The high growth phase of the company is over and the growth rate of dividends is
expected to remain stable in the future.
Thus, DDM is used for the company due to the above reasons which makes the
valuation of the company with DDM suitable (Bao and Feng 2018).
Types of DDM:
The dividend discount model can be applied in different scenarios of growth rate
depending on the expectation of the growth rate of the company. The following are the
different types of dividend discount model in the following points.
The Zero Growth model is a dividend discount model where the growth rate of
dividend is taken to be 0%. This means the dividend is not expected to grow in the
5DDM
future and would remain the same for the life of the company. This model then values
the company by discounting with the required rate of return.
Price of Share= Dividend next Year
( Required Rate of Return )
The constant growth model of dividend discount model assumes that the dividend
would grow at a constant growth rate till the life of the company. The growth rate is
constant and there is no change to it, and the company is valued by discounting the
dividend by the difference between the required rate of return and constant growth
rate (Corelli 2017).
P rice of Share= Dividend this year∗( 1+Constant Growth Rate )
( Required Rate of Return−Constant Growth Rate )
Two stage or three stage Dividend Discount model is a model where different growth
rate of dividend are present, and the model needs to account for all the growth rate. In
such a scenario the dividend is forecasted using the high growth for the specific time
period, then assumed to become constant after the specific time period. Thus, the
initial high growth is incorporated in the dividend which is followed by the constant
growth. If more than two growth rate is provided then the three stage dividend
discount model is used for the valuation of the company.
P rice of Share= Dividend this year∗( 1+ Higher Growth Rate )n
(1+ Required rate of return )n +
( Dividend after n Years )∗( 1+Constant Growth
( Required Return−Contant Growth Rate
( 1+ Required Return )n
¿ ¿
H Model is a modification to the two stage or the three stage dividend discount model
for a certain limitation. The two stage or the three stage model assumes that the
growth rate of the dividend suddenly becomes constant, such that a high growth last
year becomes constant growth next year. This is a limitation of the two stage or the
⊘ This is a preview!⊘
Do you want full access?
Subscribe today to unlock all pages.
Trusted by 1+ million students worldwide
6DDM
three stage model which is removed when using the H model, which assumes that the
high growth rate gradually lowers down to the constant growth by decreasing by a
certain amount each year of the high growth period. Thus, it accounts for linearity in
the growth rate of dividend to estimate the intrinsic value of the share with a certain
point of accuracy (Dawar 2018).
P rice of Share= Dividend this year∗( 1+Constant Growth Rate )
( Required Rate of Return−Constant Growth Rate ) + ( Dividend this year )∗( Semi annual Period
Required Retu
Model for the Valuation of the Company:
The model which would be taken for the valuation of the company are two models
which are listed in the points below with their justification,
Constant Growth Model is taken as the first model for the valuation of the company
since the company is in the mature stage of business. The company pays dividend
which are stable and the company is expected to remain in the mature stage of
business where the dividends would increase at a constant growth rate till the life of
the company.
The H Model as the company has a long history of paying dividends and the initial
stage highlights the high growth rate at which the company used to pay dividend
which is observed in the later years to have fallen to a smaller growth rate. Thus the
company has gradually dropped its growth rate from a higher growth rate to a lower
growth rate however the drop has not been gradual but for the simplicity of the
valuation the drop is considered to take place at a constant pace over the years.
Paraphrase This Document
Need a fresh take? Get an instant paraphrase of this document with our AI Paraphraser
7DDM
Derivation of Dividend Growth Rate:
The growth rate of the dividend can be calculated in various ways and the growth rate
which seems to be likely in the real world scenario is taken in the calculation of the Dividend
Discount Model.
Average of Historical Growth Rates is a method where an average is taken for the
historical growth rates of the dividend. This provides an estimate of the growth rate of
the dividend for the company which is expected to prevail in the future and the
dividend of the company is expected to grow at this constant rate of growth.
Average Growth Rate= N years of dividend
N years
The compounded growth rate of dividend is used to calculate the growth rate of
dividend over the years from the 1st dividend which is paid by the company to the
latest dividend which is paid by the company.
CAGR=
( ( Dividend NthYear
Dividend 0Th Year ) 1
Nth
)−1
Thus the calculation of the growth rate is provided below using the actual dividend
figures which has been provided by the company and the formulas which have been provided
above (Florig, Ulrich and Schoemer 2019).
8DDM
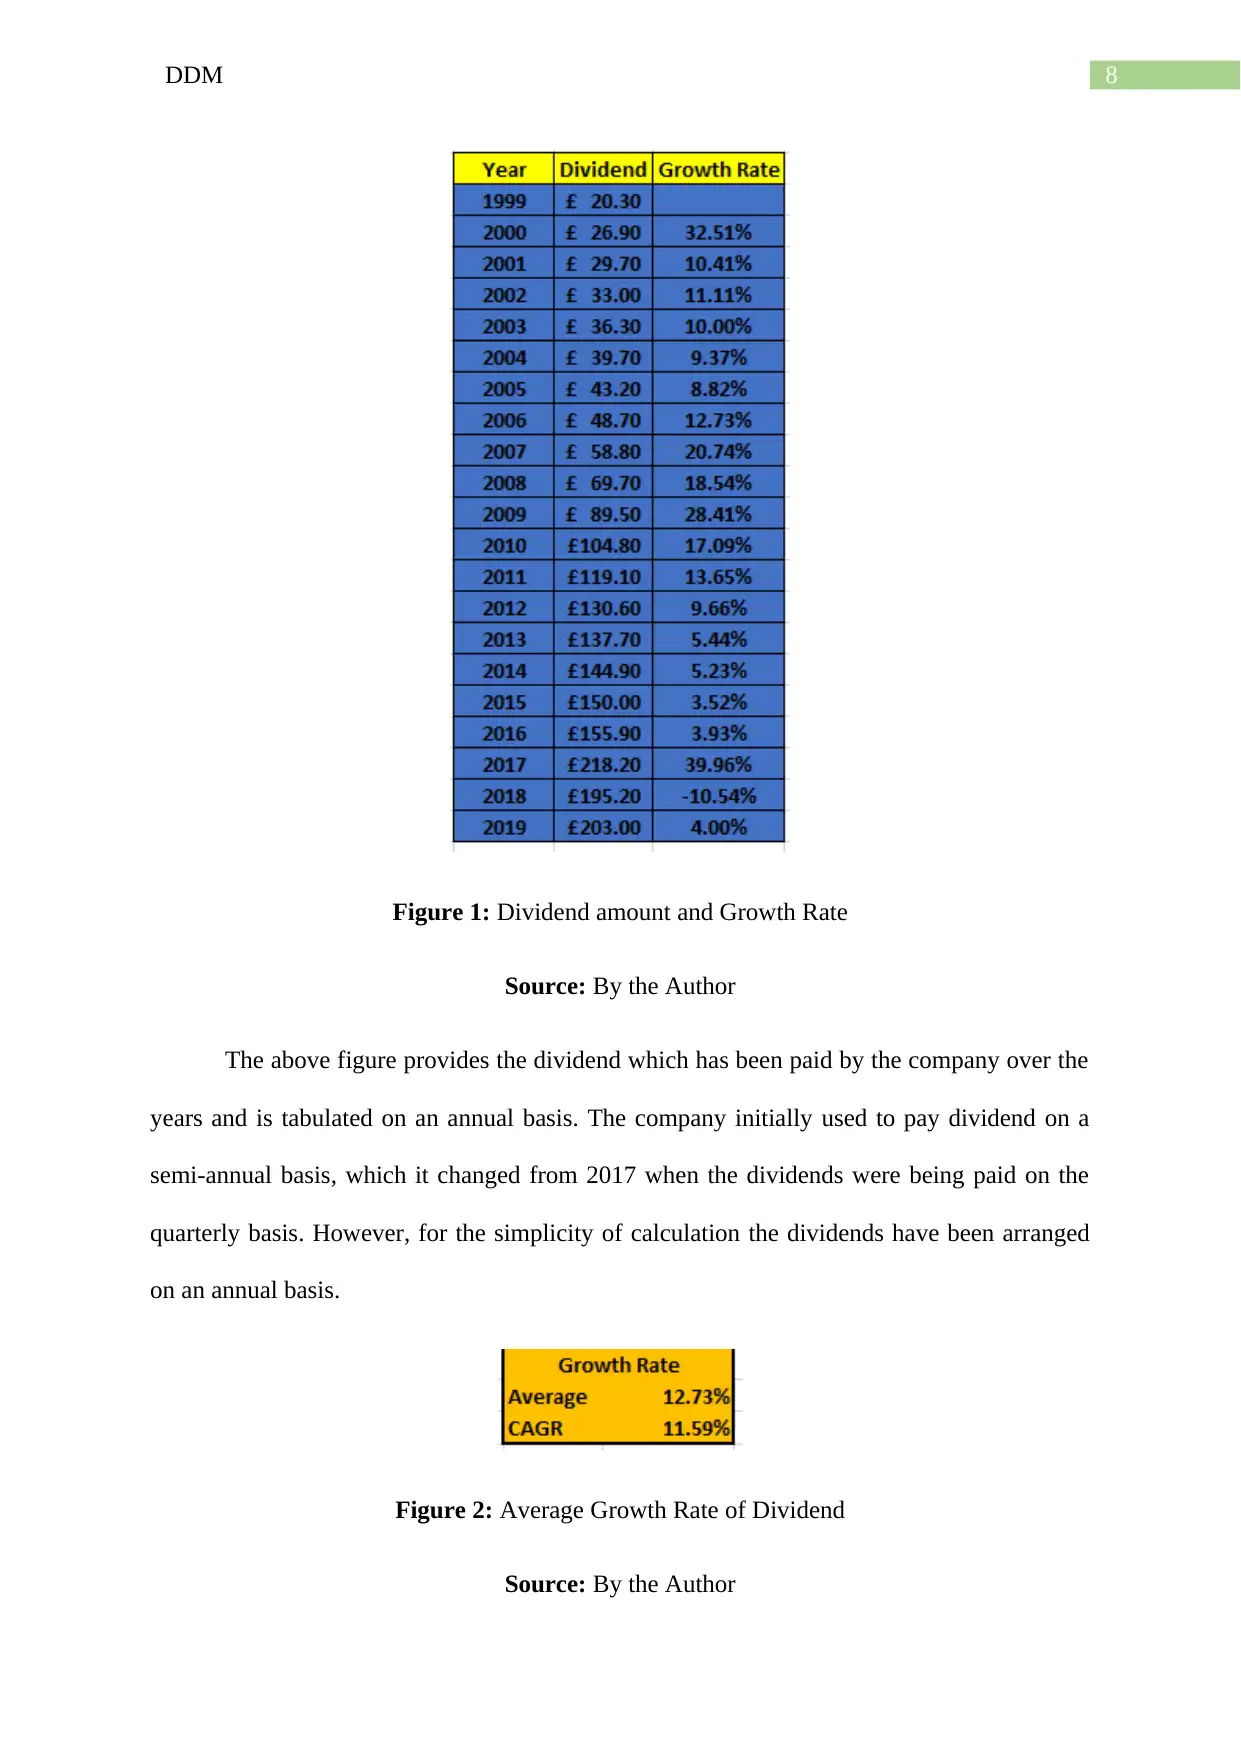
Figure 1: Dividend amount and Growth Rate
Source: By the Author
The above figure provides the dividend which has been paid by the company over the
years and is tabulated on an annual basis. The company initially used to pay dividend on a
semi-annual basis, which it changed from 2017 when the dividends were being paid on the
quarterly basis. However, for the simplicity of calculation the dividends have been arranged
on an annual basis.
Figure 2: Average Growth Rate of Dividend
Source: By the Author
⊘ This is a preview!⊘
Do you want full access?
Subscribe today to unlock all pages.
Trusted by 1+ million students worldwide
9DDM
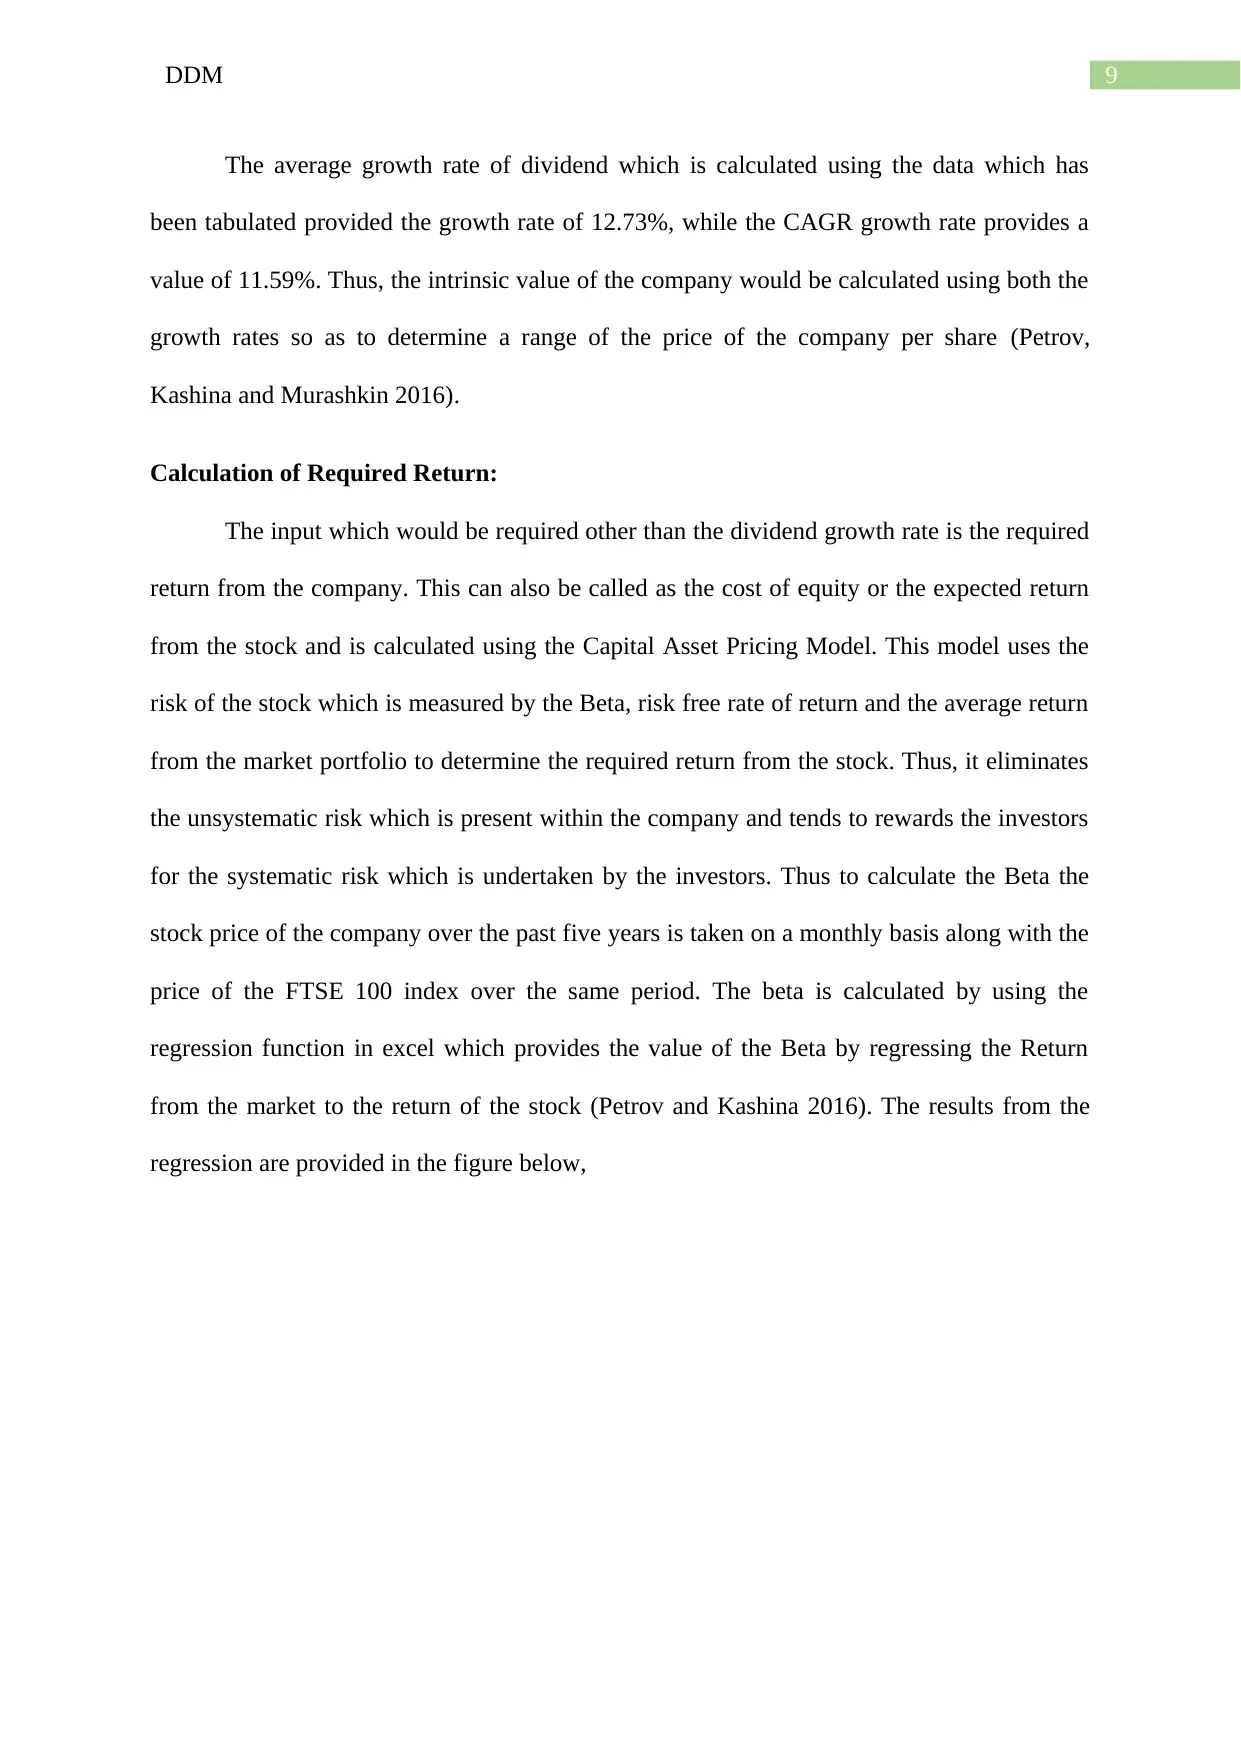
The average growth rate of dividend which is calculated using the data which has
been tabulated provided the growth rate of 12.73%, while the CAGR growth rate provides a
value of 11.59%. Thus, the intrinsic value of the company would be calculated using both the
growth rates so as to determine a range of the price of the company per share (Petrov,
Kashina and Murashkin 2016).
Calculation of Required Return:
The input which would be required other than the dividend growth rate is the required
return from the company. This can also be called as the cost of equity or the expected return
from the stock and is calculated using the Capital Asset Pricing Model. This model uses the
risk of the stock which is measured by the Beta, risk free rate of return and the average return
from the market portfolio to determine the required return from the stock. Thus, it eliminates
the unsystematic risk which is present within the company and tends to rewards the investors
for the systematic risk which is undertaken by the investors. Thus to calculate the Beta the
stock price of the company over the past five years is taken on a monthly basis along with the
price of the FTSE 100 index over the same period. The beta is calculated by using the
regression function in excel which provides the value of the Beta by regressing the Return
from the market to the return of the stock (Petrov and Kashina 2016). The results from the
regression are provided in the figure below,
Paraphrase This Document
Need a fresh take? Get an instant paraphrase of this document with our AI Paraphraser
10DDM
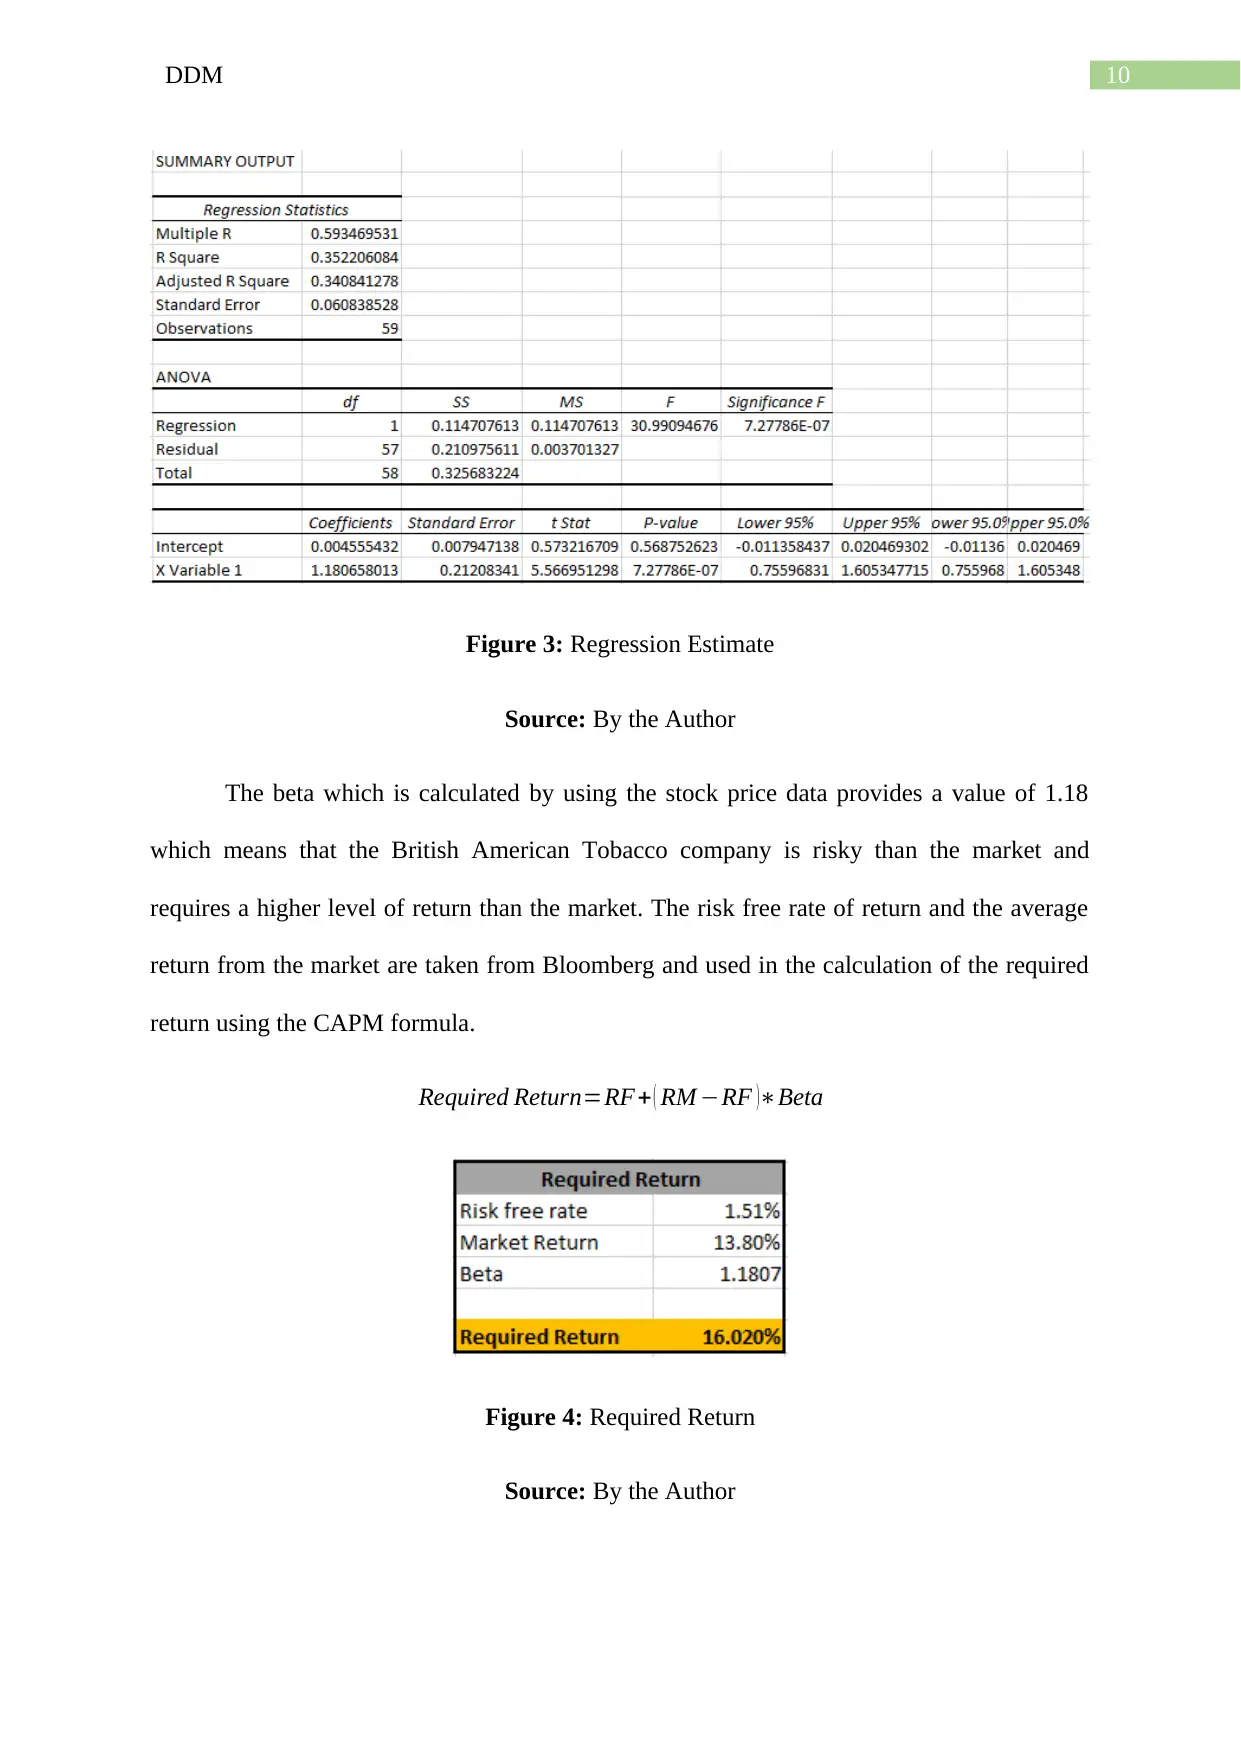
Figure 3: Regression Estimate
Source: By the Author
The beta which is calculated by using the stock price data provides a value of 1.18
which means that the British American Tobacco company is risky than the market and
requires a higher level of return than the market. The risk free rate of return and the average
return from the market are taken from Bloomberg and used in the calculation of the required
return using the CAPM formula.
Required Return=RF+ ( RM −RF )∗Beta
Figure 4: Required Return
Source: By the Author
11DDM
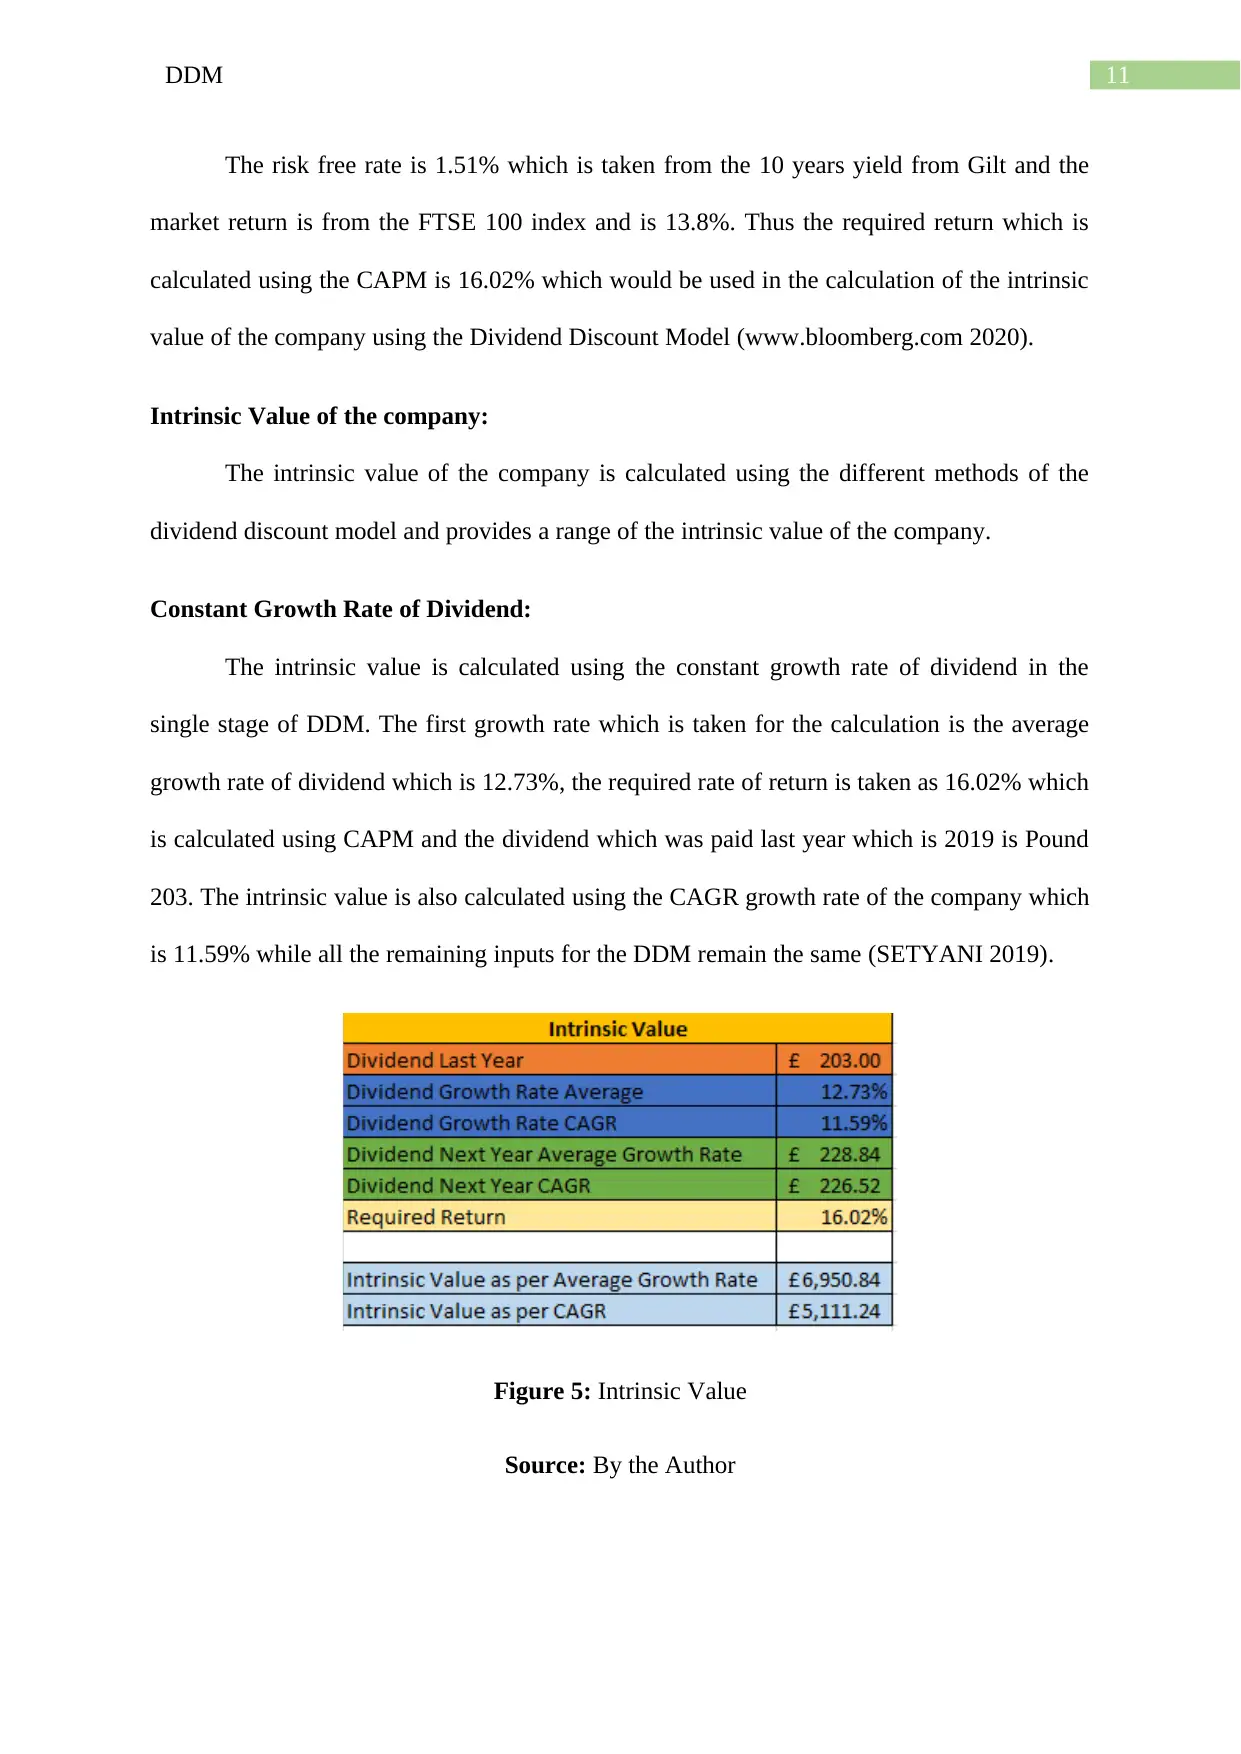
The risk free rate is 1.51% which is taken from the 10 years yield from Gilt and the
market return is from the FTSE 100 index and is 13.8%. Thus the required return which is
calculated using the CAPM is 16.02% which would be used in the calculation of the intrinsic
value of the company using the Dividend Discount Model (www.bloomberg.com 2020).
Intrinsic Value of the company:
The intrinsic value of the company is calculated using the different methods of the
dividend discount model and provides a range of the intrinsic value of the company.
Constant Growth Rate of Dividend:
The intrinsic value is calculated using the constant growth rate of dividend in the
single stage of DDM. The first growth rate which is taken for the calculation is the average
growth rate of dividend which is 12.73%, the required rate of return is taken as 16.02% which
is calculated using CAPM and the dividend which was paid last year which is 2019 is Pound
203. The intrinsic value is also calculated using the CAGR growth rate of the company which
is 11.59% while all the remaining inputs for the DDM remain the same (SETYANI 2019).
Figure 5: Intrinsic Value
Source: By the Author
⊘ This is a preview!⊘
Do you want full access?
Subscribe today to unlock all pages.
Trusted by 1+ million students worldwide
1 out of 17
Related Documents


Your All-in-One AI-Powered Toolkit for Academic Success.
+13062052269
info@desklib.com
Available 24*7 on WhatsApp / Email
![[object Object]](/_next/static/media/star-bottom.7253800d.svg)
Unlock your academic potential
Copyright © 2020–2026 A2Z Services. All Rights Reserved. Developed and managed by ZUCOL.