Equity and Mutual Fund Analysis
VerifiedAdded on 2020/07/22
|12
|3113
|67
AI Summary
This assignment involves analyzing the performance of various equities (Bega Cheese Limited, Bluescope Steel Limited, Caltex Australia, DuluxGroup) and a fixed interest fund (Bank of Queensland). The actual return percentages are calculated and compared with expected returns. Based on this analysis, recommendations are made for asset allocation among young people who can bear capital risk and older individuals seeking security. A summary is provided to understand the key takeaways from the assignment.
Contribute Materials
Your contribution can guide someone’s learning journey. Share your
documents today.
THE INVESTMENT PROCESS AND ITS
APPLICATION TO YOUNG FAMILIES AND
TO RETIREES
APPLICATION TO YOUNG FAMILIES AND
TO RETIREES
Secure Best Marks with AI Grader
Need help grading? Try our AI Grader for instant feedback on your assignments.
TABLE OF CONTENTS
INTRODUCTION...........................................................................................................................1
.....................................................................................................................................................1
Investment process...........................................................................................................................1
Different investment avenues and risk as well as return profile......................................................2
Analysis...........................................................................................................................................3
Portfolio for 35 year old client.....................................................................................................3
Portfolio for 65 year old retire person.........................................................................................6
Conclusion and recommendation..................................................................................................10
REFERENCES..............................................................................................................................11
Table 1Investment proportion for client that is 35 year old............................................................3
Table 2Input data of firms...............................................................................................................4
Table 3Weight and expected return table........................................................................................4
Table 4Total capital gain in equity..................................................................................................4
Table 5Mutual fund performance....................................................................................................5
Table 6Fixed deposit performance..................................................................................................5
Table 7Overall capital gain..............................................................................................................5
Table 8Calculation of expected return by using CAPM Model......................................................5
Table 9Investment amount..............................................................................................................7
Table 10Information related to firms included in portfolio.............................................................7
Table 11Expected return and weight of stock.................................................................................7
Table 12Total capital gain on stocks...............................................................................................7
Table 13Calculation of required rate of return by using CAPM model..........................................8
Table 14Mutual fund portfolio........................................................................................................8
Table 15Fixed interest.....................................................................................................................9
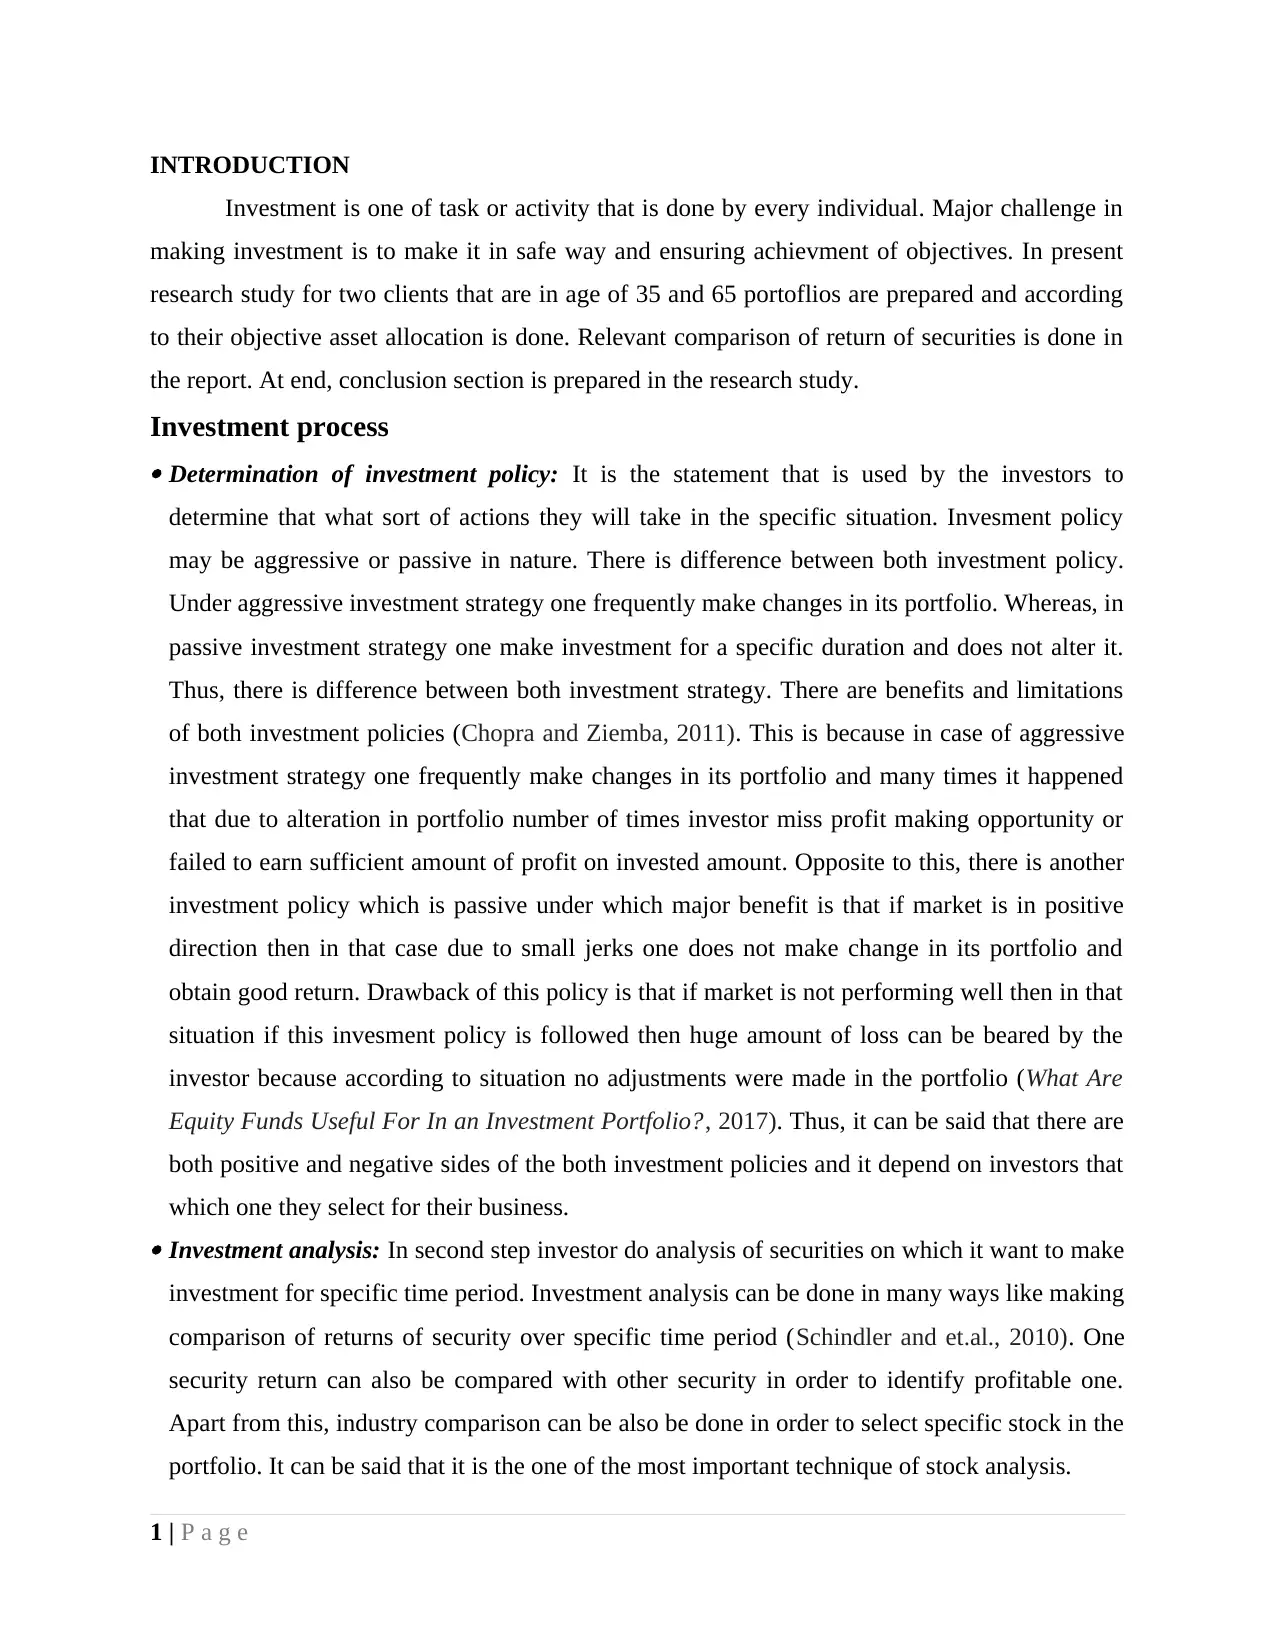
INTRODUCTION
Investment is one of task or activity that is done by every individual. Major challenge in
making investment is to make it in safe way and ensuring achievment of objectives. In present
research study for two clients that are in age of 35 and 65 portoflios are prepared and according
to their objective asset allocation is done. Relevant comparison of return of securities is done in
the report. At end, conclusion section is prepared in the research study.
Investment process Determination of investment policy: It is the statement that is used by the investors to
determine that what sort of actions they will take in the specific situation. Invesment policy
may be aggressive or passive in nature. There is difference between both investment policy.
Under aggressive investment strategy one frequently make changes in its portfolio. Whereas, in
passive investment strategy one make investment for a specific duration and does not alter it.
Thus, there is difference between both investment strategy. There are benefits and limitations
of both investment policies (Chopra and Ziemba, 2011). This is because in case of aggressive
investment strategy one frequently make changes in its portfolio and many times it happened
that due to alteration in portfolio number of times investor miss profit making opportunity or
failed to earn sufficient amount of profit on invested amount. Opposite to this, there is another
investment policy which is passive under which major benefit is that if market is in positive
direction then in that case due to small jerks one does not make change in its portfolio and
obtain good return. Drawback of this policy is that if market is not performing well then in that
situation if this invesment policy is followed then huge amount of loss can be beared by the
investor because according to situation no adjustments were made in the portfolio (What Are
Equity Funds Useful For In an Investment Portfolio?, 2017). Thus, it can be said that there are
both positive and negative sides of the both investment policies and it depend on investors that
which one they select for their business. Investment analysis: In second step investor do analysis of securities on which it want to make
investment for specific time period. Investment analysis can be done in many ways like making
comparison of returns of security over specific time period (Schindler and et.al., 2010). One
security return can also be compared with other security in order to identify profitable one.
Apart from this, industry comparison can be also be done in order to select specific stock in the
portfolio. It can be said that it is the one of the most important technique of stock analysis.
1 | P a g e
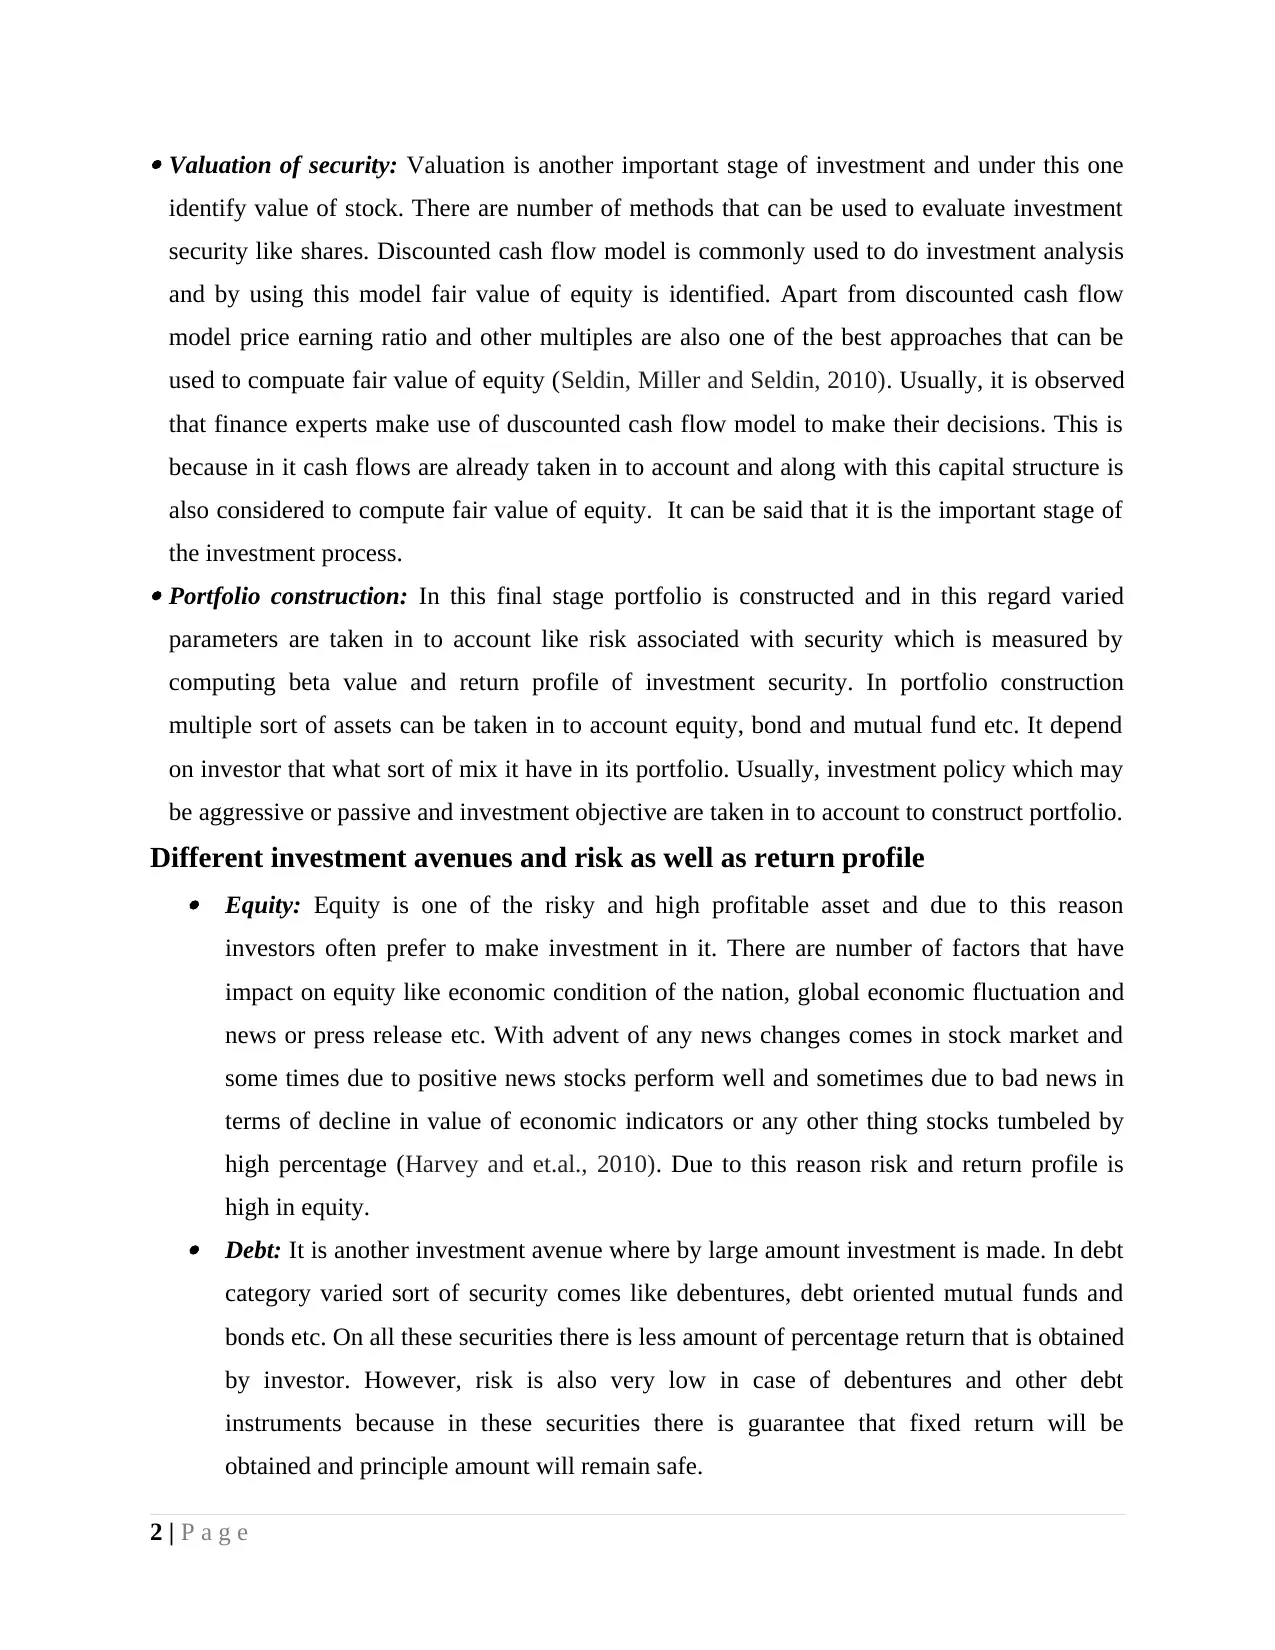
Valuation of security: Valuation is another important stage of investment and under this one
identify value of stock. There are number of methods that can be used to evaluate investment
security like shares. Discounted cash flow model is commonly used to do investment analysis
and by using this model fair value of equity is identified. Apart from discounted cash flow
model price earning ratio and other multiples are also one of the best approaches that can be
used to compuate fair value of equity (Seldin, Miller and Seldin, 2010). Usually, it is observed
that finance experts make use of duscounted cash flow model to make their decisions. This is
because in it cash flows are already taken in to account and along with this capital structure is
also considered to compute fair value of equity. It can be said that it is the important stage of
the investment process. Portfolio construction: In this final stage portfolio is constructed and in this regard varied
parameters are taken in to account like risk associated with security which is measured by
computing beta value and return profile of investment security. In portfolio construction
multiple sort of assets can be taken in to account equity, bond and mutual fund etc. It depend
on investor that what sort of mix it have in its portfolio. Usually, investment policy which may
be aggressive or passive and investment objective are taken in to account to construct portfolio.
Different investment avenues and risk as well as return profile Equity: Equity is one of the risky and high profitable asset and due to this reason
investors often prefer to make investment in it. There are number of factors that have
impact on equity like economic condition of the nation, global economic fluctuation and
news or press release etc. With advent of any news changes comes in stock market and
some times due to positive news stocks perform well and sometimes due to bad news in
terms of decline in value of economic indicators or any other thing stocks tumbeled by
high percentage (Harvey and et.al., 2010). Due to this reason risk and return profile is
high in equity. Debt: It is another investment avenue where by large amount investment is made. In debt
category varied sort of security comes like debentures, debt oriented mutual funds and
bonds etc. On all these securities there is less amount of percentage return that is obtained
by investor. However, risk is also very low in case of debentures and other debt
instruments because in these securities there is guarantee that fixed return will be
obtained and principle amount will remain safe.
2 | P a g e
Secure Best Marks with AI Grader
Need help grading? Try our AI Grader for instant feedback on your assignments.
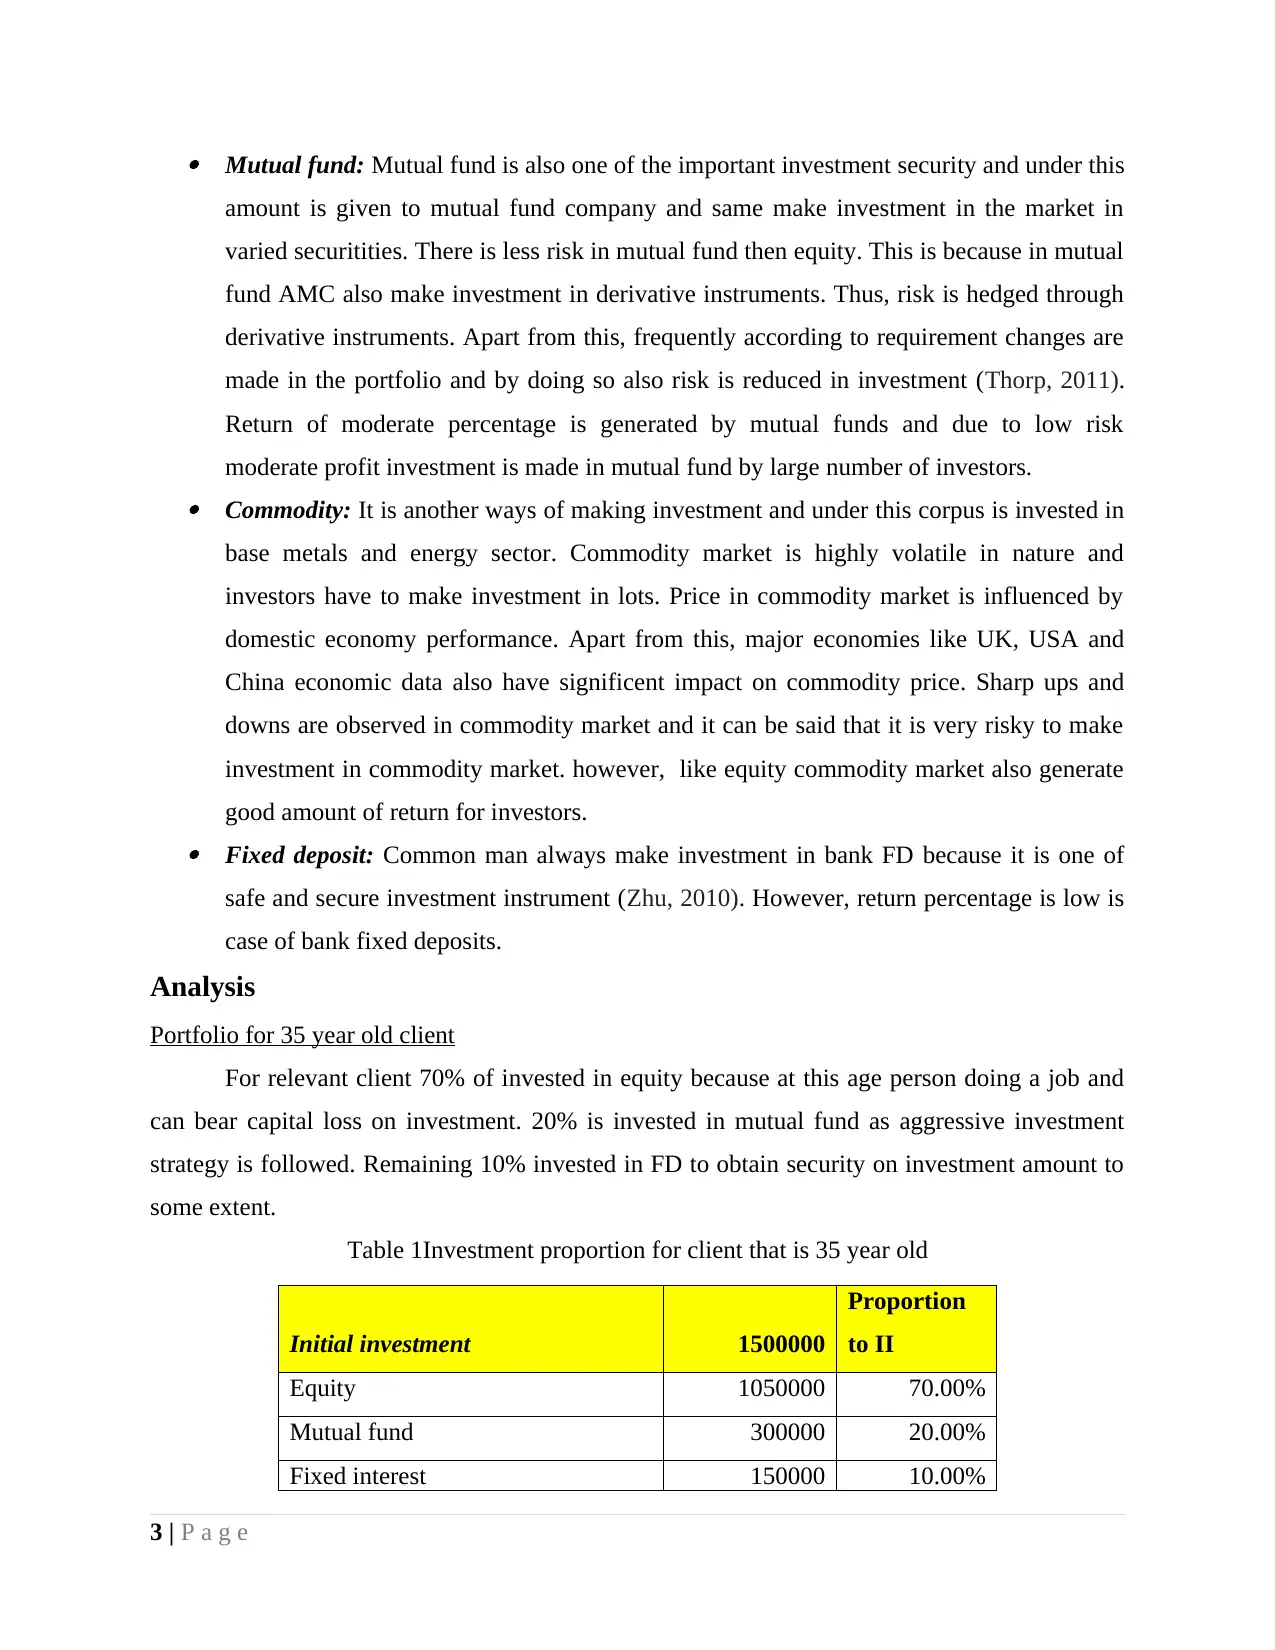
Mutual fund: Mutual fund is also one of the important investment security and under this
amount is given to mutual fund company and same make investment in the market in
varied securitities. There is less risk in mutual fund then equity. This is because in mutual
fund AMC also make investment in derivative instruments. Thus, risk is hedged through
derivative instruments. Apart from this, frequently according to requirement changes are
made in the portfolio and by doing so also risk is reduced in investment (Thorp, 2011).
Return of moderate percentage is generated by mutual funds and due to low risk
moderate profit investment is made in mutual fund by large number of investors. Commodity: It is another ways of making investment and under this corpus is invested in
base metals and energy sector. Commodity market is highly volatile in nature and
investors have to make investment in lots. Price in commodity market is influenced by
domestic economy performance. Apart from this, major economies like UK, USA and
China economic data also have significent impact on commodity price. Sharp ups and
downs are observed in commodity market and it can be said that it is very risky to make
investment in commodity market. however, like equity commodity market also generate
good amount of return for investors. Fixed deposit: Common man always make investment in bank FD because it is one of
safe and secure investment instrument (Zhu, 2010). However, return percentage is low is
case of bank fixed deposits.
Analysis
Portfolio for 35 year old client
For relevant client 70% of invested in equity because at this age person doing a job and
can bear capital loss on investment. 20% is invested in mutual fund as aggressive investment
strategy is followed. Remaining 10% invested in FD to obtain security on investment amount to
some extent.
Table 1Investment proportion for client that is 35 year old
Initial investment 1500000
Proportion
to II
Equity 1050000 70.00%
Mutual fund 300000 20.00%
Fixed interest 150000 10.00%
3 | P a g e
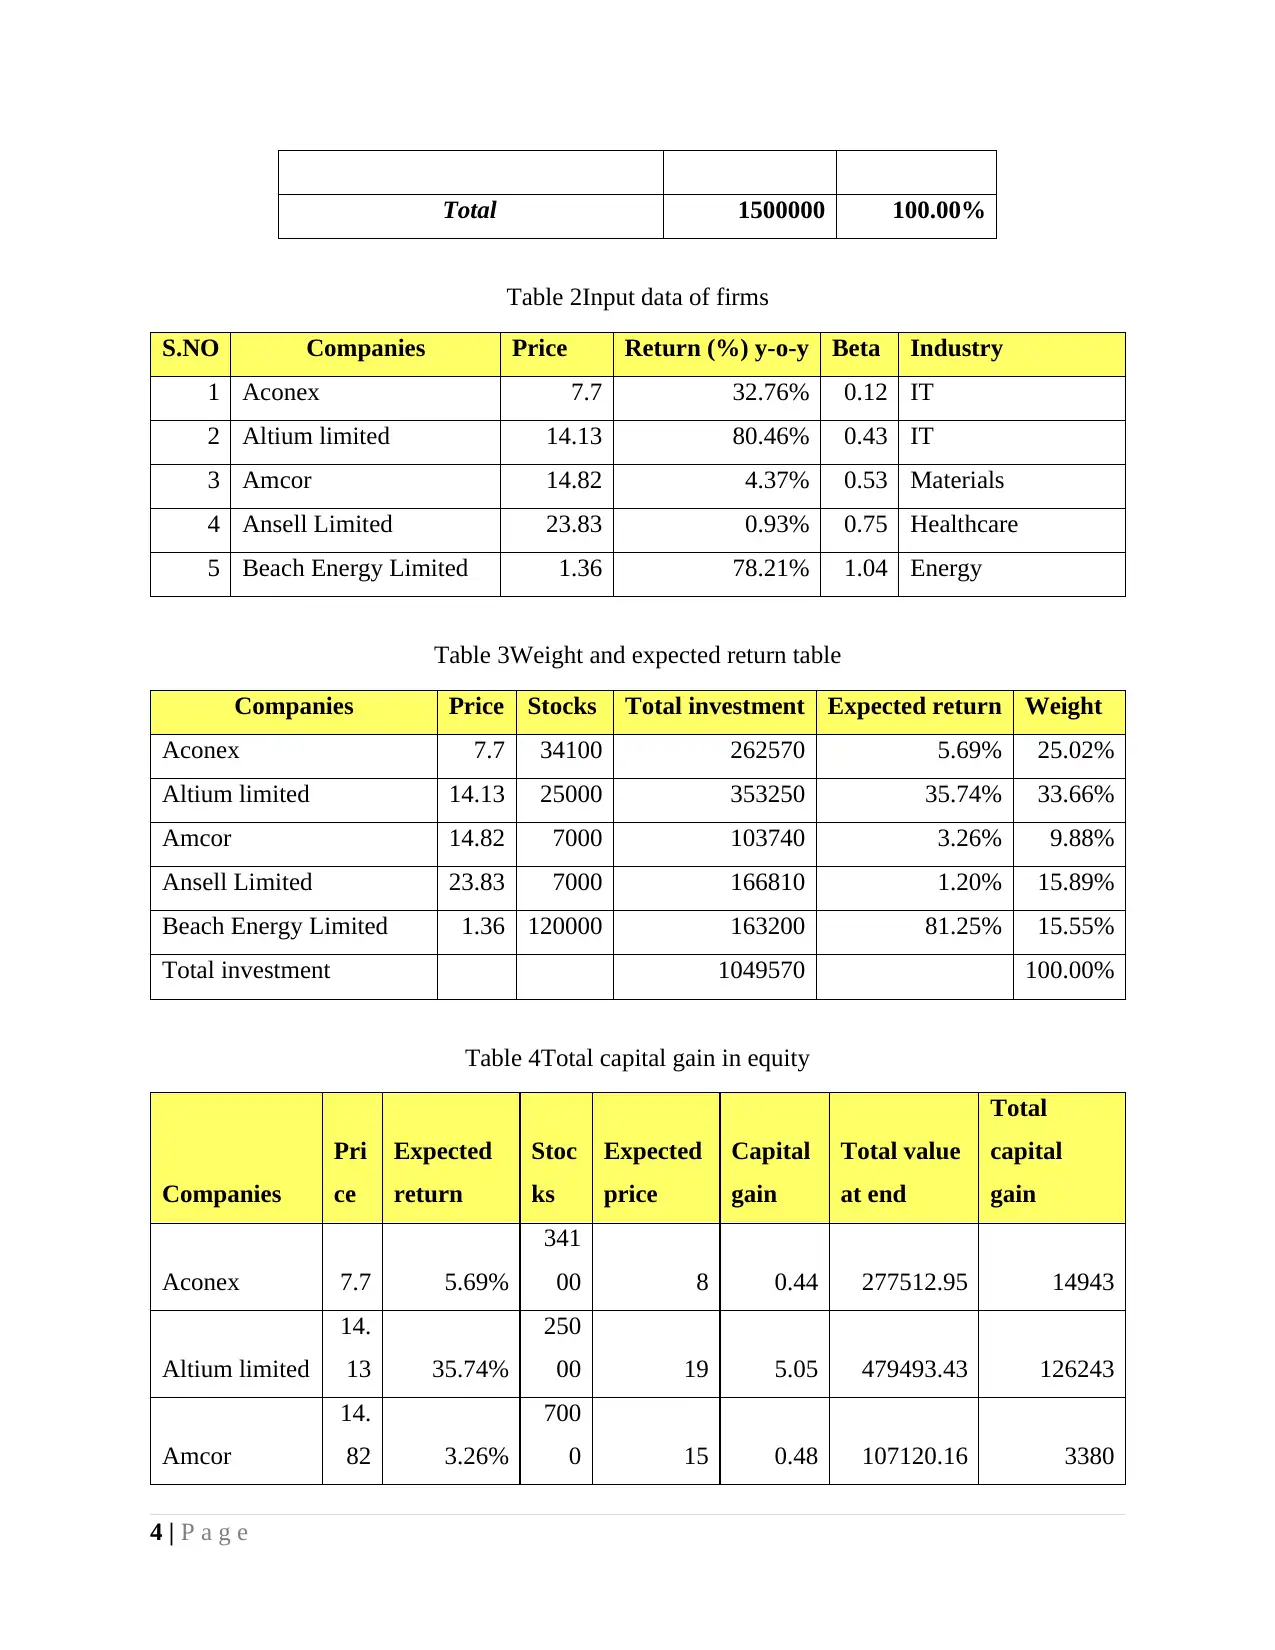
Total 1500000 100.00%
Table 2Input data of firms
S.NO Companies Price Return (%) y-o-y Beta Industry
1 Aconex 7.7 32.76% 0.12 IT
2 Altium limited 14.13 80.46% 0.43 IT
3 Amcor 14.82 4.37% 0.53 Materials
4 Ansell Limited 23.83 0.93% 0.75 Healthcare
5 Beach Energy Limited 1.36 78.21% 1.04 Energy
Table 3Weight and expected return table
Companies Price Stocks Total investment Expected return Weight
Aconex 7.7 34100 262570 5.69% 25.02%
Altium limited 14.13 25000 353250 35.74% 33.66%
Amcor 14.82 7000 103740 3.26% 9.88%
Ansell Limited 23.83 7000 166810 1.20% 15.89%
Beach Energy Limited 1.36 120000 163200 81.25% 15.55%
Total investment 1049570 100.00%
Table 4Total capital gain in equity
Companies
Pri
ce
Expected
return
Stoc
ks
Expected
price
Capital
gain
Total value
at end
Total
capital
gain
Aconex 7.7 5.69%
341
00 8 0.44 277512.95 14943
Altium limited
14.
13 35.74%
250
00 19 5.05 479493.43 126243
Amcor
14.
82 3.26%
700
0 15 0.48 107120.16 3380
4 | P a g e
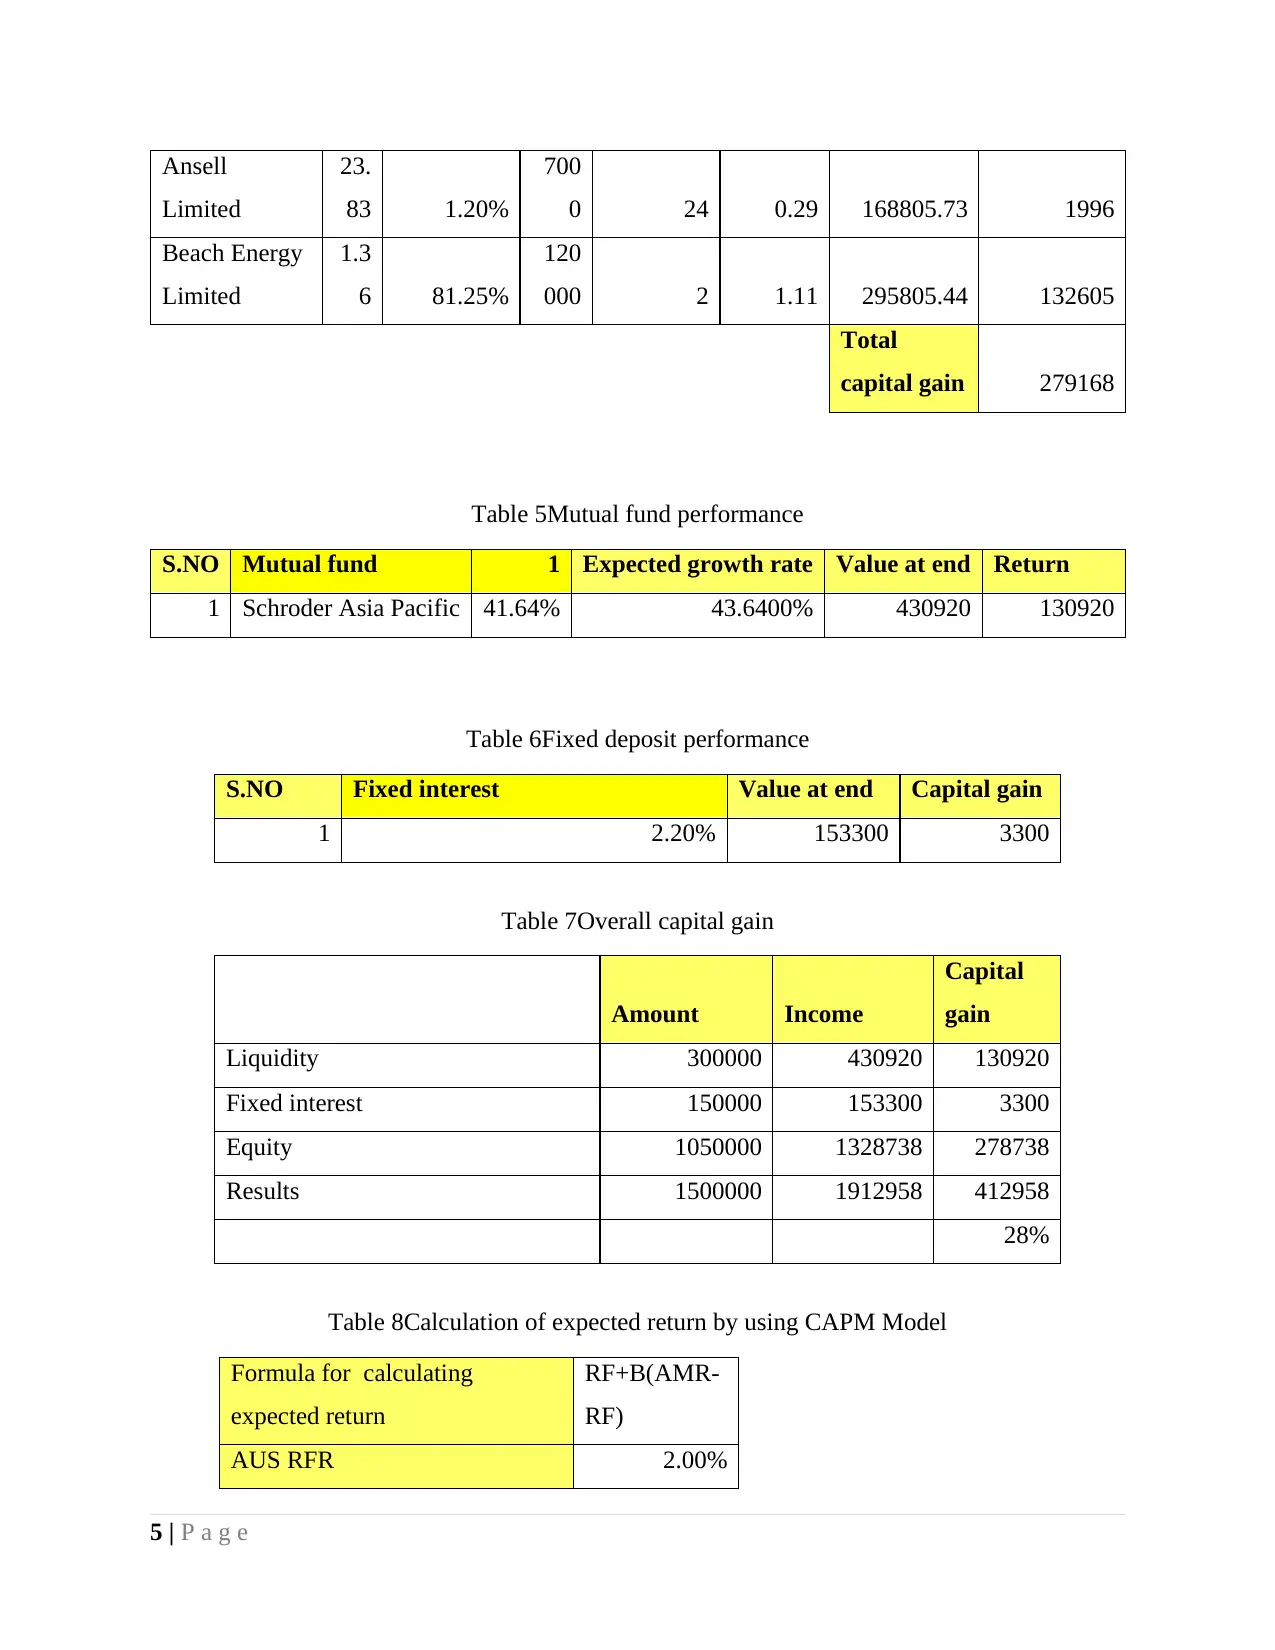
Ansell
Limited
23.
83 1.20%
700
0 24 0.29 168805.73 1996
Beach Energy
Limited
1.3
6 81.25%
120
000 2 1.11 295805.44 132605
Total
capital gain 279168
Table 5Mutual fund performance
S.NO Mutual fund 1 Expected growth rate Value at end Return
1 Schroder Asia Pacific 41.64% 43.6400% 430920 130920
Table 6Fixed deposit performance
S.NO Fixed interest Value at end Capital gain
1 2.20% 153300 3300
Table 7Overall capital gain
Amount Income
Capital
gain
Liquidity 300000 430920 130920
Fixed interest 150000 153300 3300
Equity 1050000 1328738 278738
Results 1500000 1912958 412958
28%
Table 8Calculation of expected return by using CAPM Model
Formula for calculating
expected return
RF+B(AMR-
RF)
AUS RFR 2.00%
5 | P a g e
Limited
23.
83 1.20%
700
0 24 0.29 168805.73 1996
Beach Energy
Limited
1.3
6 81.25%
120
000 2 1.11 295805.44 132605
Total
capital gain 279168
Table 5Mutual fund performance
S.NO Mutual fund 1 Expected growth rate Value at end Return
1 Schroder Asia Pacific 41.64% 43.6400% 430920 130920
Table 6Fixed deposit performance
S.NO Fixed interest Value at end Capital gain
1 2.20% 153300 3300
Table 7Overall capital gain
Amount Income
Capital
gain
Liquidity 300000 430920 130920
Fixed interest 150000 153300 3300
Equity 1050000 1328738 278738
Results 1500000 1912958 412958
28%
Table 8Calculation of expected return by using CAPM Model
Formula for calculating
expected return
RF+B(AMR-
RF)
AUS RFR 2.00%
5 | P a g e
Paraphrase This Document
Need a fresh take? Get an instant paraphrase of this document with our AI Paraphraser
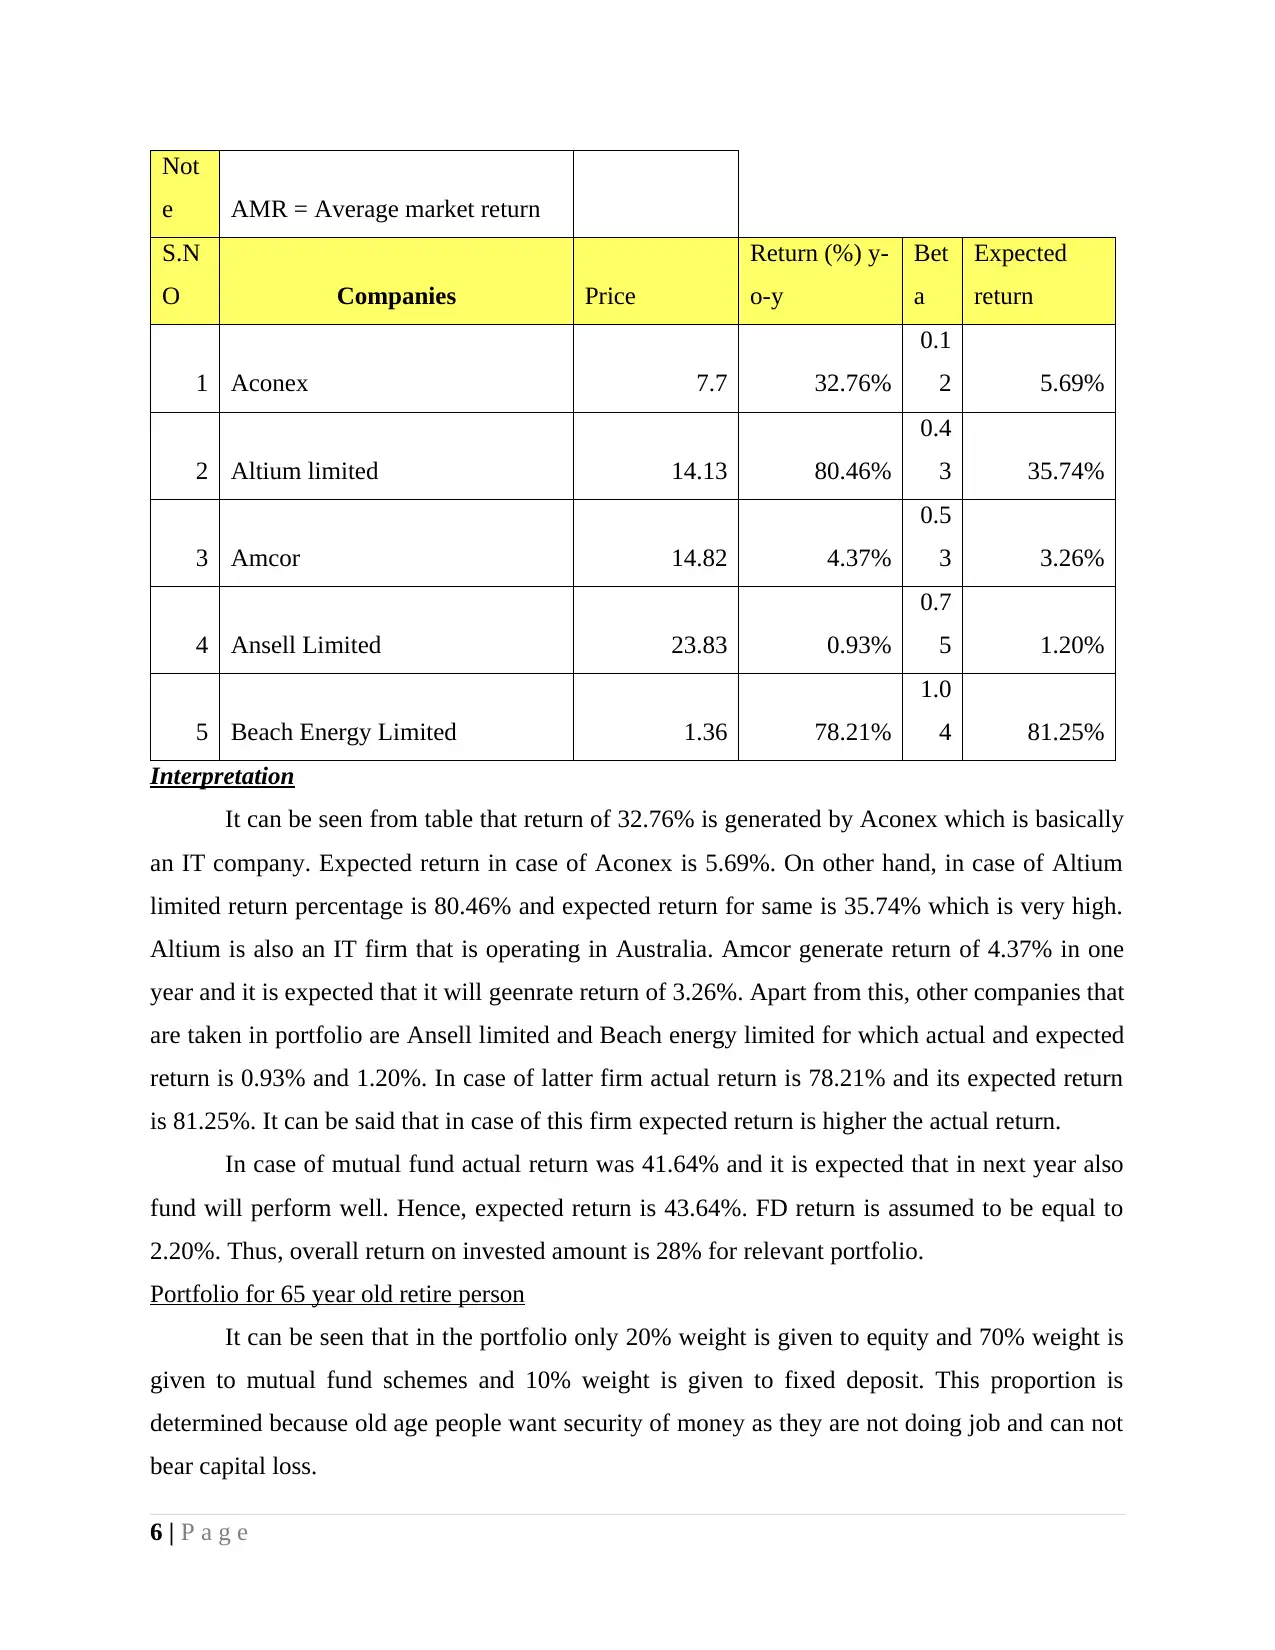
Not
e AMR = Average market return
S.N
O Companies Price
Return (%) y-
o-y
Bet
a
Expected
return
1 Aconex 7.7 32.76%
0.1
2 5.69%
2 Altium limited 14.13 80.46%
0.4
3 35.74%
3 Amcor 14.82 4.37%
0.5
3 3.26%
4 Ansell Limited 23.83 0.93%
0.7
5 1.20%
5 Beach Energy Limited 1.36 78.21%
1.0
4 81.25%
Interpretation
It can be seen from table that return of 32.76% is generated by Aconex which is basically
an IT company. Expected return in case of Aconex is 5.69%. On other hand, in case of Altium
limited return percentage is 80.46% and expected return for same is 35.74% which is very high.
Altium is also an IT firm that is operating in Australia. Amcor generate return of 4.37% in one
year and it is expected that it will geenrate return of 3.26%. Apart from this, other companies that
are taken in portfolio are Ansell limited and Beach energy limited for which actual and expected
return is 0.93% and 1.20%. In case of latter firm actual return is 78.21% and its expected return
is 81.25%. It can be said that in case of this firm expected return is higher the actual return.
In case of mutual fund actual return was 41.64% and it is expected that in next year also
fund will perform well. Hence, expected return is 43.64%. FD return is assumed to be equal to
2.20%. Thus, overall return on invested amount is 28% for relevant portfolio.
Portfolio for 65 year old retire person
It can be seen that in the portfolio only 20% weight is given to equity and 70% weight is
given to mutual fund schemes and 10% weight is given to fixed deposit. This proportion is
determined because old age people want security of money as they are not doing job and can not
bear capital loss.
6 | P a g e
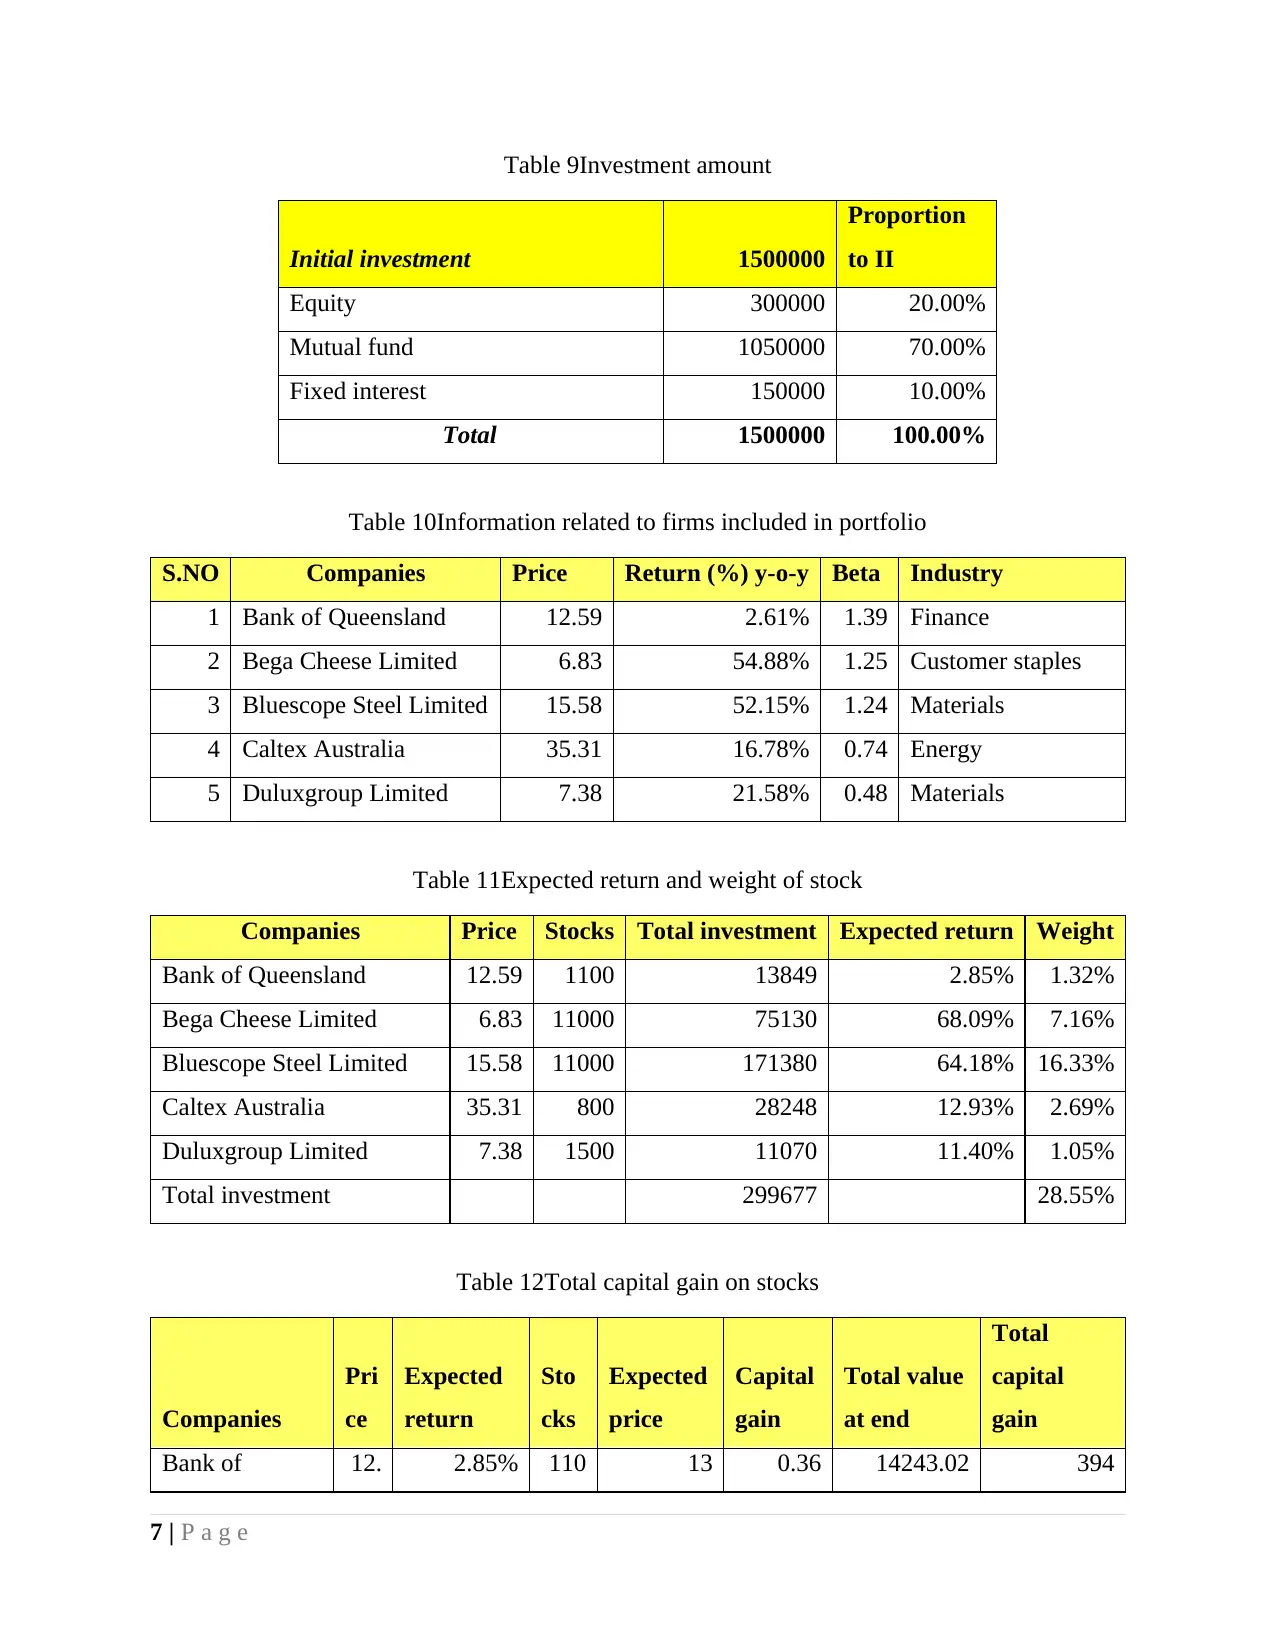
Table 9Investment amount
Initial investment 1500000
Proportion
to II
Equity 300000 20.00%
Mutual fund 1050000 70.00%
Fixed interest 150000 10.00%
Total 1500000 100.00%
Table 10Information related to firms included in portfolio
S.NO Companies Price Return (%) y-o-y Beta Industry
1 Bank of Queensland 12.59 2.61% 1.39 Finance
2 Bega Cheese Limited 6.83 54.88% 1.25 Customer staples
3 Bluescope Steel Limited 15.58 52.15% 1.24 Materials
4 Caltex Australia 35.31 16.78% 0.74 Energy
5 Duluxgroup Limited 7.38 21.58% 0.48 Materials
Table 11Expected return and weight of stock
Companies Price Stocks Total investment Expected return Weight
Bank of Queensland 12.59 1100 13849 2.85% 1.32%
Bega Cheese Limited 6.83 11000 75130 68.09% 7.16%
Bluescope Steel Limited 15.58 11000 171380 64.18% 16.33%
Caltex Australia 35.31 800 28248 12.93% 2.69%
Duluxgroup Limited 7.38 1500 11070 11.40% 1.05%
Total investment 299677 28.55%
Table 12Total capital gain on stocks
Companies
Pri
ce
Expected
return
Sto
cks
Expected
price
Capital
gain
Total value
at end
Total
capital
gain
Bank of 12. 2.85% 110 13 0.36 14243.02 394
7 | P a g e
Queensland 59 0
Bega Cheese
Limited
6.8
3 68.09%
110
00 11 4.65 126289.10 51159
Bluescope Steel
Limited
15.
58 64.18%
110
00 26 10.00 281378.65 109999
Caltex
Australia
35.
31 12.93% 800 40 4.57 31901.73 3654
Duluxgroup
Limited
7.3
8 11.40%
150
0 8 0.84 12331.89 1262
Total
capital gain 166467
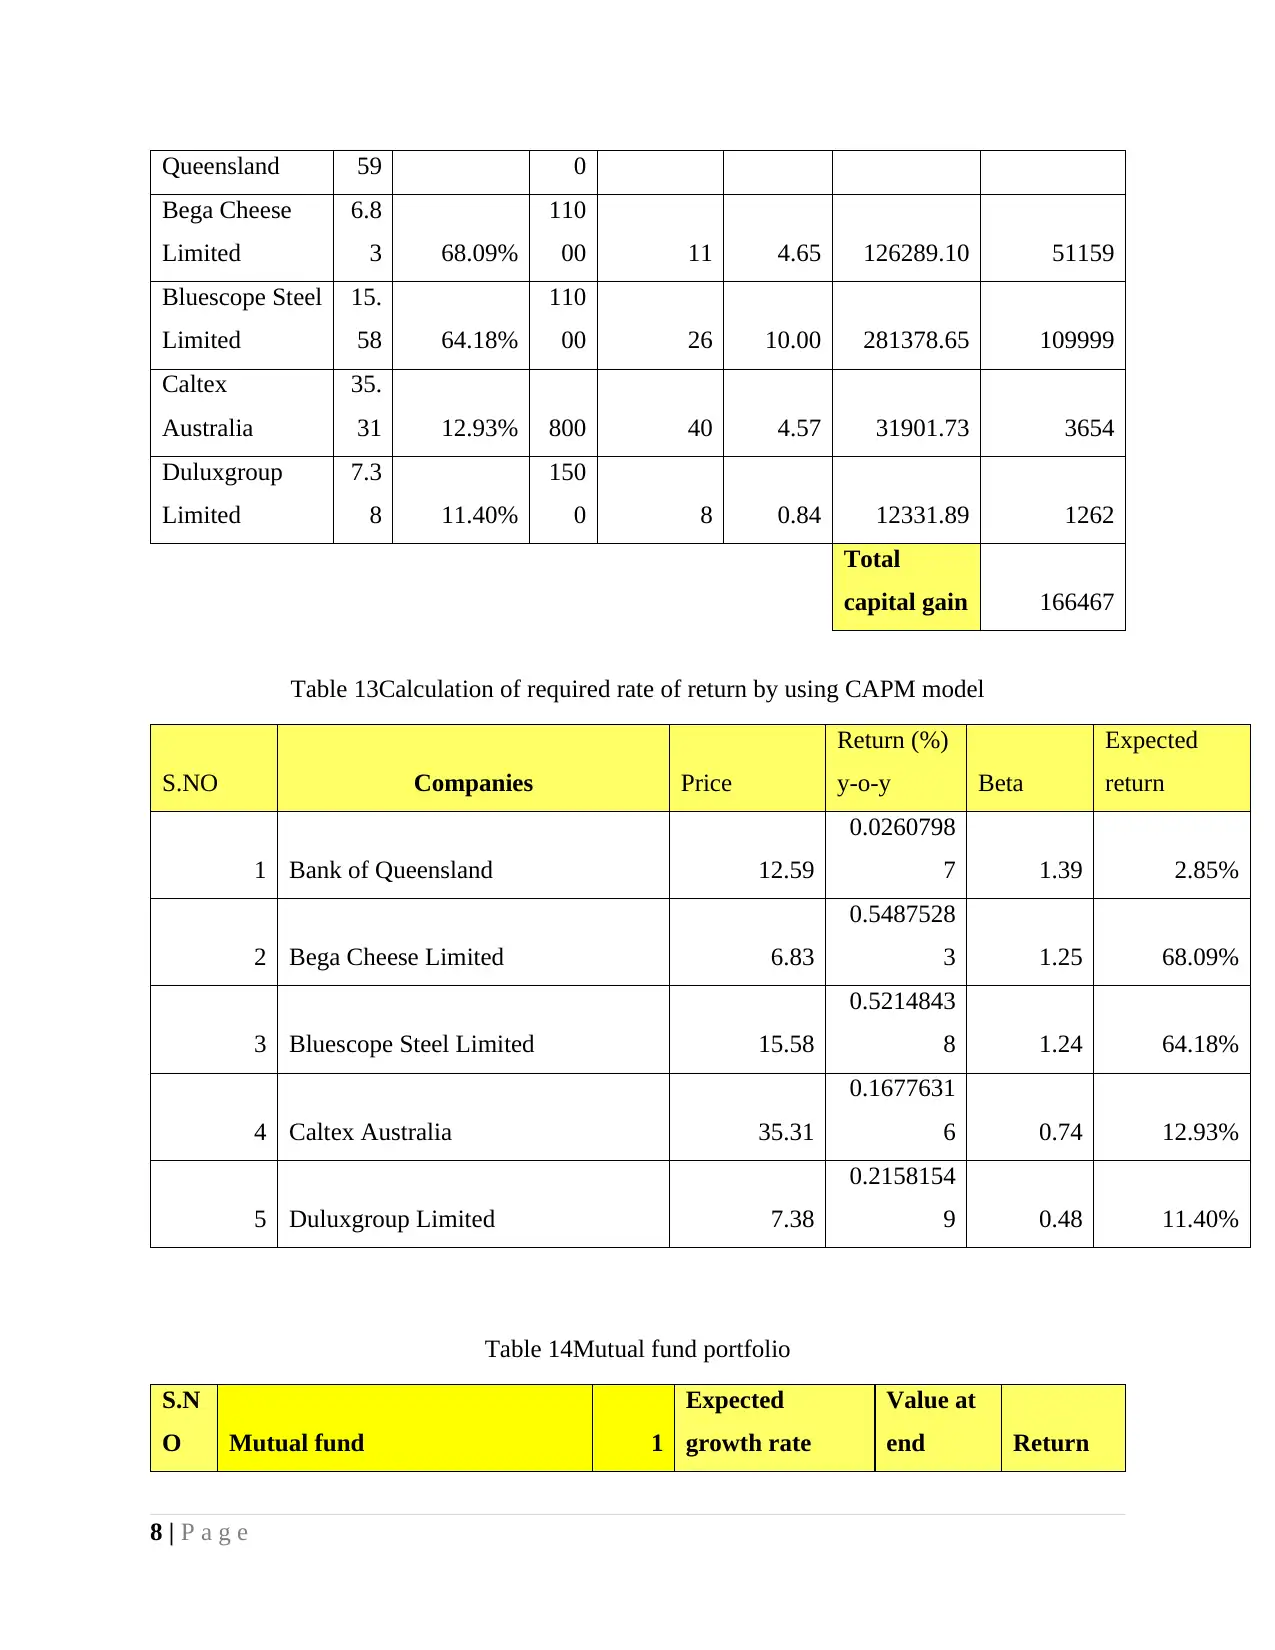
Table 13Calculation of required rate of return by using CAPM model
S.NO Companies Price
Return (%)
y-o-y Beta
Expected
return
1 Bank of Queensland 12.59
0.0260798
7 1.39 2.85%
2 Bega Cheese Limited 6.83
0.5487528
3 1.25 68.09%
3 Bluescope Steel Limited 15.58
0.5214843
8 1.24 64.18%
4 Caltex Australia 35.31
0.1677631
6 0.74 12.93%
5 Duluxgroup Limited 7.38
0.2158154
9 0.48 11.40%
Table 14Mutual fund portfolio
S.N
O Mutual fund 1
Expected
growth rate
Value at
end Return
8 | P a g e
Bega Cheese
Limited
6.8
3 68.09%
110
00 11 4.65 126289.10 51159
Bluescope Steel
Limited
15.
58 64.18%
110
00 26 10.00 281378.65 109999
Caltex
Australia
35.
31 12.93% 800 40 4.57 31901.73 3654
Duluxgroup
Limited
7.3
8 11.40%
150
0 8 0.84 12331.89 1262
Total
capital gain 166467
Table 13Calculation of required rate of return by using CAPM model
S.NO Companies Price
Return (%)
y-o-y Beta
Expected
return
1 Bank of Queensland 12.59
0.0260798
7 1.39 2.85%
2 Bega Cheese Limited 6.83
0.5487528
3 1.25 68.09%
3 Bluescope Steel Limited 15.58
0.5214843
8 1.24 64.18%
4 Caltex Australia 35.31
0.1677631
6 0.74 12.93%
5 Duluxgroup Limited 7.38
0.2158154
9 0.48 11.40%
Table 14Mutual fund portfolio
S.N
O Mutual fund 1
Expected
growth rate
Value at
end Return
8 | P a g e
Secure Best Marks with AI Grader
Need help grading? Try our AI Grader for instant feedback on your assignments.
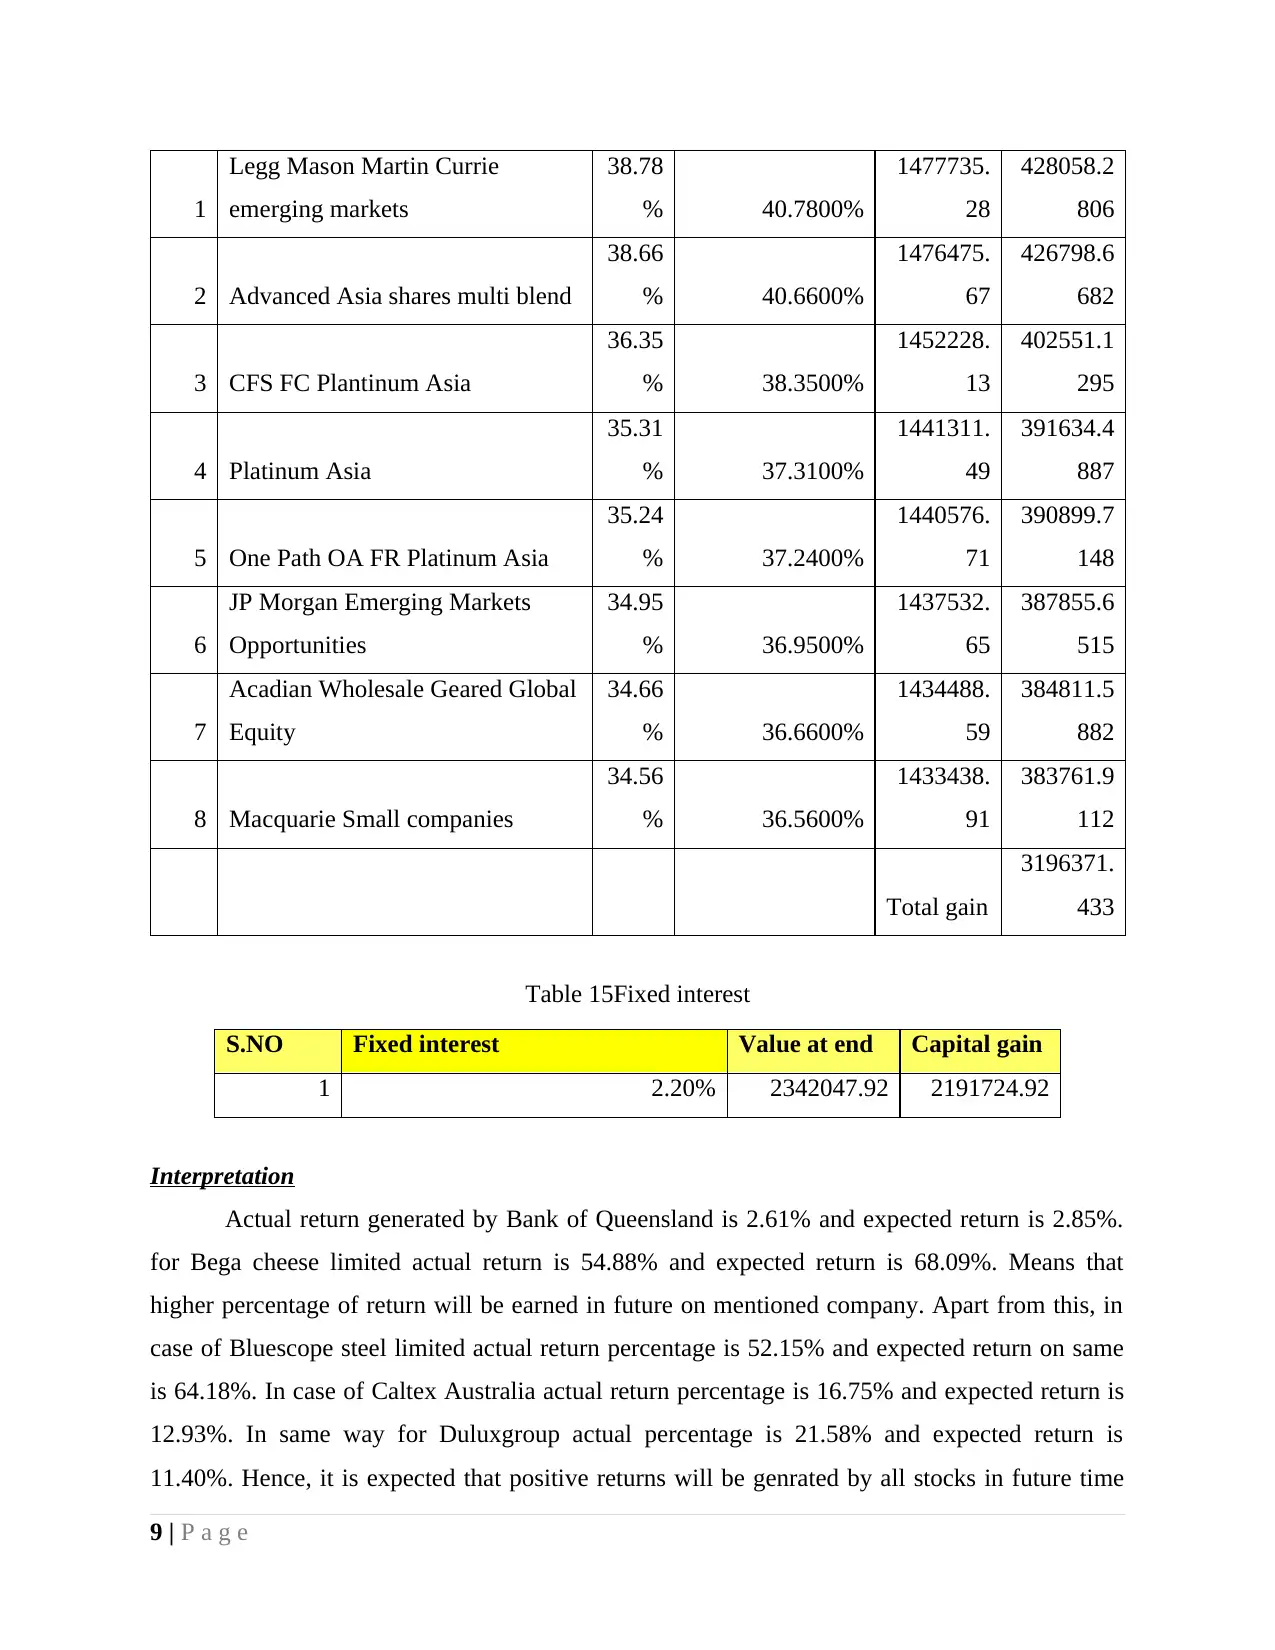
1
Legg Mason Martin Currie
emerging markets
38.78
% 40.7800%
1477735.
28
428058.2
806
2 Advanced Asia shares multi blend
38.66
% 40.6600%
1476475.
67
426798.6
682
3 CFS FC Plantinum Asia
36.35
% 38.3500%
1452228.
13
402551.1
295
4 Platinum Asia
35.31
% 37.3100%
1441311.
49
391634.4
887
5 One Path OA FR Platinum Asia
35.24
% 37.2400%
1440576.
71
390899.7
148
6
JP Morgan Emerging Markets
Opportunities
34.95
% 36.9500%
1437532.
65
387855.6
515
7
Acadian Wholesale Geared Global
Equity
34.66
% 36.6600%
1434488.
59
384811.5
882
8 Macquarie Small companies
34.56
% 36.5600%
1433438.
91
383761.9
112
Total gain
3196371.
433
Table 15Fixed interest
S.NO Fixed interest Value at end Capital gain
1 2.20% 2342047.92 2191724.92
Interpretation
Actual return generated by Bank of Queensland is 2.61% and expected return is 2.85%.
for Bega cheese limited actual return is 54.88% and expected return is 68.09%. Means that
higher percentage of return will be earned in future on mentioned company. Apart from this, in
case of Bluescope steel limited actual return percentage is 52.15% and expected return on same
is 64.18%. In case of Caltex Australia actual return percentage is 16.75% and expected return is
12.93%. In same way for Duluxgroup actual percentage is 21.58% and expected return is
11.40%. Hence, it is expected that positive returns will be genrated by all stocks in future time
9 | P a g e

period. Most of mutual fund schemes expected return is in range of 35 to 36% and it is expected
that return between 36% to 40% will be generated by most of mutual fund schemes. In case of
FD it is expected that return percentage will be 2.20%. It is anticipated that in upcoming time
period economic condition at global level will improve and due to this reason return generated
by these mutual fund schemes will also enahance.
Conclusion and recommendation
It is concluded that risk is high in equity then debt and mutual fund and return is
moderate in mutual fund schemes as well as high or moderate in case of equity. It is
recommended that youngsters can bear capital risk and due to this reason they must make
majority of investment in equity to earn good return. Whereas, old age people want security of
amount and due to this reason they must make majority of investment in mutual fund schemes so
that moderately risk of loss of investment amount can be minimized. Small percentage must be
invested in equity but in stocks that can generate good amount of return for them. By doing so
asset allocation can be done in better way and objectives can be achieved.
10 | P a g e
1 out of 12
Related Documents


Your All-in-One AI-Powered Toolkit for Academic Success.
+13062052269
info@desklib.com
Available 24*7 on WhatsApp / Email
![[object Object]](/_next/static/media/star-bottom.7253800d.svg)
Unlock your academic potential
© 2024 | Zucol Services PVT LTD | All rights reserved.