Investigating the UK Housing Market Dynamics and Inflation Impact
VerifiedAdded on 2023/01/19
|10
|2647
|100
Report
AI Summary
This report investigates the dynamics of the UK housing market and its relationship with inflation, utilizing secondary data from the Office for National Statistics spanning from 1992 to 2018. The study aims to determine correlations in dwelling house prices and identify mean differences between first-time buyers and former owner-occupiers. Data analysis includes frequency tables, histograms, measures of central tendency, and dispersion. Hypothesis testing reveals a strong positive correlation in mean dwelling house prices and a significant mean difference between first-time buyer and former owner-occupier prices. Key findings indicate that a majority of houses were sold within a specific price range, reflecting the value of the properties. The report also highlights the influence of inflation on new dwelling prices, which were higher compared to other dwellings, and the impact of wear and tear on the price reduction when sold to first time buyers. The conclusion summarizes the key observations, emphasizing the impact of inflation on UK housing market prices.
The Irish and UK housing market
and inflation
Introduction
Some products across the world have been having dynamic market with their prices appreciating
with time whereas other have been experiencing low market as their prices depreciate with time
thus their values rated low. For instance, the price of a piece of land is ever on the rise whereas
on the other hand the price of products like vehicles depreciate due to wear and tear as they are
put to use. Real estate business has been lucrative to many people and several people have been
venturing into it for years across the world (Haslam et al, 2015). The business involves buying
and selling of land, building, buying and selling of property and resulting to growth in real estate
economy (Squires and Heurkens, 2014). It can as well be referred to as housing market though
not commonly used term in the field instead real estate has been dominant term instead.
The purpose of this report was to determine the housing market and inflation in the UK. Inflation
is the general rise and fall in the purchasing value of money (Hansen, 2016). This sparked
curiosity to explore the activities in the entire real estate business (housing market). Assessing
the real estate business would result to mastering the challenges and finding ways of overcoming
the challenges and also making informed decisions in case one is to venture into the business.
The information from this report will be helpful for investors who would like to invest in housing
market in the Irish and UK. Though inflation have been affecting all forms of businesses, the
housing market is not exceptional to that. Objectives that were met in this report were as follows;
Paraphrase This Document
Need a fresh take? Get an instant paraphrase of this document with our AI Paraphraser
Specific objectives
1. To determine the correlation in the mean dwelling house prices in the UK
2. To determine the mean difference between first time buyers price and former owner
occupiers price in the UK
Research questions
1. Is there correlation in the mean dwelling house prices in the UK?
2. It there mean difference between the first time buyers’ price and the former owner
occupiers’ price in the UK?
Data sources
Data that was used in this report was secondary data obtained from the Office for National
Statistics for the house price simple averages. The data covered quarterly averages from the year
1992 to the year 2018 on the housing market covering simple average house price, mortgage
advances and incomes of borrowers by new or other dwellings, type of buyer and region in the
United Kingdom. The data was collected to investigate on the UK housing market and inflation.
The collected data were averaged quarterly for each year across all the years covered by the data.
For simplicity and easy access for use, the data was downloaded in excel file (.xls) since Excel
was to be used to analyze the data. The (.xls) data file was preferred over (.csv) since it did not
require any form of conversion in the file format unlike when (.csv) file was used.
Data analysis
The collected data were presented in tables and graphs as follows:
Data Frequencies
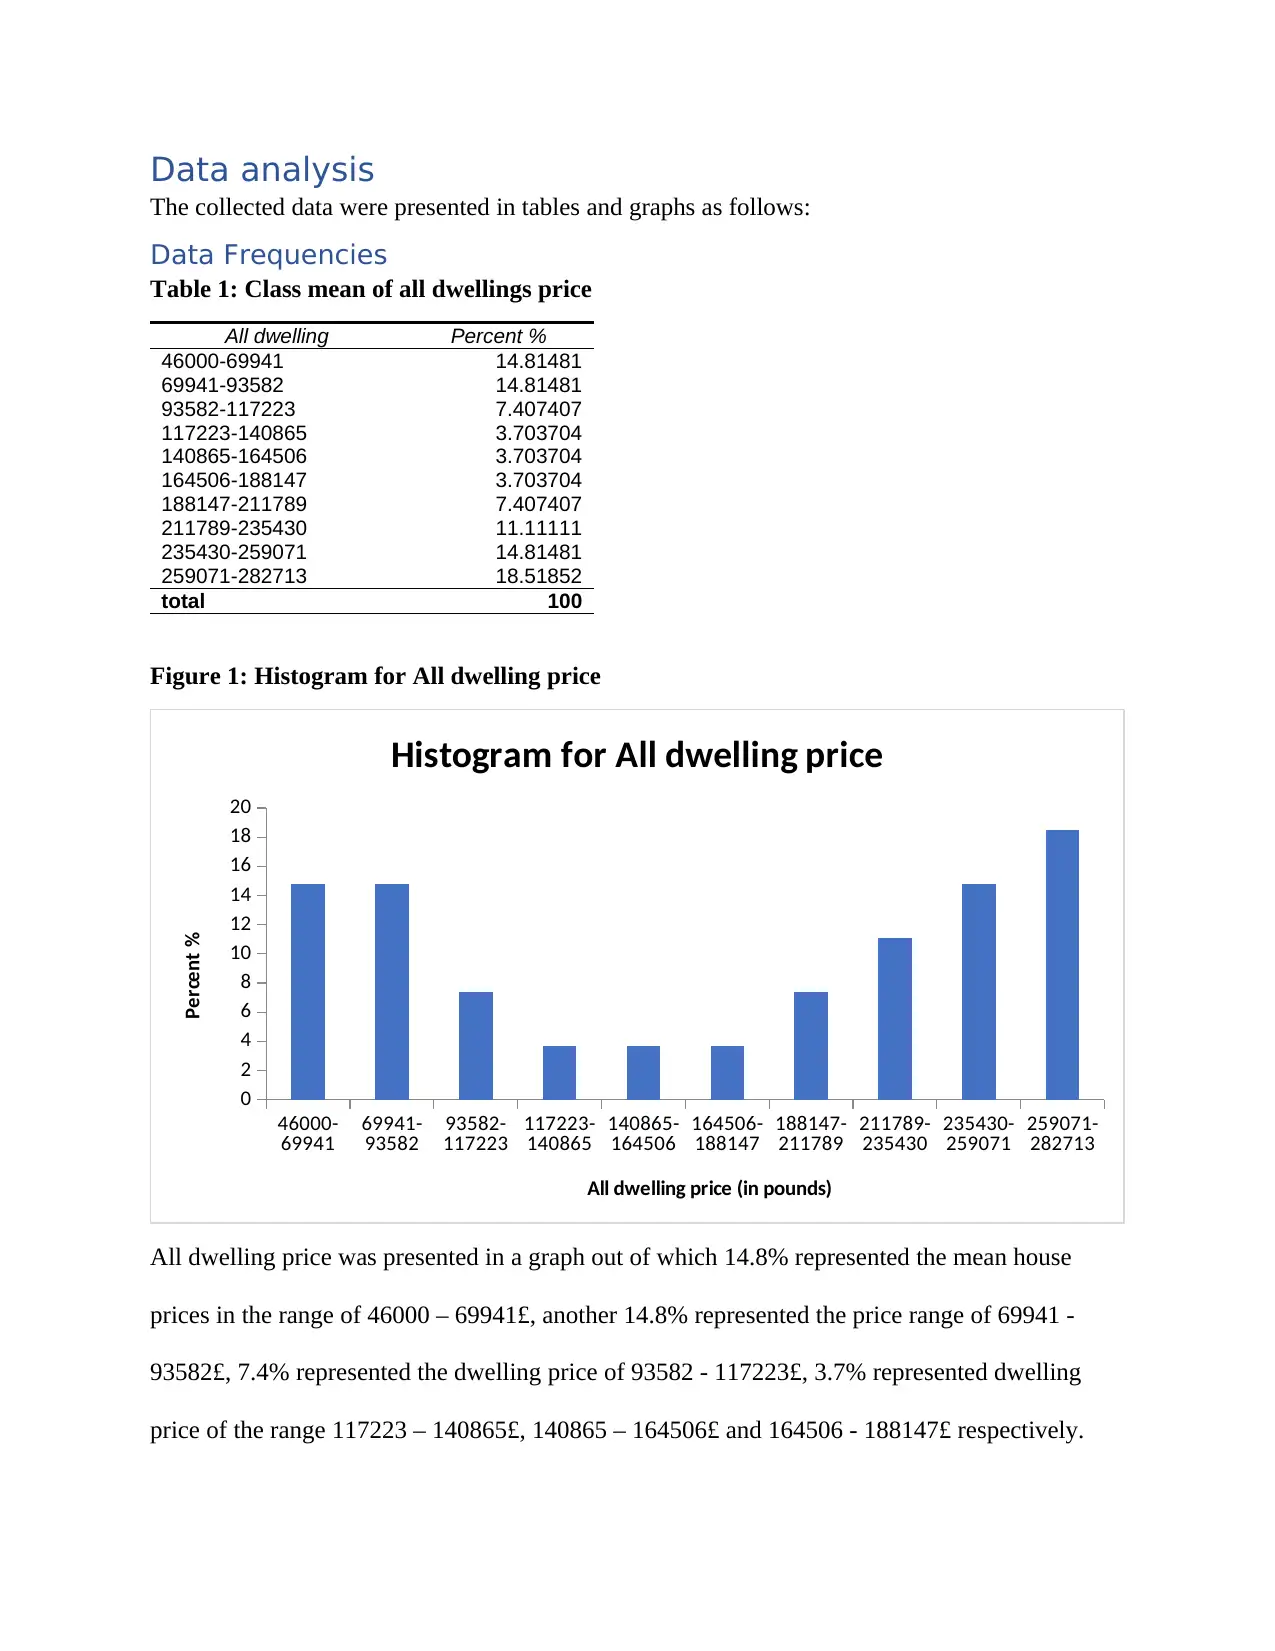
Table 1: Class mean of all dwellings price
All dwelling Percent %
46000-69941 14.81481
69941-93582 14.81481
93582-117223 7.407407
117223-140865 3.703704
140865-164506 3.703704
164506-188147 3.703704
188147-211789 7.407407
211789-235430 11.11111
235430-259071 14.81481
259071-282713 18.51852
total 100
Figure 1: Histogram for All dwelling price
46000-
69941 69941-
93582 93582-
117223 117223-
140865 140865-
164506 164506-
188147 188147-
211789 211789-
235430 235430-
259071 259071-
282713
0
2
4
6
8
10
12
14
16
18
20
Histogram for All dwelling price
All dwelling price (in pounds)
Percent %
All dwelling price was presented in a graph out of which 14.8% represented the mean house
prices in the range of 46000 – 69941£, another 14.8% represented the price range of 69941 -
93582£, 7.4% represented the dwelling price of 93582 - 117223£, 3.7% represented dwelling
price of the range 117223 – 140865£, 140865 – 164506£ and 164506 - 188147£ respectively.
The collected data were presented in tables and graphs as follows:
Data Frequencies
Table 1: Class mean of all dwellings price
All dwelling Percent %
46000-69941 14.81481
69941-93582 14.81481
93582-117223 7.407407
117223-140865 3.703704
140865-164506 3.703704
164506-188147 3.703704
188147-211789 7.407407
211789-235430 11.11111
235430-259071 14.81481
259071-282713 18.51852
total 100
Figure 1: Histogram for All dwelling price
46000-
69941 69941-
93582 93582-
117223 117223-
140865 140865-
164506 164506-
188147 188147-
211789 211789-
235430 235430-
259071 259071-
282713
0
2
4
6
8
10
12
14
16
18
20
Histogram for All dwelling price
All dwelling price (in pounds)
Percent %
All dwelling price was presented in a graph out of which 14.8% represented the mean house
prices in the range of 46000 – 69941£, another 14.8% represented the price range of 69941 -
93582£, 7.4% represented the dwelling price of 93582 - 117223£, 3.7% represented dwelling
price of the range 117223 – 140865£, 140865 – 164506£ and 164506 - 188147£ respectively.
⊘ This is a preview!⊘
Do you want full access?
Subscribe today to unlock all pages.
Trusted by 1+ million students worldwide
Dwelling house price of 188147 - 211789£ was represented by 7.4%, 211789 - 235430£
represented by 11.1%, 235430 - 259071£ represented by 14.8% and lastly 259071 – 282713 was
represented by 18.5%.
Measure of central location and measures of central dispersion
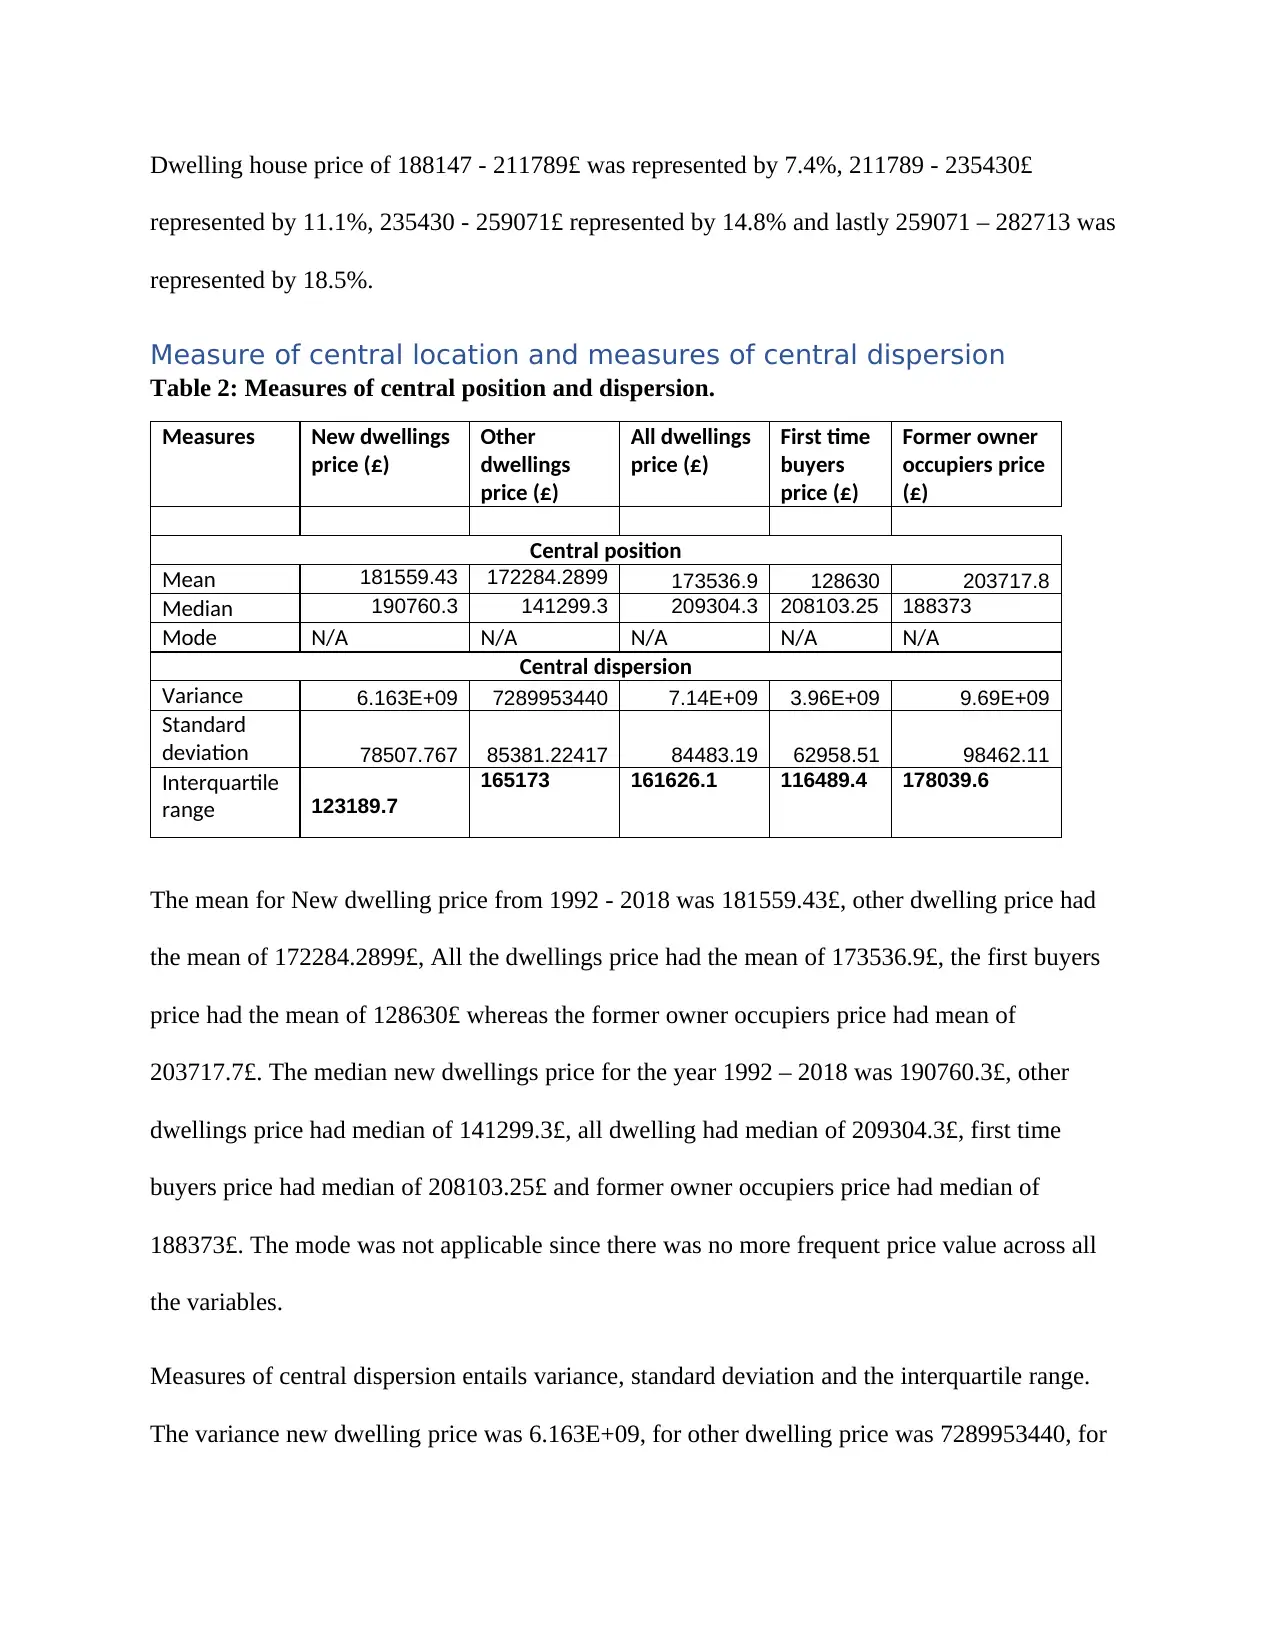
Table 2: Measures of central position and dispersion.
Measures New dwellings
price (£)
Other
dwellings
price (£)
All dwellings
price (£)
First time
buyers
price (£)
Former owner
occupiers price
(£)
Central position
Mean 181559.43 172284.2899 173536.9 128630 203717.8
Median 190760.3 141299.3 209304.3 208103.25 188373
Mode N/A N/A N/A N/A N/A
Central dispersion
Variance 6.163E+09 7289953440 7.14E+09 3.96E+09 9.69E+09
Standard
deviation 78507.767 85381.22417 84483.19 62958.51 98462.11
Interquartile
range 123189.7
165173 161626.1 116489.4 178039.6
The mean for New dwelling price from 1992 - 2018 was 181559.43£, other dwelling price had
the mean of 172284.2899£, All the dwellings price had the mean of 173536.9£, the first buyers
price had the mean of 128630£ whereas the former owner occupiers price had mean of
203717.7£. The median new dwellings price for the year 1992 – 2018 was 190760.3£, other
dwellings price had median of 141299.3£, all dwelling had median of 209304.3£, first time
buyers price had median of 208103.25£ and former owner occupiers price had median of
188373£. The mode was not applicable since there was no more frequent price value across all
the variables.
Measures of central dispersion entails variance, standard deviation and the interquartile range.
The variance new dwelling price was 6.163E+09, for other dwelling price was 7289953440, for
represented by 11.1%, 235430 - 259071£ represented by 14.8% and lastly 259071 – 282713 was
represented by 18.5%.
Measure of central location and measures of central dispersion
Table 2: Measures of central position and dispersion.
Measures New dwellings
price (£)
Other
dwellings
price (£)
All dwellings
price (£)
First time
buyers
price (£)
Former owner
occupiers price
(£)
Central position
Mean 181559.43 172284.2899 173536.9 128630 203717.8
Median 190760.3 141299.3 209304.3 208103.25 188373
Mode N/A N/A N/A N/A N/A
Central dispersion
Variance 6.163E+09 7289953440 7.14E+09 3.96E+09 9.69E+09
Standard
deviation 78507.767 85381.22417 84483.19 62958.51 98462.11
Interquartile
range 123189.7
165173 161626.1 116489.4 178039.6
The mean for New dwelling price from 1992 - 2018 was 181559.43£, other dwelling price had
the mean of 172284.2899£, All the dwellings price had the mean of 173536.9£, the first buyers
price had the mean of 128630£ whereas the former owner occupiers price had mean of
203717.7£. The median new dwellings price for the year 1992 – 2018 was 190760.3£, other
dwellings price had median of 141299.3£, all dwelling had median of 209304.3£, first time
buyers price had median of 208103.25£ and former owner occupiers price had median of
188373£. The mode was not applicable since there was no more frequent price value across all
the variables.
Measures of central dispersion entails variance, standard deviation and the interquartile range.
The variance new dwelling price was 6.163E+09, for other dwelling price was 7289953440, for
Paraphrase This Document
Need a fresh take? Get an instant paraphrase of this document with our AI Paraphraser
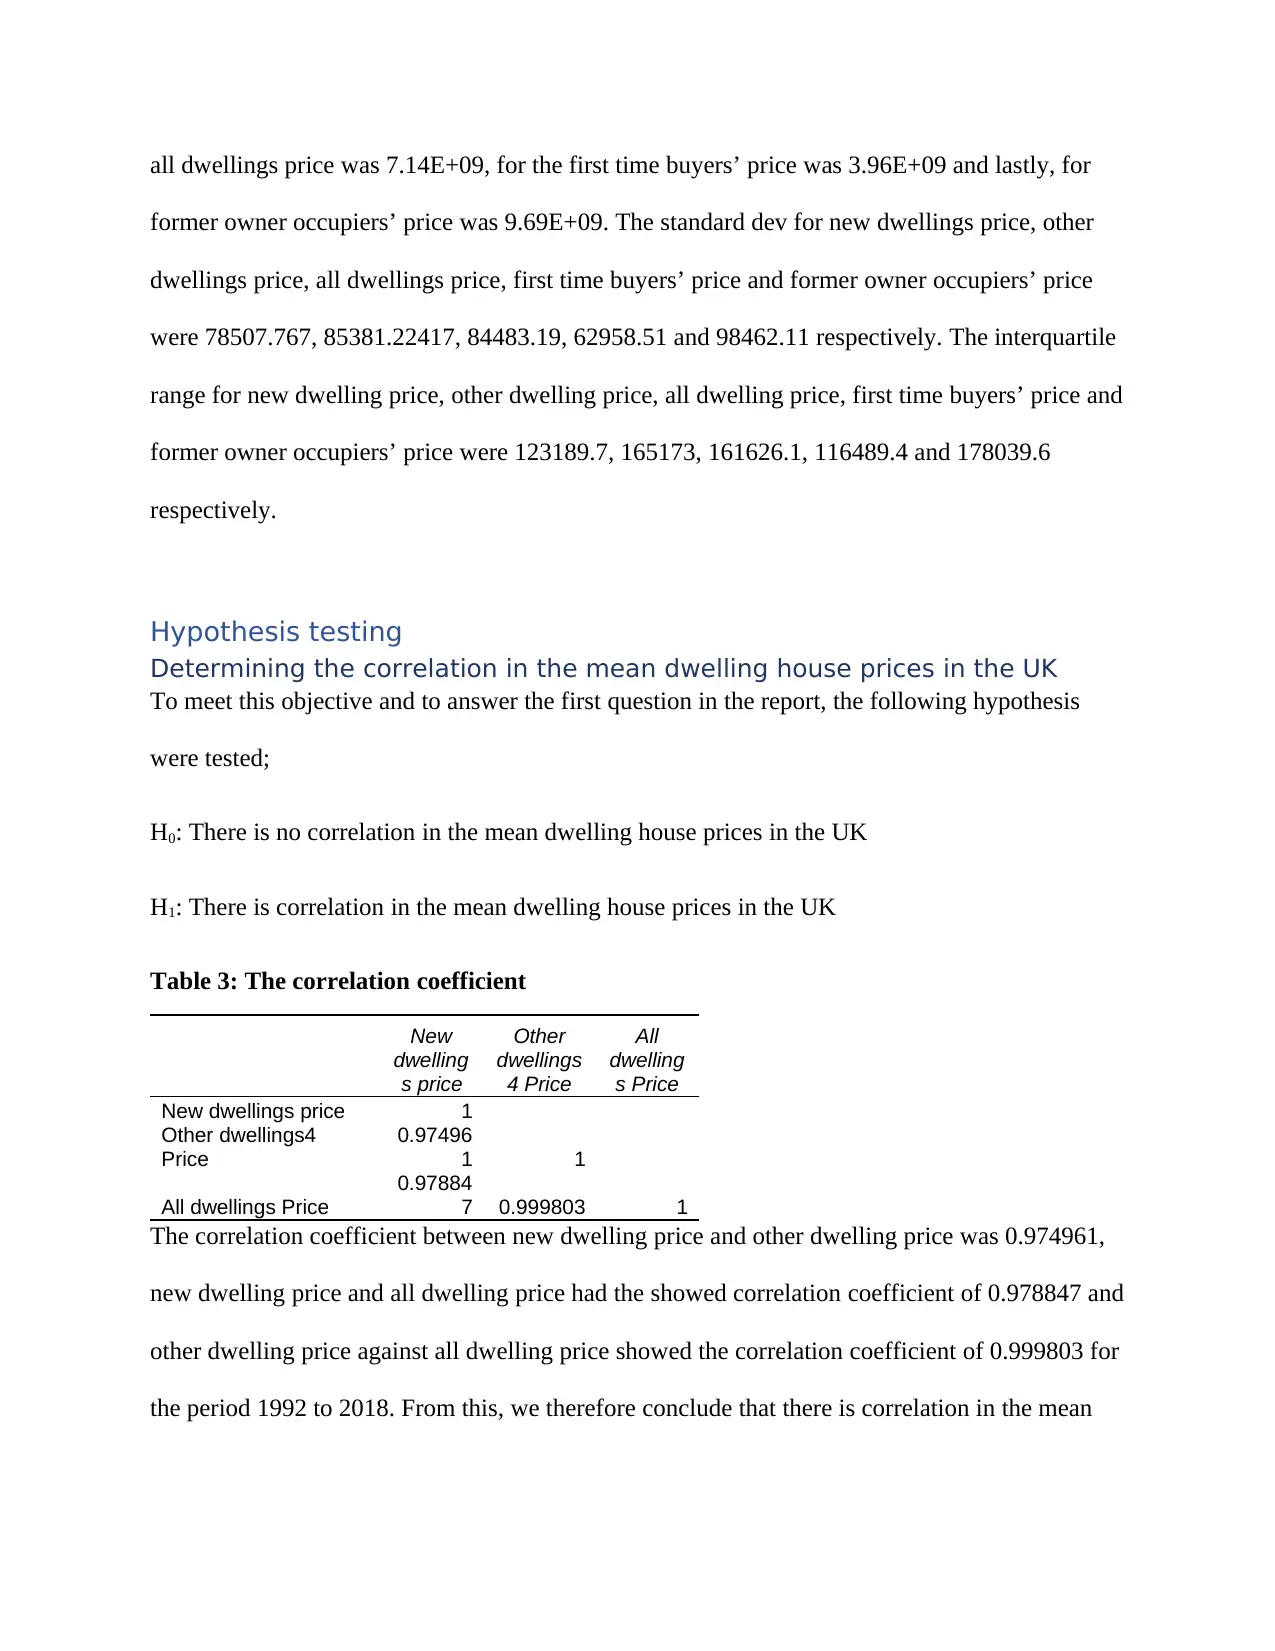
all dwellings price was 7.14E+09, for the first time buyers’ price was 3.96E+09 and lastly, for
former owner occupiers’ price was 9.69E+09. The standard dev for new dwellings price, other
dwellings price, all dwellings price, first time buyers’ price and former owner occupiers’ price
were 78507.767, 85381.22417, 84483.19, 62958.51 and 98462.11 respectively. The interquartile
range for new dwelling price, other dwelling price, all dwelling price, first time buyers’ price and
former owner occupiers’ price were 123189.7, 165173, 161626.1, 116489.4 and 178039.6
respectively.
Hypothesis testing
Determining the correlation in the mean dwelling house prices in the UK
To meet this objective and to answer the first question in the report, the following hypothesis
were tested;
H0: There is no correlation in the mean dwelling house prices in the UK
H1: There is correlation in the mean dwelling house prices in the UK
Table 3: The correlation coefficient
New
dwelling
s price
Other
dwellings
4 Price
All
dwelling
s Price
New dwellings price 1
Other dwellings4
Price
0.97496
1 1
All dwellings Price
0.97884
7 0.999803 1
The correlation coefficient between new dwelling price and other dwelling price was 0.974961,
new dwelling price and all dwelling price had the showed correlation coefficient of 0.978847 and
other dwelling price against all dwelling price showed the correlation coefficient of 0.999803 for
the period 1992 to 2018. From this, we therefore conclude that there is correlation in the mean
dwelling house prices in the UK. All the variables tested showed strong positive correlation
between each other showing that increase in one price would result to an increase in other prices.
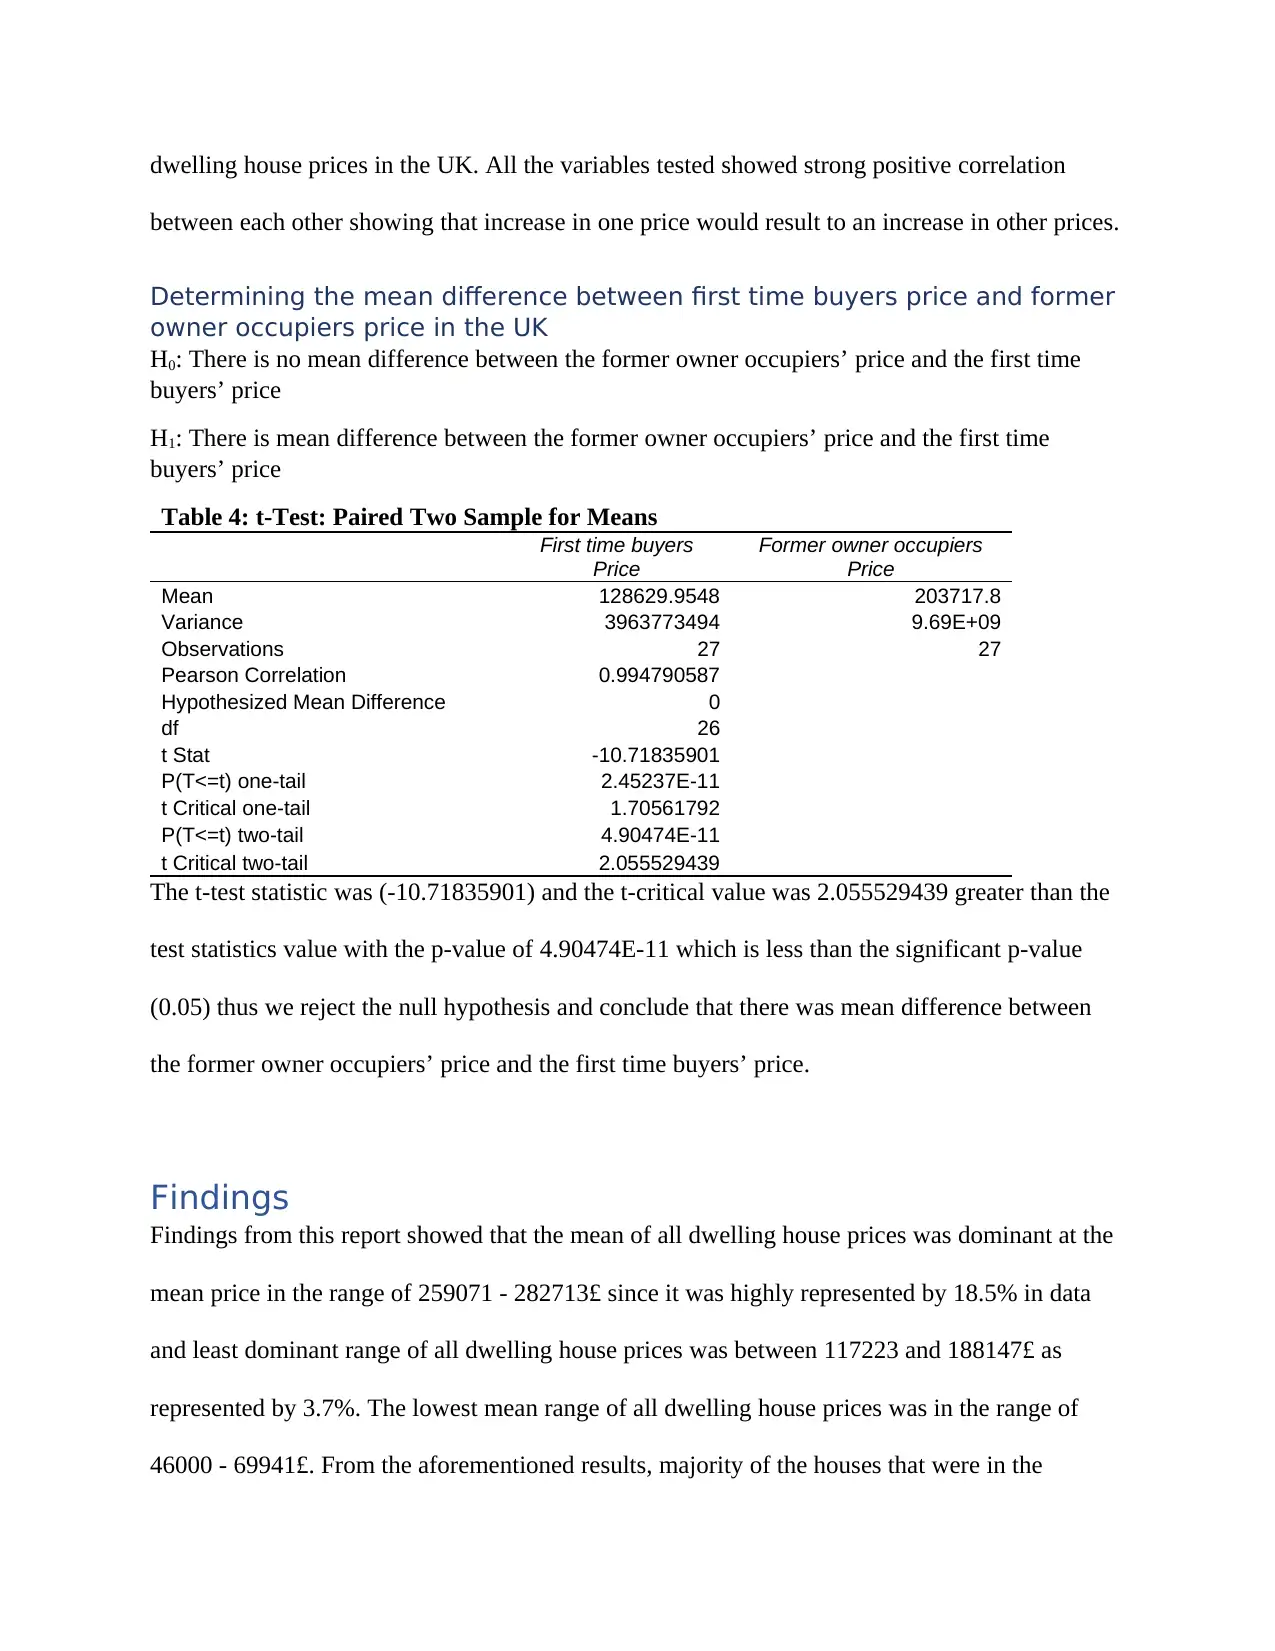
Determining the mean difference between first time buyers price and former
owner occupiers price in the UK
H0: There is no mean difference between the former owner occupiers’ price and the first time
buyers’ price
H1: There is mean difference between the former owner occupiers’ price and the first time
buyers’ price
Table 4: t-Test: Paired Two Sample for Means
First time buyers
Price
Former owner occupiers
Price
Mean 128629.9548 203717.8
Variance 3963773494 9.69E+09
Observations 27 27
Pearson Correlation 0.994790587
Hypothesized Mean Difference 0
df 26
t Stat -10.71835901
P(T<=t) one-tail 2.45237E-11
t Critical one-tail 1.70561792
P(T<=t) two-tail 4.90474E-11
t Critical two-tail 2.055529439
The t-test statistic was (-10.71835901) and the t-critical value was 2.055529439 greater than the
test statistics value with the p-value of 4.90474E-11 which is less than the significant p-value
(0.05) thus we reject the null hypothesis and conclude that there was mean difference between
the former owner occupiers’ price and the first time buyers’ price.
Findings
Findings from this report showed that the mean of all dwelling house prices was dominant at the
mean price in the range of 259071 - 282713£ since it was highly represented by 18.5% in data
and least dominant range of all dwelling house prices was between 117223 and 188147£ as
represented by 3.7%. The lowest mean range of all dwelling house prices was in the range of
46000 - 69941£. From the aforementioned results, majority of the houses that were in the
between each other showing that increase in one price would result to an increase in other prices.
Determining the mean difference between first time buyers price and former
owner occupiers price in the UK
H0: There is no mean difference between the former owner occupiers’ price and the first time
buyers’ price
H1: There is mean difference between the former owner occupiers’ price and the first time
buyers’ price
Table 4: t-Test: Paired Two Sample for Means
First time buyers
Price
Former owner occupiers
Price
Mean 128629.9548 203717.8
Variance 3963773494 9.69E+09
Observations 27 27
Pearson Correlation 0.994790587
Hypothesized Mean Difference 0
df 26
t Stat -10.71835901
P(T<=t) one-tail 2.45237E-11
t Critical one-tail 1.70561792
P(T<=t) two-tail 4.90474E-11
t Critical two-tail 2.055529439
The t-test statistic was (-10.71835901) and the t-critical value was 2.055529439 greater than the
test statistics value with the p-value of 4.90474E-11 which is less than the significant p-value
(0.05) thus we reject the null hypothesis and conclude that there was mean difference between
the former owner occupiers’ price and the first time buyers’ price.
Findings
Findings from this report showed that the mean of all dwelling house prices was dominant at the
mean price in the range of 259071 - 282713£ since it was highly represented by 18.5% in data
and least dominant range of all dwelling house prices was between 117223 and 188147£ as
represented by 3.7%. The lowest mean range of all dwelling house prices was in the range of
46000 - 69941£. From the aforementioned results, majority of the houses that were in the
⊘ This is a preview!⊘
Do you want full access?
Subscribe today to unlock all pages.
Trusted by 1+ million students worldwide
housing market were still in good desired condition. Value of the product is measured with the
price tag labeled against it (Lin and Huang, 2012). This therefore confirms that being that the
mean prices in the housing market were dominant at 259071 – 282713£, the houses were still
valuable. Housing market is important and key player in the development and general growth of
real estate industry (Shatkin, 2016). Maintaining products in good stable conditions improves
their value and attracts buyers where they can be sold at relatively good prices at no loss (Sanyé‐
Mengual et al, 2014).
The mean of new dwelling price of houses was found to be 181559.43£ which was relatively
higher than other dwelling prices in the housing market which was found to be 172284.2899£.
From this, the newly quoted prices were in the rise showing that there was an inflation which
referred to general increase or decrease in price and value of money (Woodford, 2012). The
houses which could be bought at relatively lower price was now quoted at higher prices as
evident in the mean new dwelling prices. The prices also changed with a drop of mean for former
owner occupiers price from 203717.8£ to 128630£ when sold to the first time buyer. This
showed a drop in the value of houses with time due to the age and other hidden factors such as
the condition of the house at the time the former owner was willing to sell it to the first time
buyer. Wear and tear of the materials used to build the house are other key factors that could lead
to such inflation in the housing market (Mesthrige et al, 2013). The median price for mean of all
dwelling house prices in the housing market was found to be 209304.3£ but with no modal mean
price. Having no modal mean price meant that the price of houses in the housing market varied a
lot for the period 1992 – 2018 when the data were collected.
Standard deviation always gives the measure of how the calculated mean statistic varied from the
population parameter (Hjorth, 2017). Mean of all dwelling price varied from the actual mean by
Paraphrase This Document
Need a fresh take? Get an instant paraphrase of this document with our AI Paraphraser
a standard deviation of 84483.19£ with the mean of first time buyers price varying by 62958.51£.
Larger standard deviation value showed that the values were deviated much from the population
parameter (Burt, 2017).
From the hypothesis tested in this report about the existence of correlation among the dwelling
prices, they all showed the existence of strong positive correlation with the Pearson’s correlation
coefficient of (r≈0.98) except for the relationship between mean of other dwelling prices and all
dwelling prices which had a near perfect positive correlation of (r=0.999803). This showed that
when other dwelling prices changed by a certain factor, all dwelling prices would change by
almost the same factor hence are directly proportional to one another. Also, mean difference
existed between the former owner occupier price and the first time buyers’ price as from the t-
test that favored the alternative hypothesis that there was mean difference between the two
dwelling prices. This showed that the housing market in the UK was affected with inflation of
house prices since houses were being sold at relatively lower prices as from the data for the
period 1992 – 2018.
Conclusion
It can then be concluded that most of the houses in the UK were sold at the mean price of 259071
- 282713£ for the period 1992 – 2018 and that the cheapest houses in the housing market ranged
between 46000 and 69941£ for that same period of time. Furthermore, it can be concluded that
housing market in the UK experienced inflation as shown in the differences between dwelling
house prices. Drop in the price of the product from seller to a customer like it was from the
former owner occupier and the first time buyer could be due to a number of factors that have not
been discussed in this report which could not particularly be as a result of inflation.
References
Burt, R.S., 2017. Structural holes versus network closure as social capital. In Social capital (pp.
31-56). Routledge.
Hansen, B., 2016. A Study in the Theory of Inflation. Routledge.
Haslam, C., Tsitsianis, N., Andersson, T. and Gleadle, P., 2015, December. Real Estate
Investment Trusts (REITS): A new business model in the FTSE100. In Accounting Forum (Vol.
39, No. 4, pp. 239-248). Taylor & Francis.
Hjorth, J.U., 2017. Computer intensive statistical methods: Validation, model selection, and
bootstrap. Routledge.
Lin, P.C. and Huang, Y.H., 2012. The influence factors on choice behavior regarding green
products based on the theory of consumption values. Journal of Cleaner Production, 22(1),
pp.11-18.
Mesthrige Jayantha, W. and Sze Man, W., 2013. Effect of green labelling on residential property
price: a case study in Hong Kong. Journal of Facilities Management, 11(1), pp.31-51.
Sanyé‐Mengual, E., Pérez‐López, P., González‐García, S., Lozano, R.G., Feijoo, G., Moreira,
M.T., Gabarrell, X. and Rieradevall, J., 2014. Eco‐designing the use phase of products in
sustainable manufacturing: The importance of maintenance and communication‐to‐user
strategies. Journal of Industrial Ecology, 18(4), pp.545-557.
Shatkin, G., 2016. The real estate turn in policy and planning: Land monetization and the
political economy of peri-urbanization in Asia. Cities, 53, pp.141-149.
⊘ This is a preview!⊘
Do you want full access?
Subscribe today to unlock all pages.
Trusted by 1+ million students worldwide

Squires, G. and Heurkens, E. eds., 2014. International approaches to real estate development.
Routledge.
Woodford, M., 2012. Inflation targeting and financial stability (No. w17967). National Bureau
of Economic Research.
Routledge.
Woodford, M., 2012. Inflation targeting and financial stability (No. w17967). National Bureau
of Economic Research.
1 out of 10
Related Documents


Your All-in-One AI-Powered Toolkit for Academic Success.
+13062052269
info@desklib.com
Available 24*7 on WhatsApp / Email
![[object Object]](/_next/static/media/star-bottom.7253800d.svg)
Unlock your academic potential
Copyright © 2020–2026 A2Z Services. All Rights Reserved. Developed and managed by ZUCOL.