Eco-Fone Report: UK Smartphone Market Expansion Analysis
VerifiedAdded on 2022/09/12
|16
|2915
|22
Report
AI Summary
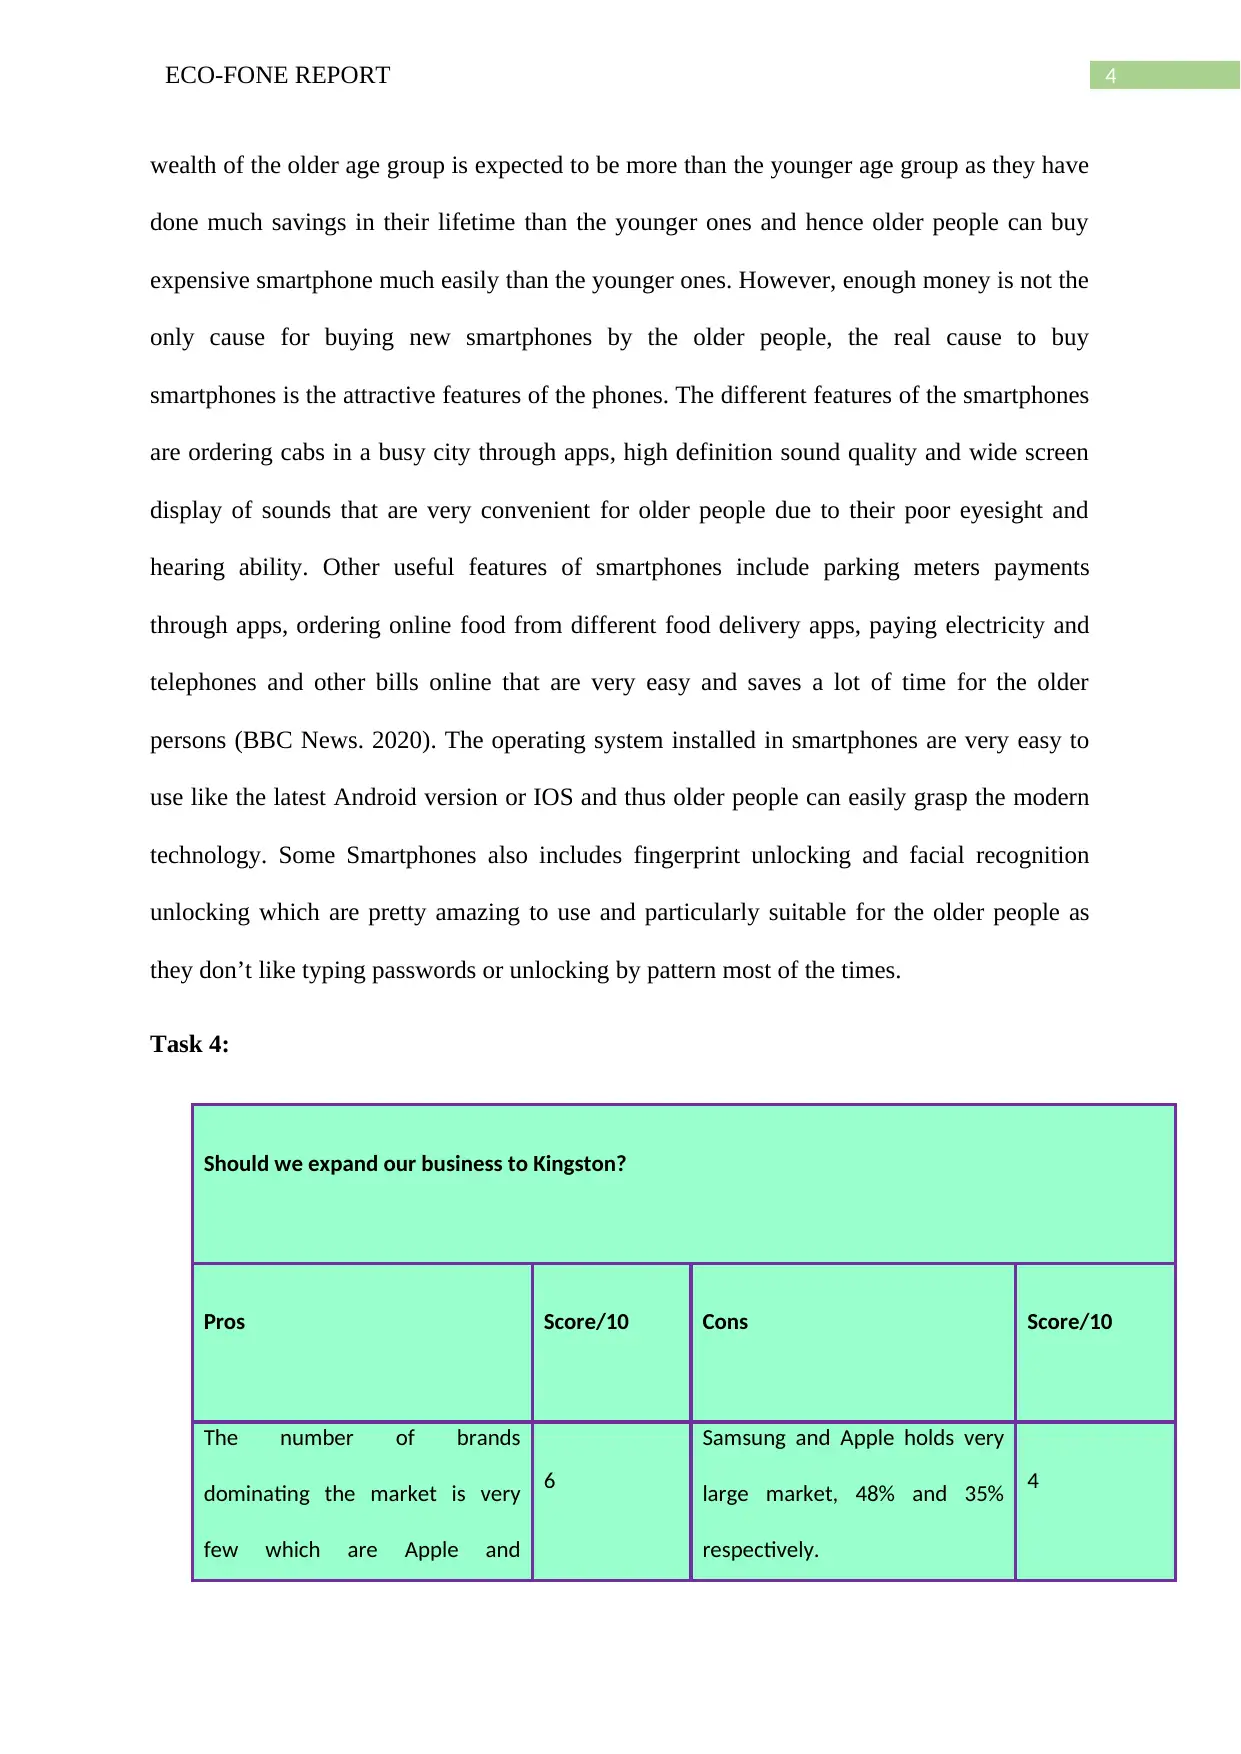
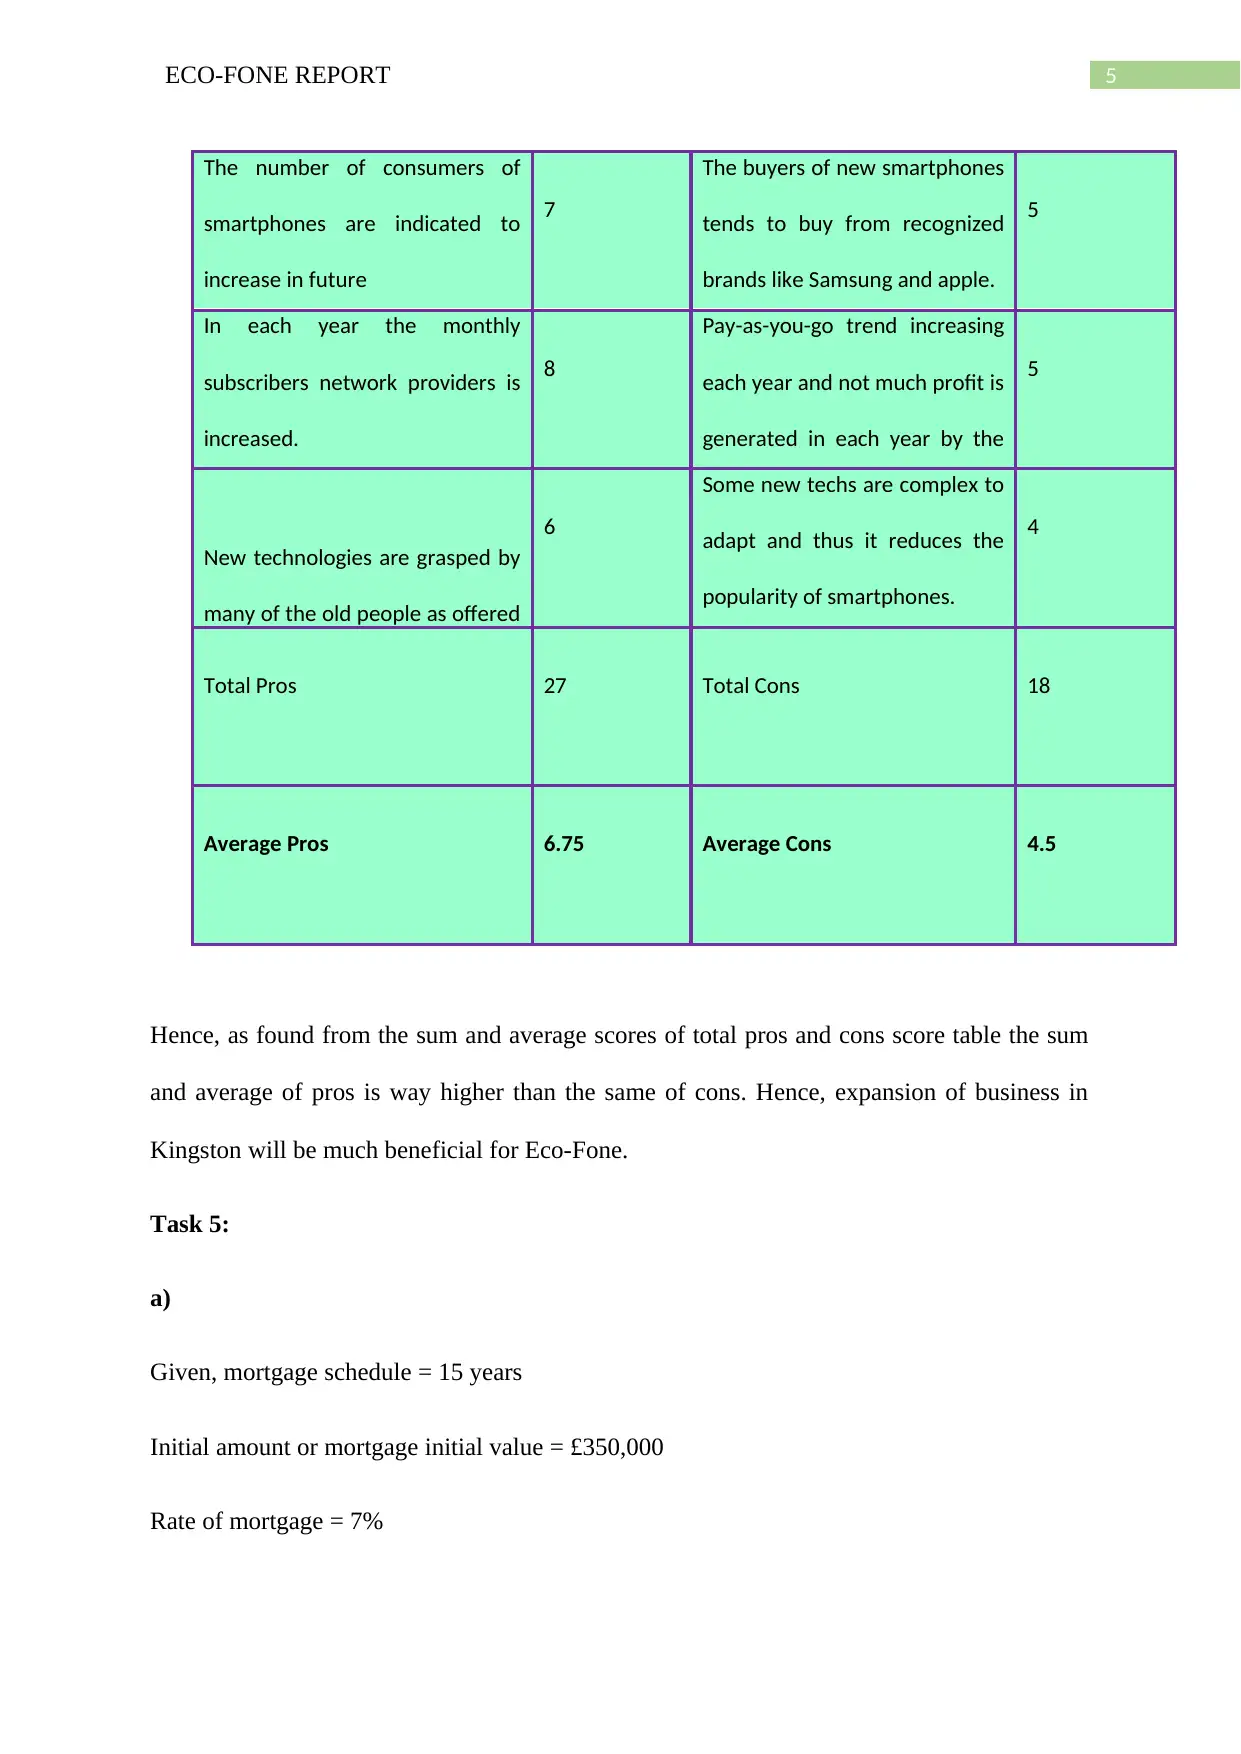
This report analyzes the smartphone market for Eco-Fone, a new company seeking expansion in the UK. It examines market growth, smartphone features, and consumer behavior using Deloitte research and statistical methods. Task 1 explores smartphone usage patterns among the UK labor force, categorizing activities like email, calendar management, and voice calls, with data from 2016 and 2017. Task 2 presents a line chart of smartphone usage from 2012 to 2017 and forecasts future usage. Task 3 discusses the popularity of smartphones among older adults, highlighting attractive features. Task 4 evaluates the pros and cons of expanding the business to Kingston. Task 5 calculates mortgage payments, and Task 6 compares sales data from two shops using a t-test. Task 7 analyzes customer responses using median values. Task 8 assesses invoice quality using Poisson distribution, and Task 10 provides a concise business overview. The report suggests expansion is beneficial, considering market trends and competition.
1 out of 16
Related Documents


Your All-in-One AI-Powered Toolkit for Academic Success.
+13062052269
info@desklib.com
Available 24*7 on WhatsApp / Email
![[object Object]](/_next/static/media/star-bottom.7253800d.svg)
Copyright © 2020–2026 A2Z Services. All Rights Reserved. Developed and managed by ZUCOL.