HA1011 Statistics Assignment: Data Analysis, Probability, Holmes
VerifiedAdded on 2023/04/23
|16
|3727
|132
Homework Assignment
AI Summary
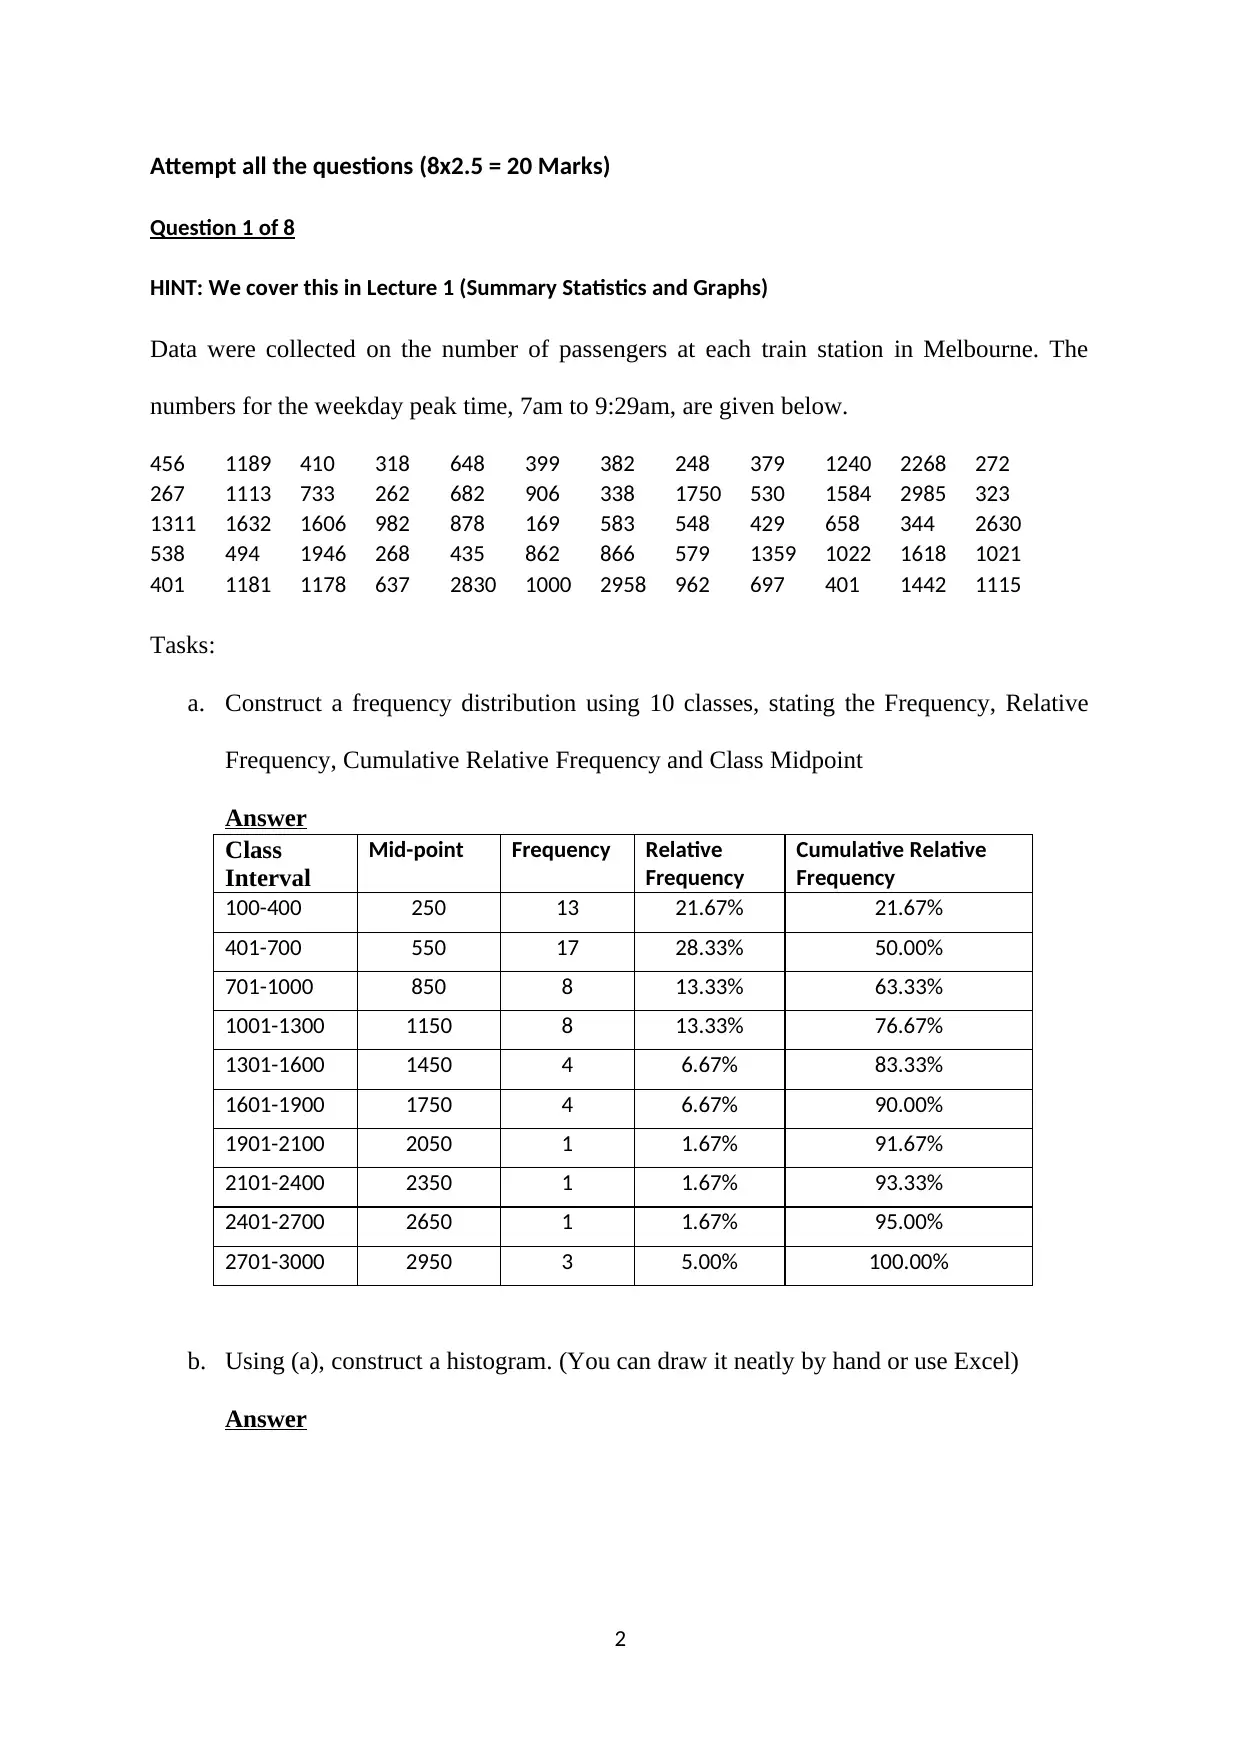
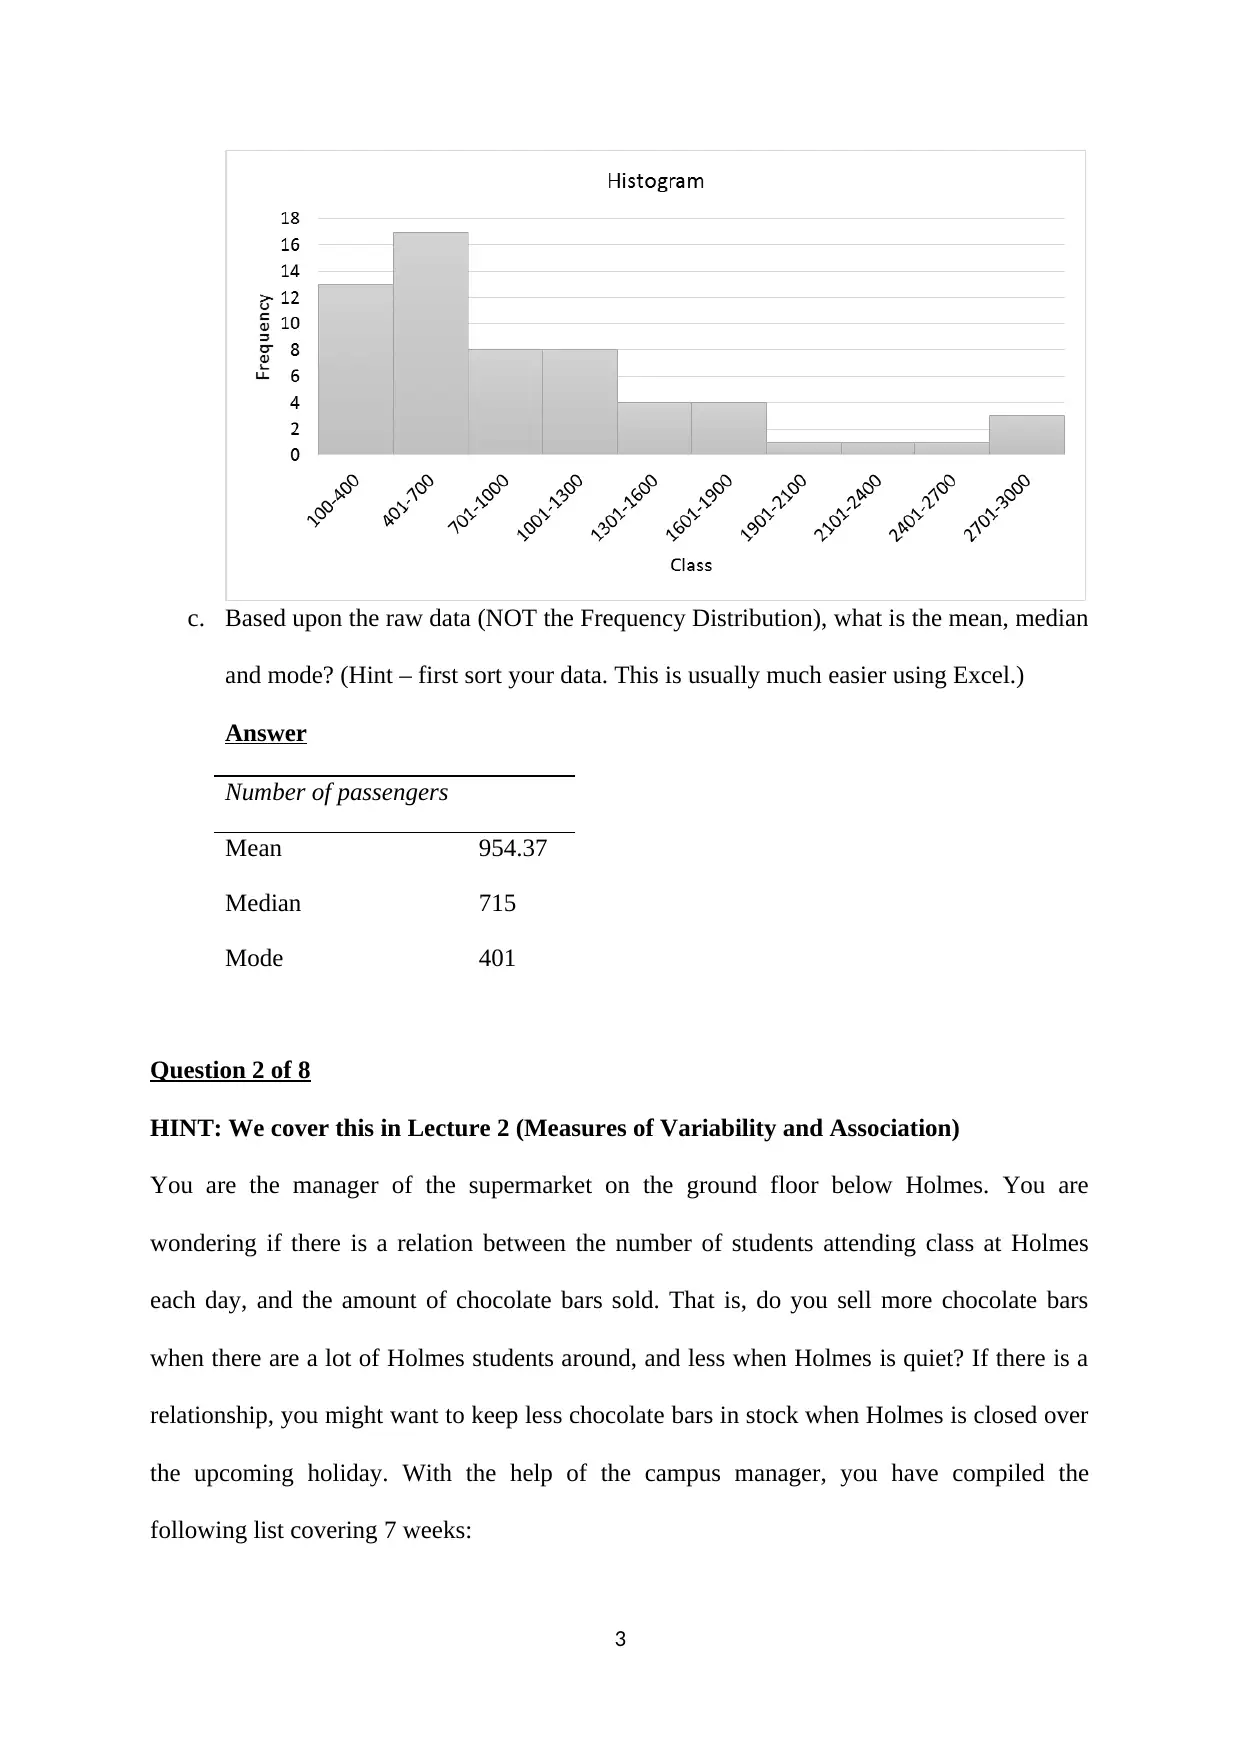
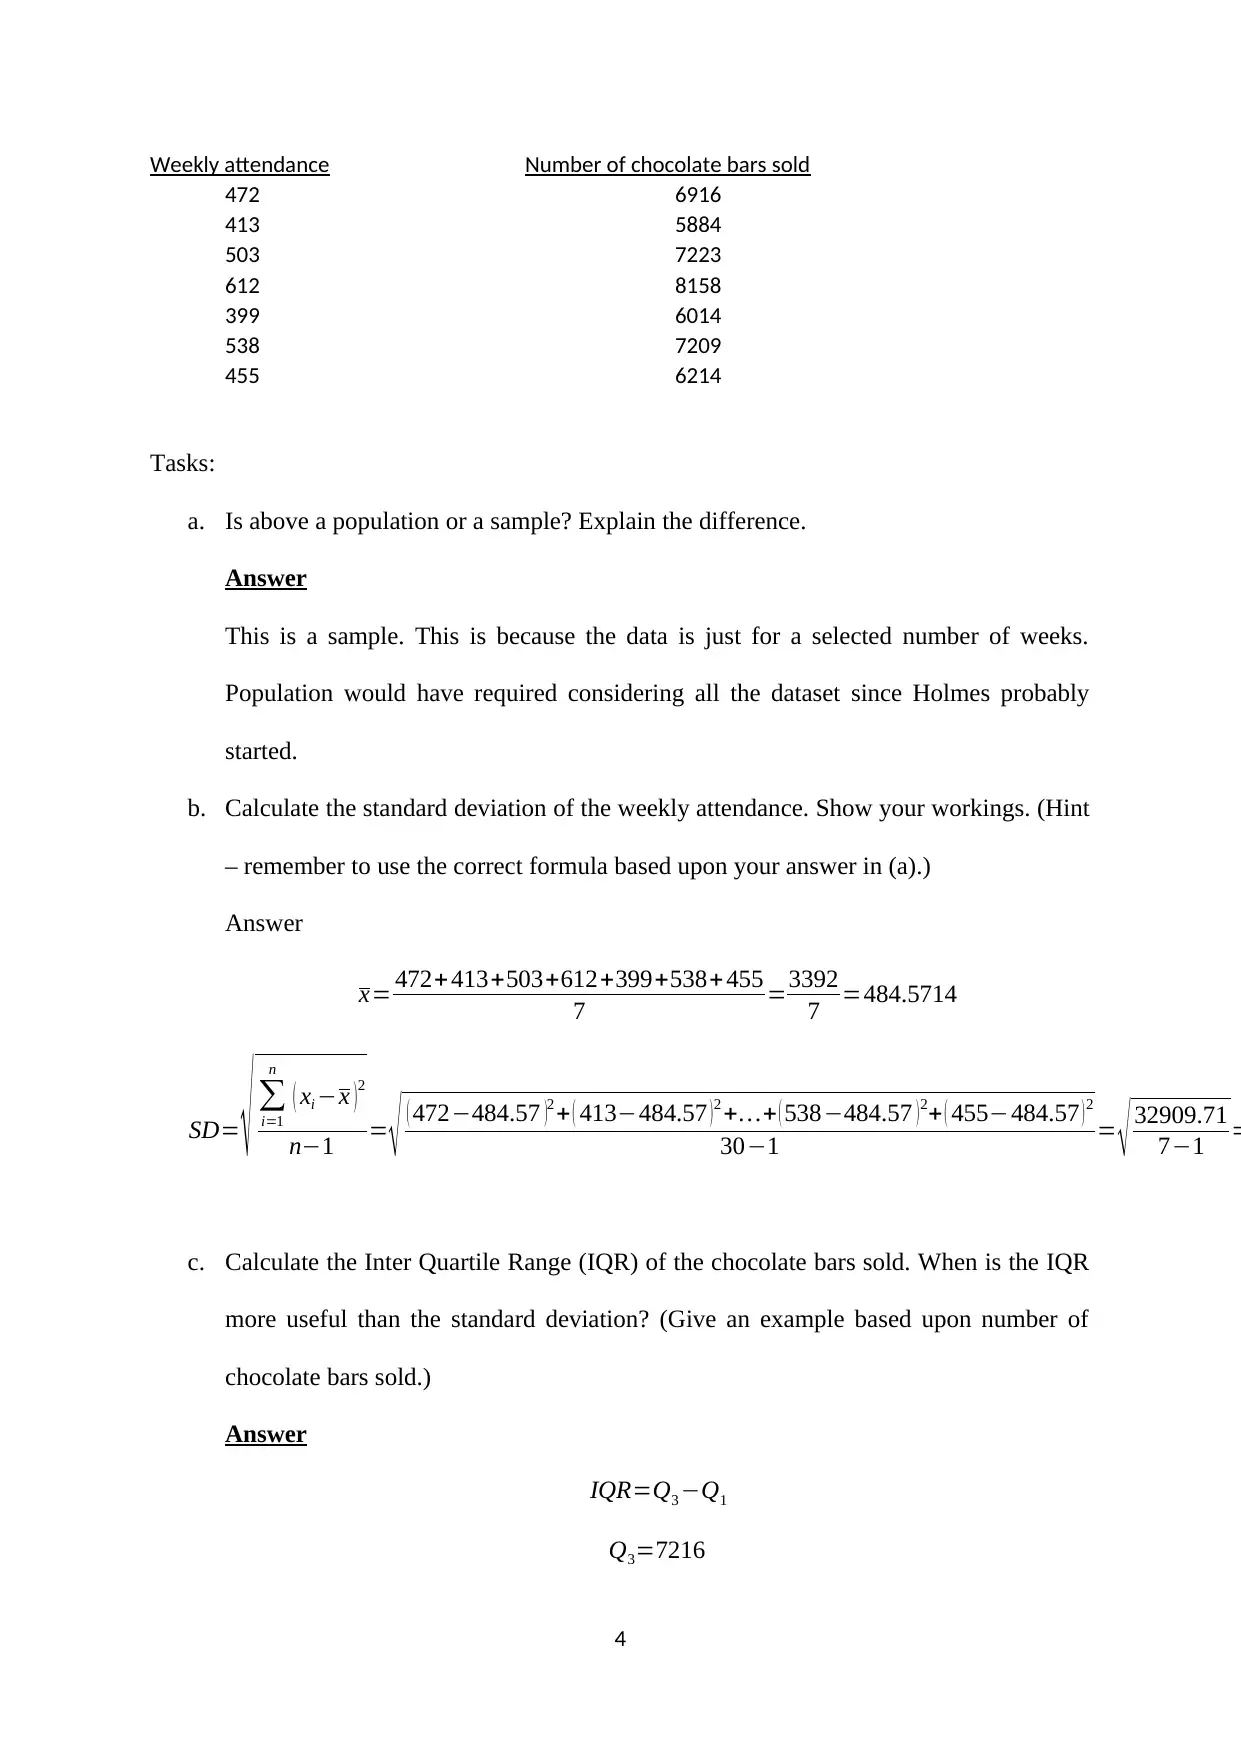
This assignment solution for HA1011 Statistics covers various statistical concepts, including data analysis, probability, and regression. It begins with constructing a frequency distribution and histogram from passenger data at Melbourne train stations, followed by calculating mean, median, and mode. The assignment then explores the relationship between student attendance and chocolate bar sales using standard deviation, interquartile range (IQR), and correlation coefficient. Furthermore, it involves calculating and interpreting a regression equation to predict chocolate bar sales based on student attendance, along with the coefficient of determination. The assignment also delves into probability calculations related to player recruitment and training in a cricket team, using Bayes' Rule to analyze market research data for launching new products. The solutions provide detailed workings and interpretations, demonstrating a comprehensive understanding of statistical principles and their practical applications.
1 out of 16
Related Documents


Your All-in-One AI-Powered Toolkit for Academic Success.
+13062052269
info@desklib.com
Available 24*7 on WhatsApp / Email
![[object Object]](/_next/static/media/star-bottom.7253800d.svg)
Copyright © 2020–2026 A2Z Services. All Rights Reserved. Developed and managed by ZUCOL.