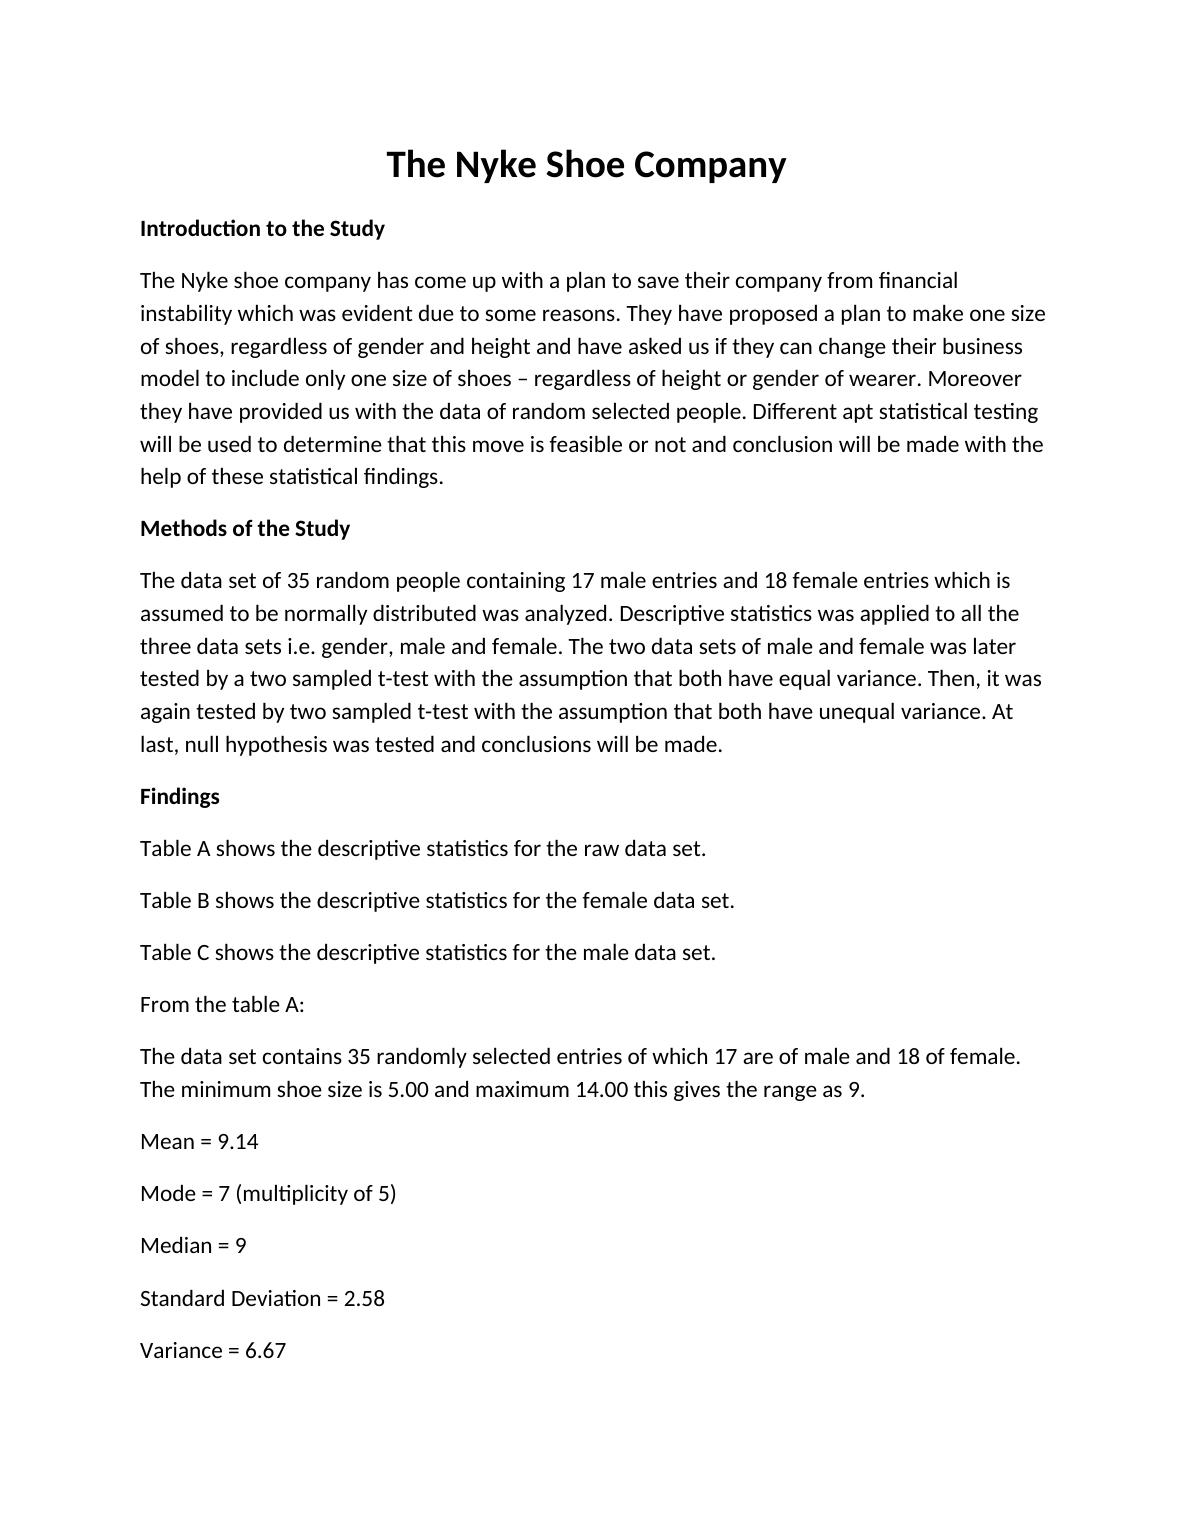
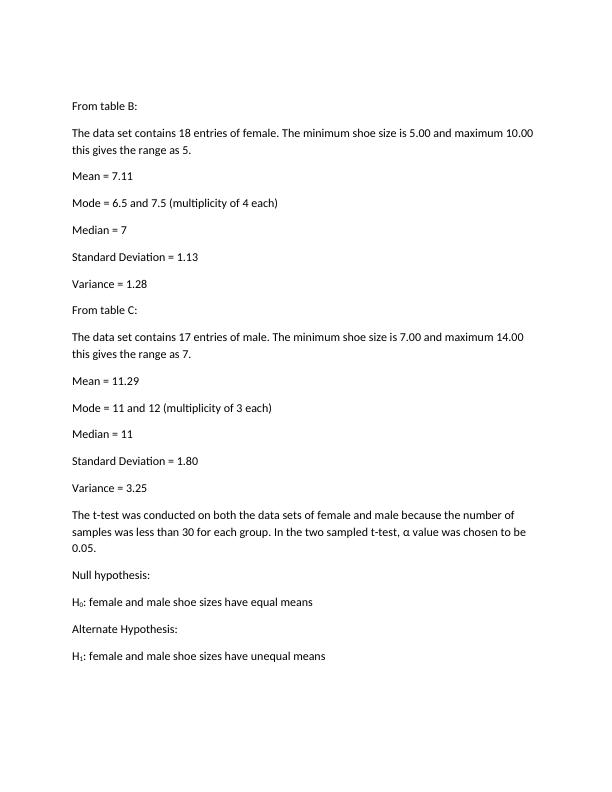
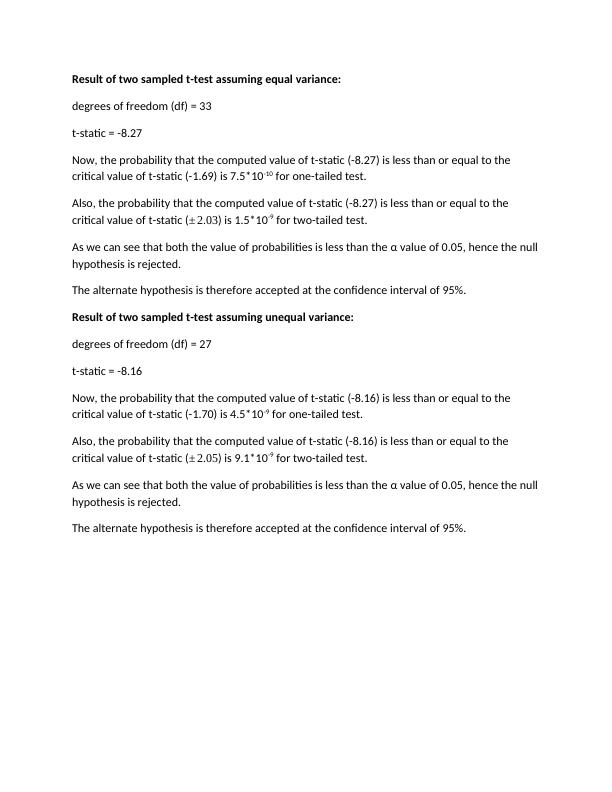
Ask a question from expert

Ask now

Case Study of The Nike Shoe Company

10 Pages1449 Words866 Views
   

Added on  2019-09-19

Case Study of The Nike Shoe Company

   Added on 2019-09-19

BookmarkShareRelated Documents
The Nyke Shoe CompanyIntroduction to the StudyThe Nyke shoe company has come up with a plan to save their company from financial instability which was evident due to some reasons. They have proposed a plan to make one sizeof shoes, regardless of gender and height and have asked us if they can change their business model to include only one size of shoes – regardless of height or gender of wearer. Moreover they have provided us with the data of random selected people. Different apt statistical testing will be used to determine that this move is feasible or not and conclusion will be made with the help of these statistical findings.Methods of the StudyThe data set of 35 random people containing 17 male entries and 18 female entries which is assumed to be normally distributed was analyzed. Descriptive statistics was applied to all the three data sets i.e. gender, male and female. The two data sets of male and female was later tested by a two sampled t-test with the assumption that both have equal variance. Then, it was again tested by two sampled t-test with the assumption that both have unequal variance. At last, null hypothesis was tested and conclusions will be made.FindingsTable A shows the descriptive statistics for the raw data set.Table B shows the descriptive statistics for the female data set.Table C shows the descriptive statistics for the male data set.From the table A:The data set contains 35 randomly selected entries of which 17 are of male and 18 of female. The minimum shoe size is 5.00 and maximum 14.00 this gives the range as 9.Mean = 9.14Mode = 7 (multiplicity of 5)Median = 9Standard Deviation = 2.58Variance = 6.67
Case Study of The Nike Shoe Company_1
From table B:The data set contains 18 entries of female. The minimum shoe size is 5.00 and maximum 10.00 this gives the range as 5.Mean = 7.11Mode = 6.5 and 7.5 (multiplicity of 4 each)Median = 7Standard Deviation = 1.13Variance = 1.28From table C:The data set contains 17 entries of male. The minimum shoe size is 7.00 and maximum 14.00 this gives the range as 7.Mean = 11.29Mode = 11 and 12 (multiplicity of 3 each)Median = 11Standard Deviation = 1.80Variance = 3.25The t-test was conducted on both the data sets of female and male because the number of samples was less than 30 for each group. In the two sampled t-test, α value was chosen to be 0.05.Null hypothesis:H0: female and male shoe sizes have equal meansAlternate Hypothesis:H1: female and male shoe sizes have unequal means
Case Study of The Nike Shoe Company_2
Result of two sampled t-test assuming equal variance:degrees of freedom (df) = 33t-static = -8.27Now, the probability that the computed value of t-static (-8.27) is less than or equal to the critical value of t-static (-1.69) is 7.5*10-10 for one-tailed test.Also, the probability that the computed value of t-static (-8.27) is less than or equal to the critical value of t-static (±2.03) is 1.5*10-9 for two-tailed test.As we can see that both the value of probabilities is less than the α value of 0.05, hence the nullhypothesis is rejected.The alternate hypothesis is therefore accepted at the confidence interval of 95%.Result of two sampled t-test assuming unequal variance:degrees of freedom (df) = 27t-static = -8.16Now, the probability that the computed value of t-static (-8.16) is less than or equal to the critical value of t-static (-1.70) is 4.5*10-9 for one-tailed test.Also, the probability that the computed value of t-static (-8.16) is less than or equal to the critical value of t-static (±2.05) is 9.1*10-9 for two-tailed test.As we can see that both the value of probabilities is less than the α value of 0.05, hence the nullhypothesis is rejected.The alternate hypothesis is therefore accepted at the confidence interval of 95%.
Case Study of The Nike Shoe Company_3

End of preview

Want to access all the pages? Upload your documents or become a member.

Related Documents
Statistical Tools and Techniques - Doc
|17
|2234
|21

Statistics Assignment - Substantive Significance
|8
|740
|68

Statistics: Confirmatory and Exploratory Analysis
|9
|1486
|41

Statistics: Analysis and Results
|6
|725
|66

Statistics - Two Sample t-test with Known and Unequal Variances
|6
|687
|236

Work Time Return in Knee Replacement & Interpretation
|17
|1865
|63