STAT6003: Statistical Analysis of Sydney Housing Market Case Study
VerifiedAdded on 2022/11/26
|10
|2238
|406
Case Study
AI Summary
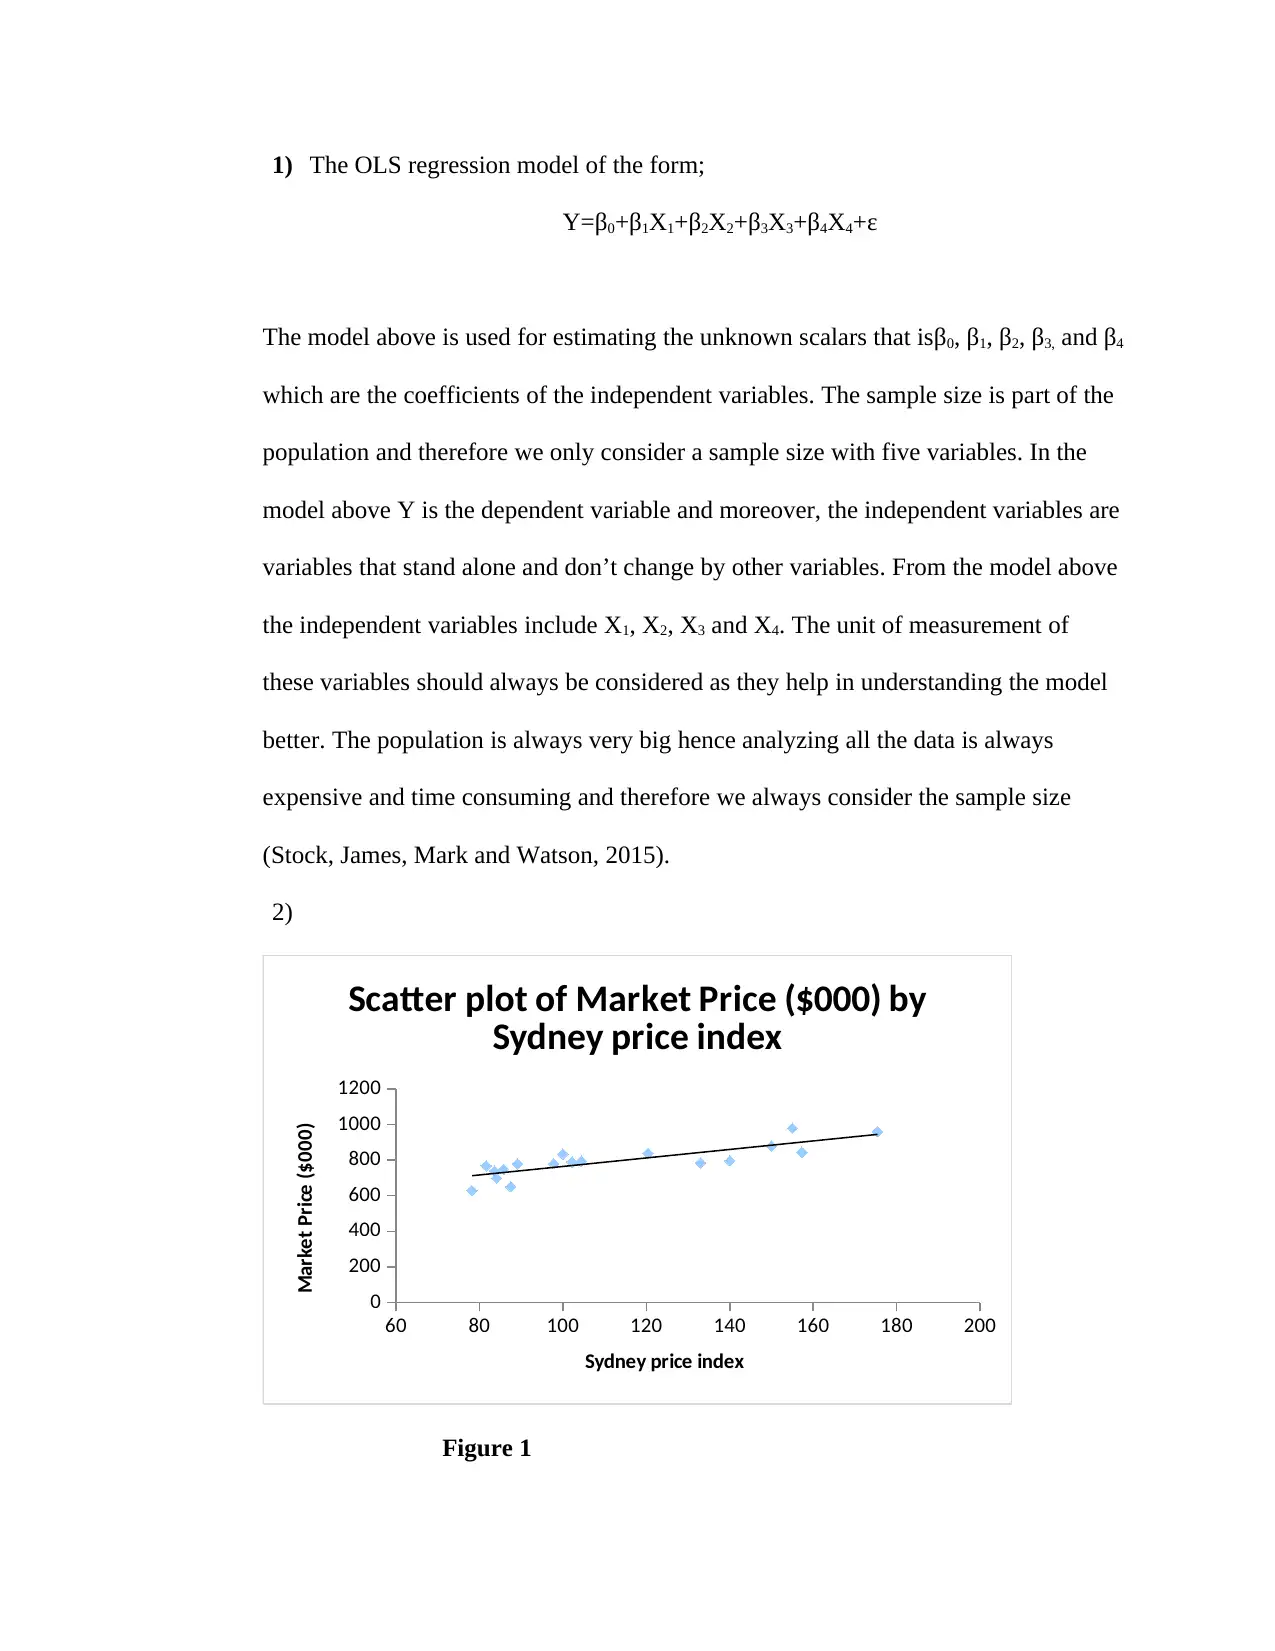
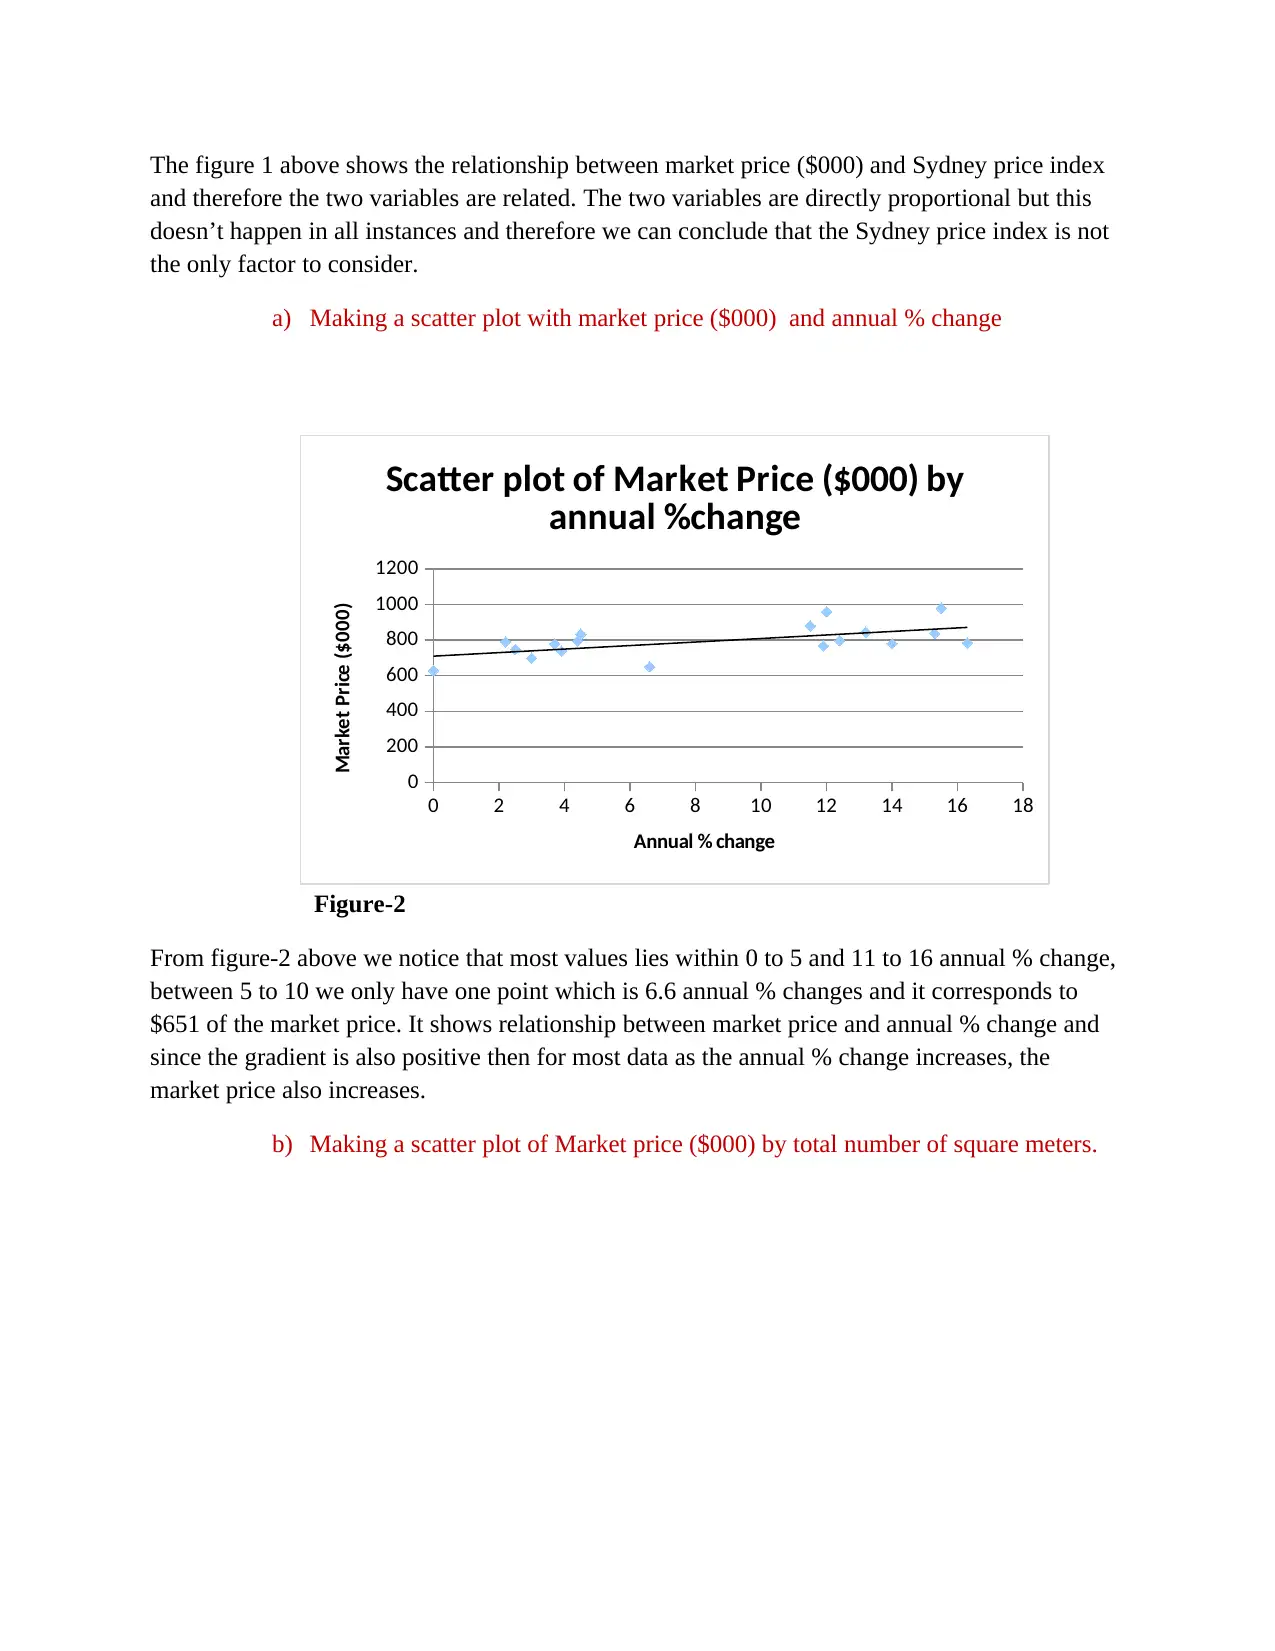
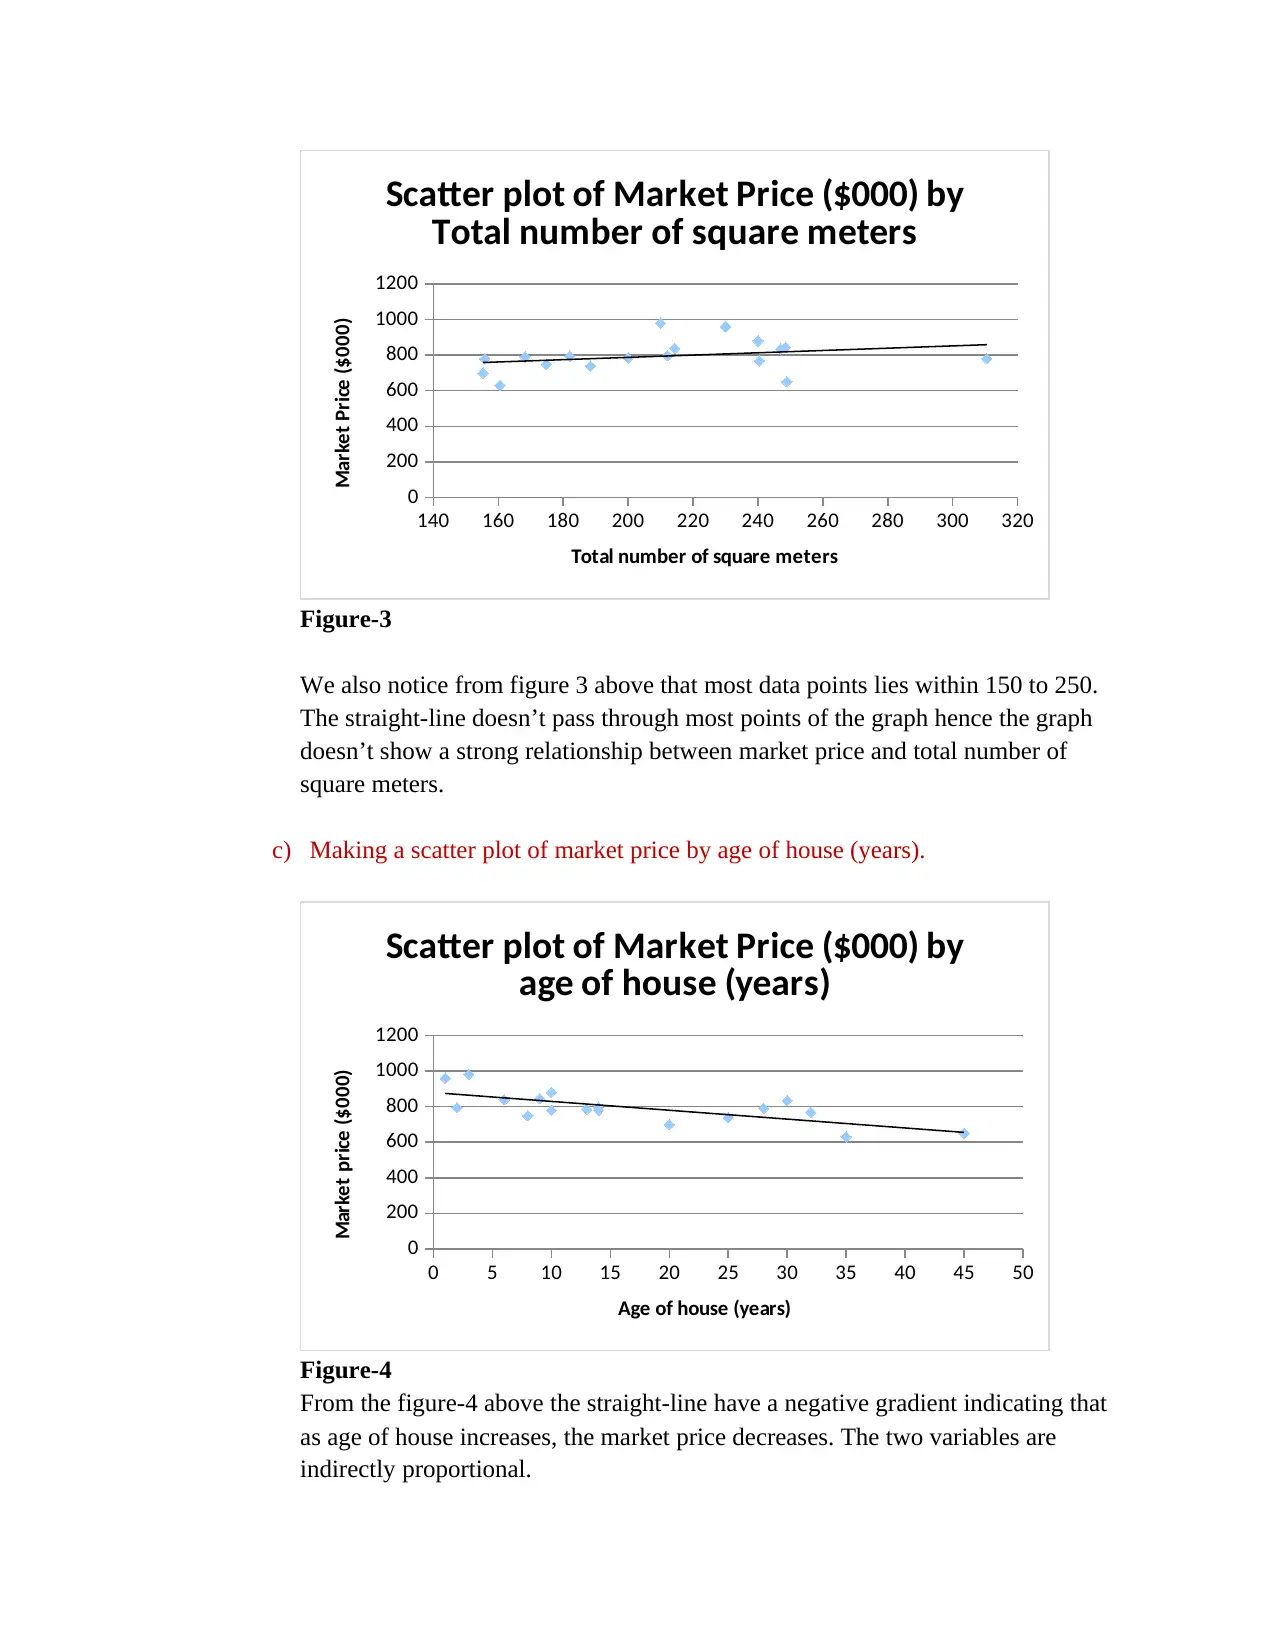
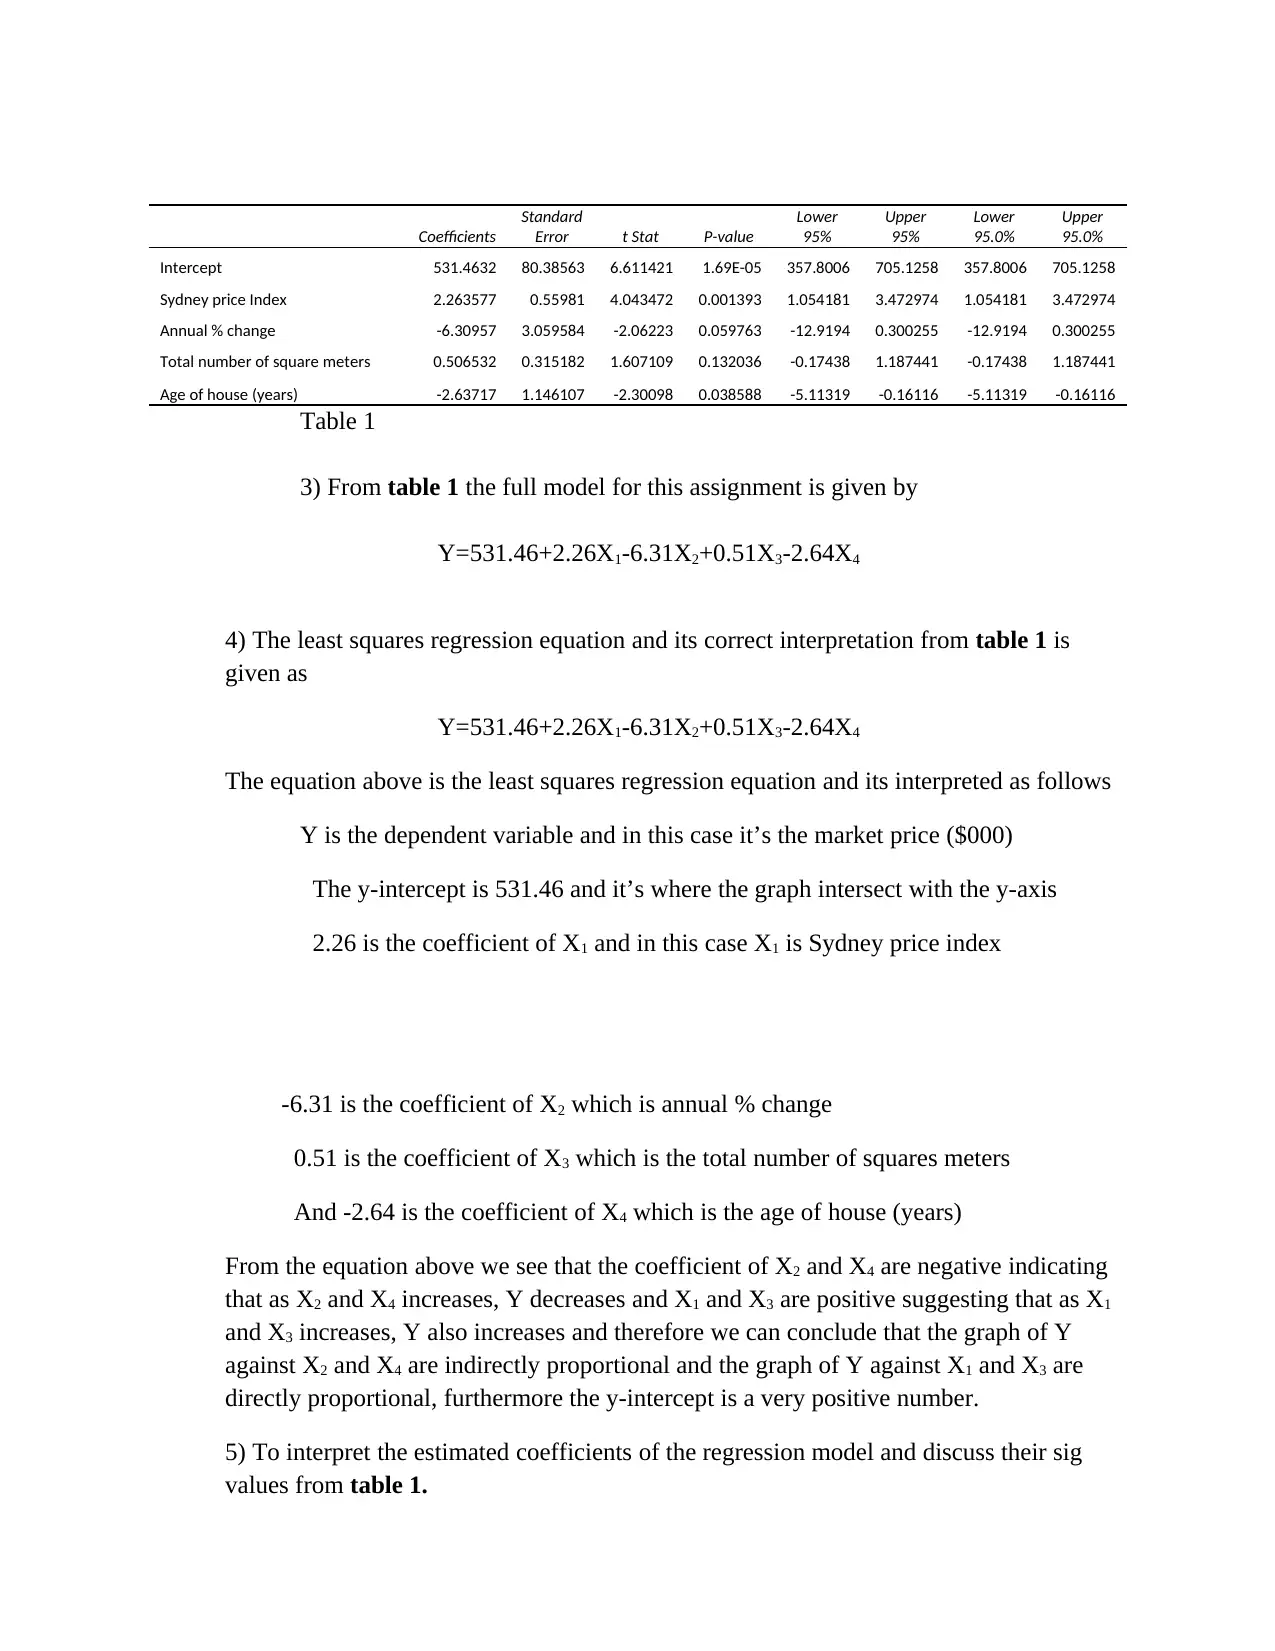
This case study analyzes the Sydney real estate market using multiple regression analysis. The assignment, for the STAT6003 course, explores the relationship between market prices and several independent variables including Sydney price index, annual percentage change, total number of square meters, and age of the house. The student develops and interprets an OLS regression model, examining coefficients, p-values, confidence intervals, and the coefficient of determination (R-squared) to assess the model's fit and the significance of each variable. The analysis includes scatter plots and interpretations of the relationships between variables. The study also compares the original model with re-estimated models, assessing how the removal of certain variables affects the overall explanatory power. The student also calculates and interprets the impact of total square meters on market price using the regression model. The student's analysis provides insights into the factors influencing house prices in the Sydney real estate market and the effectiveness of the regression models used. The student also provides an interpretation of the estimated coefficients of the regression model and discusses their sig values.
1 out of 10
Related Documents


Your All-in-One AI-Powered Toolkit for Academic Success.
+13062052269
info@desklib.com
Available 24*7 on WhatsApp / Email
![[object Object]](/_next/static/media/star-bottom.7253800d.svg)
Copyright © 2020–2026 A2Z Services. All Rights Reserved. Developed and managed by ZUCOL.