logo

Carbon Emission Disclosures of Firms and Climate Change Strategy

14 Pages2235 Words190 Views
   

Added on  2021-05-31

About This Document

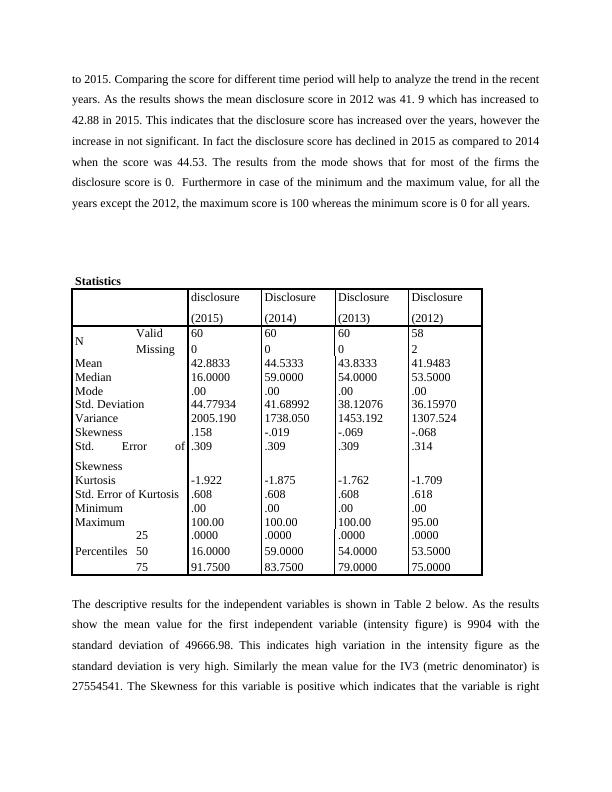
Similarly in the current research also the agency theory can be linked as the firms have more information related to its emission as compared to the regulators who have limited information. So, taking into account the agency theory, in the current research the impact of the various business strategies taken by the firms and its impact on the voluntary disclosure of the emission have been examined. The first descriptive statistics shows the results for the disclosure score of the selected firms for the time period 2012 to 2015.

Carbon Emission Disclosures of Firms and Climate Change Strategy

   Added on 2021-05-31

ShareRelated Documents
Agency theory The current research is aimed to examine the relationship between the voluntary disclosures ofthe carbon emission of the firms with the various business strategies taken by the firms towardsthe climate change. This relationship can be related to the agency theory. The original agenttheory which is also known as the principle agent problem, states that due to the asymmetricinformation where the agents have more information than the principles, there is conflict ofinterests. In this case the agents are the managers in the firms whereas the shareholders are theprinciples. Similarly in the current research also the agency theory can be linked as the firmshave more information related to its emission as compared to the regulators who have limitedinformation. So, taking into account the agency theory, in the current research the impact of thevarious business strategies taken by the firms and its impact on the voluntary disclosure of theemission have been examined. This will not only help the firms to improve their strategies toaddress the climate change but also allows the public and the regulators to know about thecurrent situation of emission in the firms.Data collectionFor the current research paper, the data was collected for the Australian firms. The sample size of60 firms has been taken into consideration and the firms were selected randomly. The datapreprocessing was performed prior to analyzing the data in SPSS. The missing data were codedas -99, the variables which were not useful for the research were removed from the data set. Aseparate excel sheet has been attached with the data set used for the current research. Data analysis (descriptive) Descriptive analysis is conducted before the inferential analysis in every research as thedescriptive statistics helps the researcher to examine whether the data collected is appropriate forthe research or not. In this case also the inferential analysis is one of the important part of theresearch, so the descriptive statistics has been conducted. The results from the descriptive statistics is shown in the table below. The first descriptivestatistics shows the results for the disclosure score of the selected firms for the time period 2012
Carbon Emission Disclosures of Firms and Climate Change Strategy_1
to 2015. Comparing the score for different time period will help to analyze the trend in the recentyears. As the results shows the mean disclosure score in 2012 was 41. 9 which has increased to42.88 in 2015. This indicates that the disclosure score has increased over the years, however theincrease in not significant. In fact the disclosure score has declined in 2015 as compared to 2014when the score was 44.53. The results from the mode shows that for most of the firms thedisclosure score is 0. Furthermore in case of the minimum and the maximum value, for all theyears except the 2012, the maximum score is 100 whereas the minimum score is 0 for all years. Statisticsdisclosure(2015)Disclosure(2014)Disclosure(2013)Disclosure(2012)NValid60606058Missing0002Mean42.883344.533343.833341.9483Median16.000059.000054.000053.5000Mode.00.00.00.00Std. Deviation44.7793441.6899238.1207636.15970Variance2005.1901738.0501453.1921307.524Skewness.158-.019-.069-.068Std. Error ofSkewness.309.309.309.314Kurtosis-1.922-1.875-1.762-1.709Std. Error of Kurtosis.608.608.608.618Minimum.00.00.00.00Maximum100.00100.00100.0095.00Percentiles25.0000.0000.0000.00005016.000059.000054.000053.50007591.750083.750079.000075.0000The descriptive results for the independent variables is shown in Table 2 below. As the resultsshow the mean value for the first independent variable (intensity figure) is 9904 with thestandard deviation of 49666.98. This indicates high variation in the intensity figure as thestandard deviation is very high. Similarly the mean value for the IV3 (metric denominator) is27554541. The Skewness for this variable is positive which indicates that the variable is right
Carbon Emission Disclosures of Firms and Climate Change Strategy_2
skewed or most of the data set are higher than the series average. Results for the IV5 is alsoshown in the table below, which shows the average value of 4.95 with standard deviation of 8.9. StatisticsIV1IV3IV5NValid262626Missing343434Mean9904.1930275524541.36698.1762Median3.340011614.50004.9500Mode.00.003.00aStd. Deviation49666.983281392667669.742498.91552Variance2466809228.4761939523238345974780.00079.487Skewness5.0985.0991.862Std. Error ofSkewness.456.456.456Kurtosis25.99625.9984.084Std. Error of Kurtosis.887.887.887Minimum.00.00.00Maximum253408.007103500000.0038.00Percentiles25.17931421.49251.8700503.340011614.50004.950075132.85001203557.250013.9500a. Multiple modes exist. The smallest value is shownHistograms Furthermore the histograms of the dependent variable has also been show, which shows thedistribution of the variable. The dependent variable in the current research is the disclosure scoreand the histogram for all the years have been shown differently.
Carbon Emission Disclosures of Firms and Climate Change Strategy_3
Except for the firms who have 0 score most of the data is right skewed. This shows thatdisclosure score is either 0, or higher than the average value. Similar trend is shown for the year2014 also.
Carbon Emission Disclosures of Firms and Climate Change Strategy_4

End of preview

Want to access all the pages? Upload your documents or become a member.

Related Documents
MGT723 Research Project PDF
|11
|1870
|33

MGT723 Research Project on Data Collection
|8
|1755
|90

Statistical Data Collection and Interpretation Assignment PDF
|19
|3667
|27

Data collection Assignment PDF
|8
|1681
|100

Impact of Incentives on Carbon Disclosure Score
|6
|1458
|251

Climate Change Integration into Business Strategy for Carbon Emission Reduction
|20
|5042
|305