Statistics for Analytical Decisions: University Data Analysis Homework
VerifiedAdded on 2020/02/24
|6
|681
|39
Homework Assignment
AI Summary
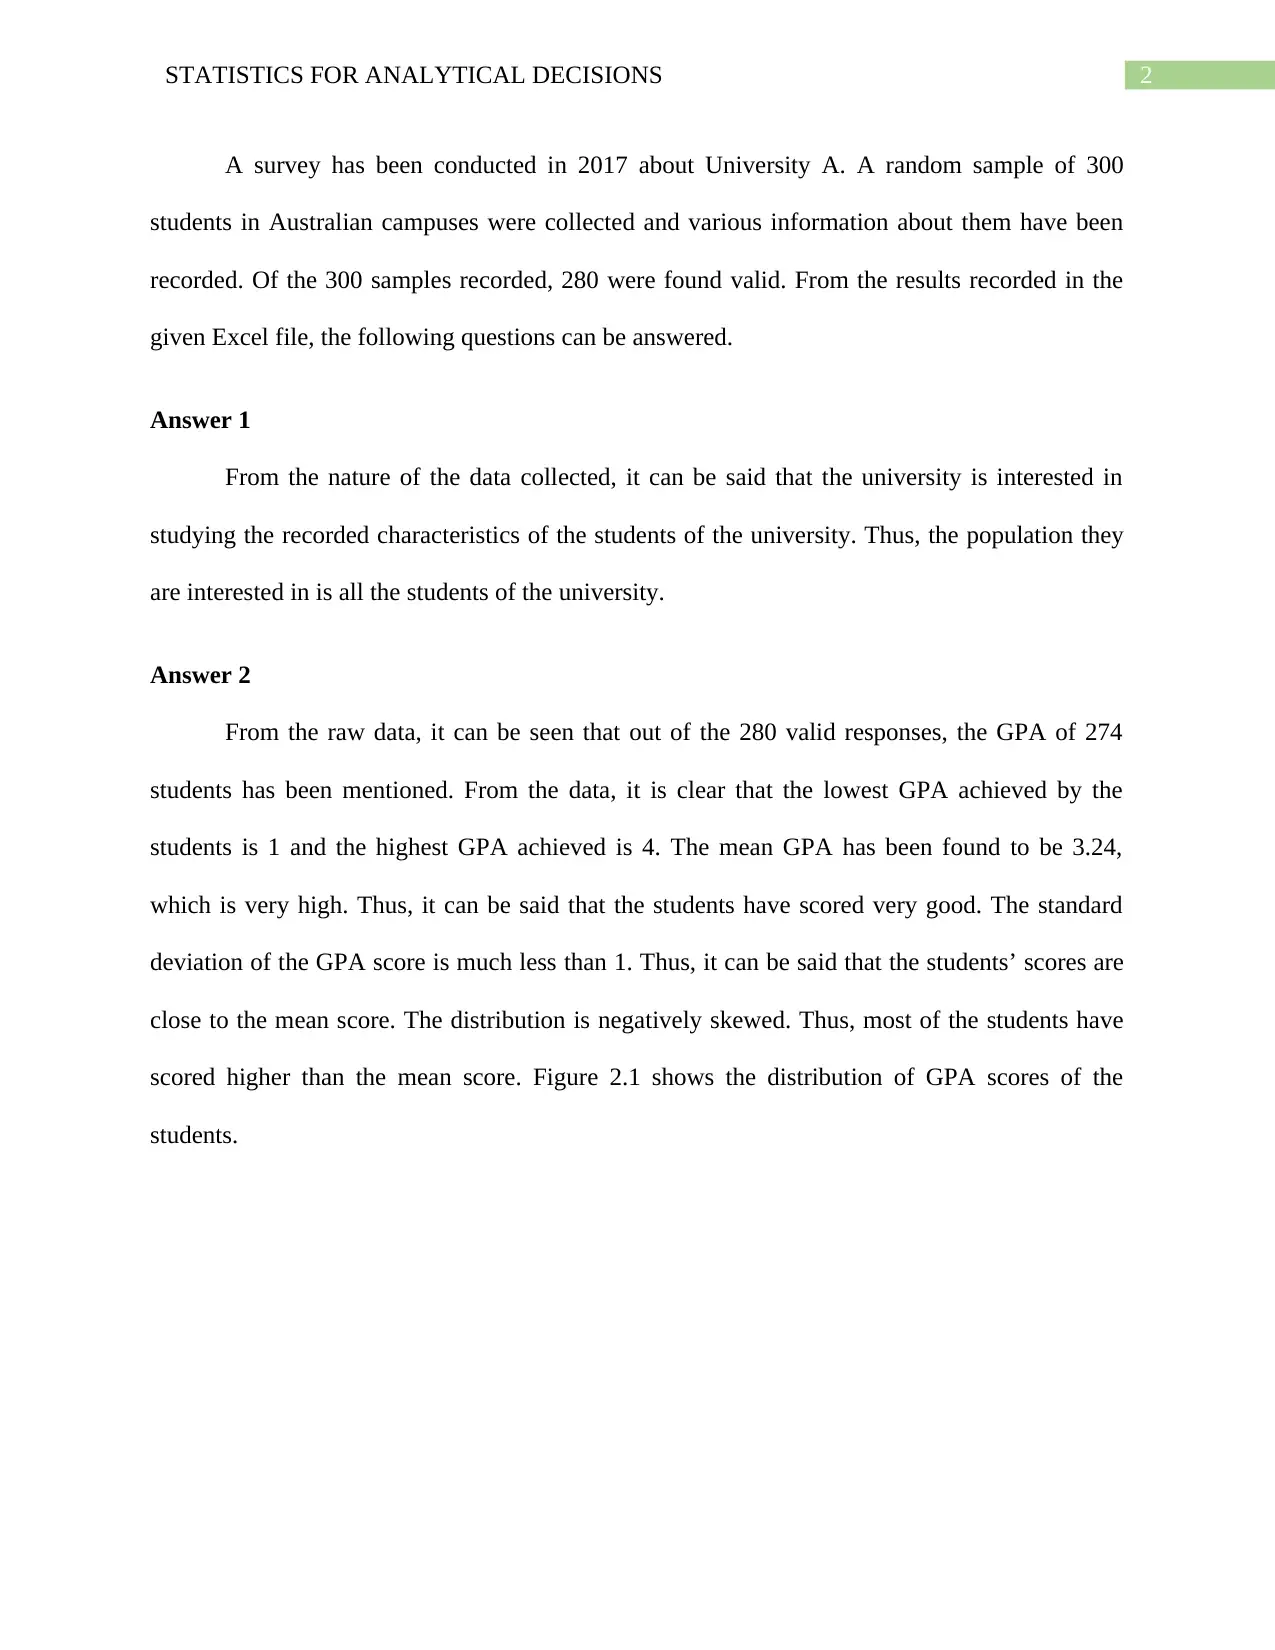
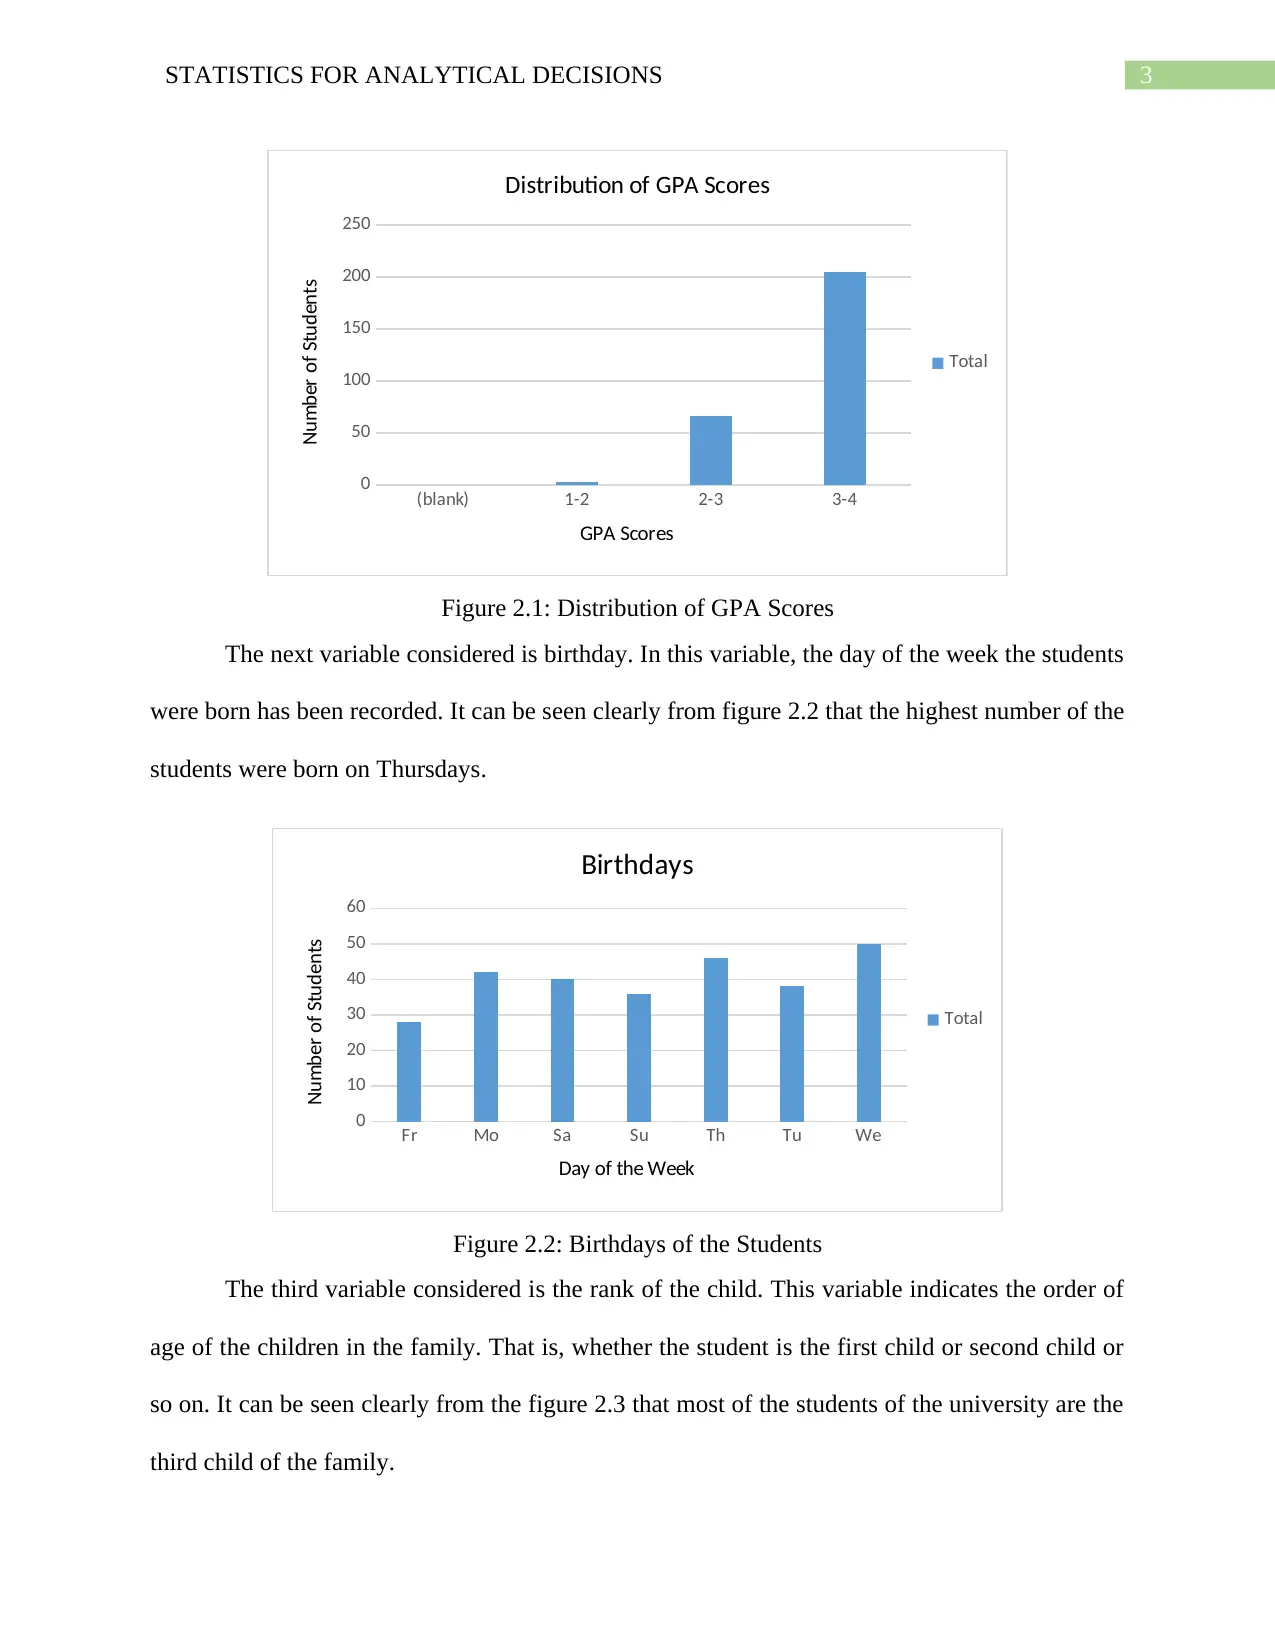
This assignment focuses on analyzing data collected from a survey conducted at University A. The student analyzes a random sample of 300 students, with 280 valid responses, examining variables such as GPA, birthdates, and family rank. The analysis includes calculating descriptive statistics like mean and standard deviation for GPA, visualizing data distributions, and conducting a Z-test to compare the proportion of rural students between 2016 and 2017. The student interprets the results, drawing conclusions about student performance, birthday distributions, and changes in the proportion of rural students. The assignment demonstrates an understanding of statistical concepts and their application to real-world data analysis, including hypothesis testing and data interpretation.

Running Head: STATISTICS FOR ANALYTICAL DECISIONS
Statistics for Analytical Decisions
Name of the Student
Name of the University
Author Note
Statistics for Analytical Decisions
Name of the Student
Name of the University
Author Note
Paraphrase This Document
Need a fresh take? Get an instant paraphrase of this document with our AI Paraphraser

1STATISTICS FOR ANALYTICAL DECISIONS
Table of Contents
Answer 1..........................................................................................................................................2
Answer 2..........................................................................................................................................2
Answer 3..........................................................................................................................................4

2STATISTICS FOR ANALYTICAL DECISIONS
A survey has been conducted in 2017 about University A. A random sample of 300
students in Australian campuses were collected and various information about them have been
recorded. Of the 300 samples recorded, 280 were found valid. From the results recorded in the
given Excel file, the following questions can be answered.
Answer 1
From the nature of the data collected, it can be said that the university is interested in
studying the recorded characteristics of the students of the university. Thus, the population they
are interested in is all the students of the university.
Answer 2
From the raw data, it can be seen that out of the 280 valid responses, the GPA of 274
students has been mentioned. From the data, it is clear that the lowest GPA achieved by the
students is 1 and the highest GPA achieved is 4. The mean GPA has been found to be 3.24,
which is very high. Thus, it can be said that the students have scored very good. The standard
deviation of the GPA score is much less than 1. Thus, it can be said that the students’ scores are
close to the mean score. The distribution is negatively skewed. Thus, most of the students have
scored higher than the mean score. Figure 2.1 shows the distribution of GPA scores of the
students.
⊘ This is a preview!⊘
Do you want full access?
Subscribe today to unlock all pages.

Trusted by 1+ million students worldwide

3STATISTICS FOR ANALYTICAL DECISIONS
(blank) 1-2 2-3 3-4
0
50
100
150
200
250
Distribution of GPA Scores
Total
GPA Scores
Number of Students
Figure 2.1: Distribution of GPA Scores
The next variable considered is birthday. In this variable, the day of the week the students
were born has been recorded. It can be seen clearly from figure 2.2 that the highest number of the
students were born on Thursdays.
Fr Mo Sa Su Th Tu We
0
10
20
30
40
50
60
Birthdays
Total
Day of the Week
Number of Students
Figure 2.2: Birthdays of the Students
The third variable considered is the rank of the child. This variable indicates the order of
age of the children in the family. That is, whether the student is the first child or second child or
so on. It can be seen clearly from the figure 2.3 that most of the students of the university are the
third child of the family.
Paraphrase This Document
Need a fresh take? Get an instant paraphrase of this document with our AI Paraphraser

4STATISTICS FOR ANALYTICAL DECISIONS
1 2 3 4 5 6 7
0
50
100
150
200
250
Rank of Children in the Family
Total
Child Rank
Number of Children
Figure 2.3: Rank of Children in the Family
Answer 3
The University had also conducted the same survey in 2016, the previous year. The
proportion of rural students in that year has been found to be 0.20. The test of proportion has
been done again for the year 2017. The test has been done using a z-test as this is the most
appropriate test to compare the proportions. In this case, it has to be tested whether the
proportion of rural students increased or decreased in 2017 from 2016.
The null hypothesis (H0) and the alternate hypothesis (HA) has been defined as
H0: The sample proportion is greater than or equal to 20%
HA: The sample proportion is less than 20%
From the results of the analysis (table 3.1) it can be seen that the null hypothesis has been
accepted. Thus, it can be said that the proportion of rural students has increased in 2017 from
2016.
Table 3.1: Z-test results

5STATISTICS FOR ANALYTICAL DECISIONS
Hypothesis Test for π
Hypotheses
Null Hypothesis H0: π ≥ 20%
Alternative Hypothesis HA: π < 20%
Test Type Lower
Level of significance
alpha α set
to: 0.05
Critical Region
Critical Value
-
1.6449
Sample Data
Sample Size 280
Count of 'Successes' 50
Sample proportion, p
17.86
%
Standard Error 2.39%
z Sample Statistic
-
0.8964
p-value 0.1850
Assumptions: n.π=56,
n.π=224 MET
Hypothesis test decision:
Fail to reject the Null Hypothesis
⊘ This is a preview!⊘
Do you want full access?
Subscribe today to unlock all pages.

Trusted by 1+ million students worldwide
1 out of 6
Related Documents

Your All-in-One AI-Powered Toolkit for Academic Success.
+13062052269
info@desklib.com
Available 24*7 on WhatsApp / Email
Unlock your academic potential
© 2024 | Zucol Services PVT LTD | All rights reserved.