Analysis of TB Trends and Risk Factors in Namibian Healthcare Workers
VerifiedAdded on 2020/10/22
|15
|6495
|213
Report
AI Summary
This report presents the results of a study investigating TB trends and associated risk factors among healthcare workers in Namibia from 2013 to 2017. The study included 152 participants, with a majority being female nurses aged 20-39. Data analysis revealed TB case trends, with the highest number of diagnoses in 2015 and an overall decline from 2013 to 2017. The report evaluates various risk factors, including work practices, personal protective equipment (PPE), administrative controls, and environmental controls. Key findings indicate that while awareness of occupational TB risk is high, the consistent use of PPE, particularly masks and proper respirator fit testing, is lacking. The report also highlights deficiencies in administrative and environmental controls, such as access to rapid diagnostic tests and the availability of UVGI units. Overall, the study underscores the need for improved TB prevention and control measures within Namibian healthcare facilities, focusing on enhancing PPE use, improving administrative controls, and implementing environmental safeguards to protect healthcare workers from TB exposure.
CHAPTER 4: RESULTS
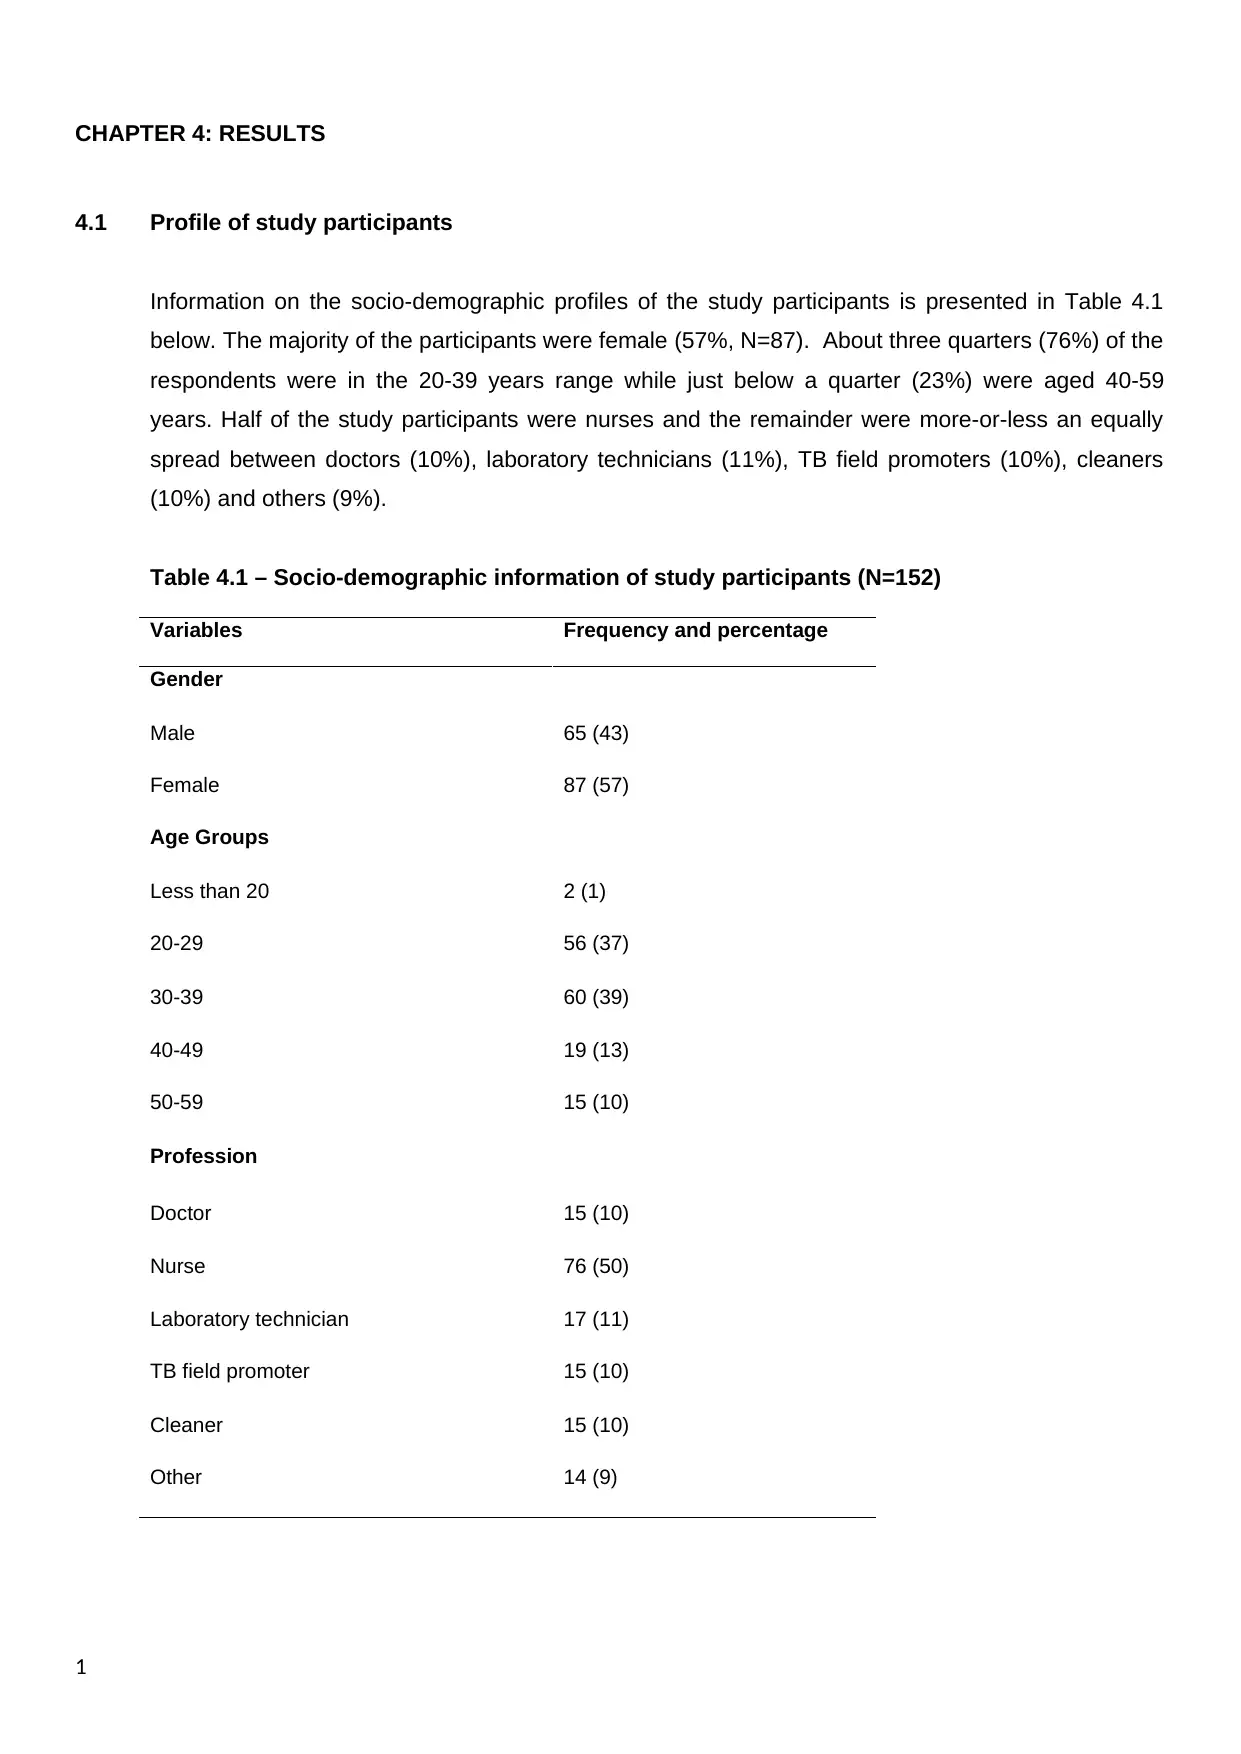
4.1 Profile of study participants
Information on the socio-demographic profiles of the study participants is presented in Table 4.1
below. The majority of the participants were female (57%, N=87). About three quarters (76%) of the
respondents were in the 20-39 years range while just below a quarter (23%) were aged 40-59
years. Half of the study participants were nurses and the remainder were more-or-less an equally
spread between doctors (10%), laboratory technicians (11%), TB field promoters (10%), cleaners
(10%) and others (9%).
Table 4.1 – Socio-demographic information of study participants (N=152)
Variables Frequency and percentage
Gender
Male 65 (43)
Female 87 (57)
Age Groups
Less than 20 2 (1)
20-29 56 (37)
30-39 60 (39)
40-49 19 (13)
50-59 15 (10)
Profession
Doctor 15 (10)
Nurse 76 (50)
Laboratory technician 17 (11)
TB field promoter 15 (10)
Cleaner 15 (10)
Other 14 (9)
1
Paraphrase This Document
Need a fresh take? Get an instant paraphrase of this document with our AI Paraphraser
4.2 TB trends among Healthcare Workers
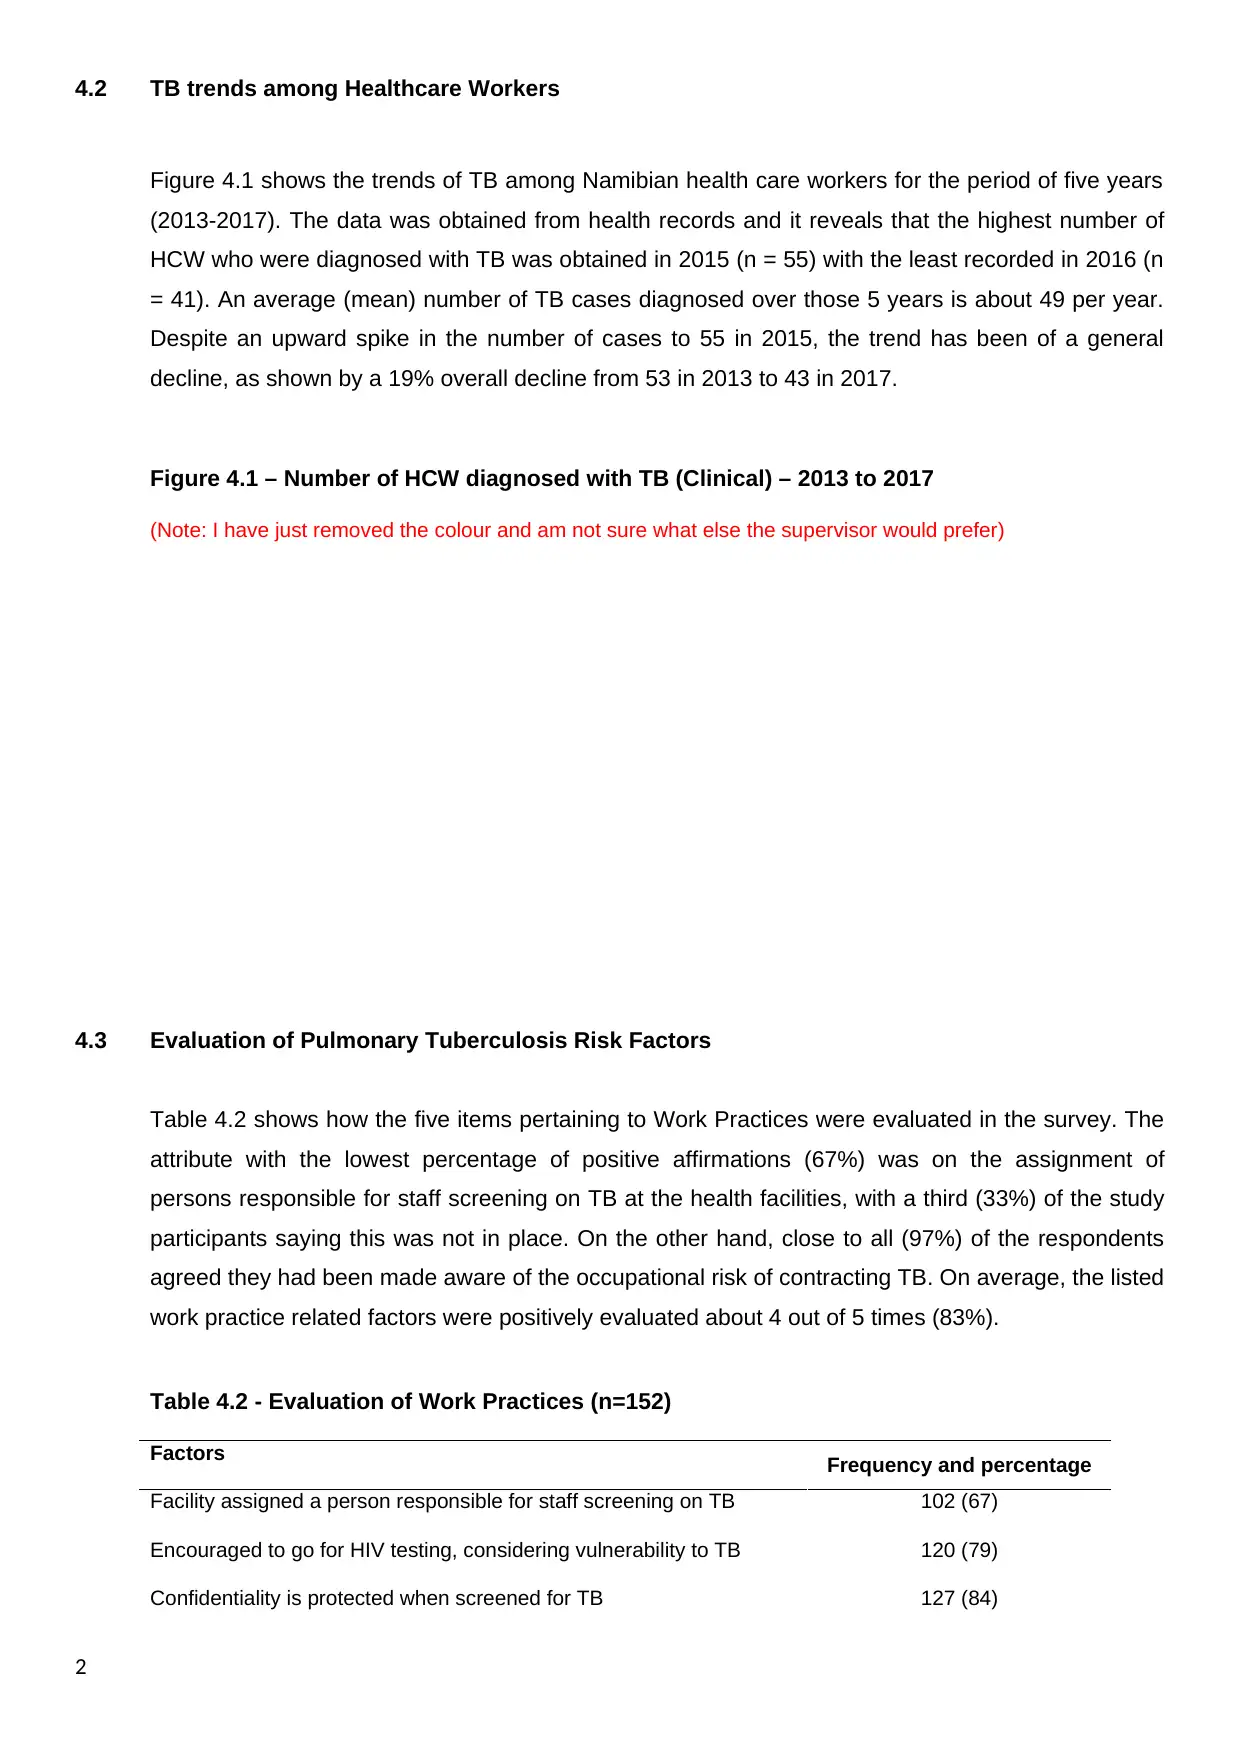
Figure 4.1 shows the trends of TB among Namibian health care workers for the period of five years
(2013-2017). The data was obtained from health records and it reveals that the highest number of
HCW who were diagnosed with TB was obtained in 2015 (n = 55) with the least recorded in 2016 (n
= 41). An average (mean) number of TB cases diagnosed over those 5 years is about 49 per year.
Despite an upward spike in the number of cases to 55 in 2015, the trend has been of a general
decline, as shown by a 19% overall decline from 53 in 2013 to 43 in 2017.
Figure 4.1 – Number of HCW diagnosed with TB (Clinical) – 2013 to 2017
(Note: I have just removed the colour and am not sure what else the supervisor would prefer)
4.3 Evaluation of Pulmonary Tuberculosis Risk Factors
Table 4.2 shows how the five items pertaining to Work Practices were evaluated in the survey. The
attribute with the lowest percentage of positive affirmations (67%) was on the assignment of
persons responsible for staff screening on TB at the health facilities, with a third (33%) of the study
participants saying this was not in place. On the other hand, close to all (97%) of the respondents
agreed they had been made aware of the occupational risk of contracting TB. On average, the listed
work practice related factors were positively evaluated about 4 out of 5 times (83%).
Table 4.2 - Evaluation of Work Practices (n=152)
Factors Frequency and percentage
Facility assigned a person responsible for staff screening on TB 102 (67)
Encouraged to go for HIV testing, considering vulnerability to TB 120 (79)
Confidentiality is protected when screened for TB 127 (84)
2
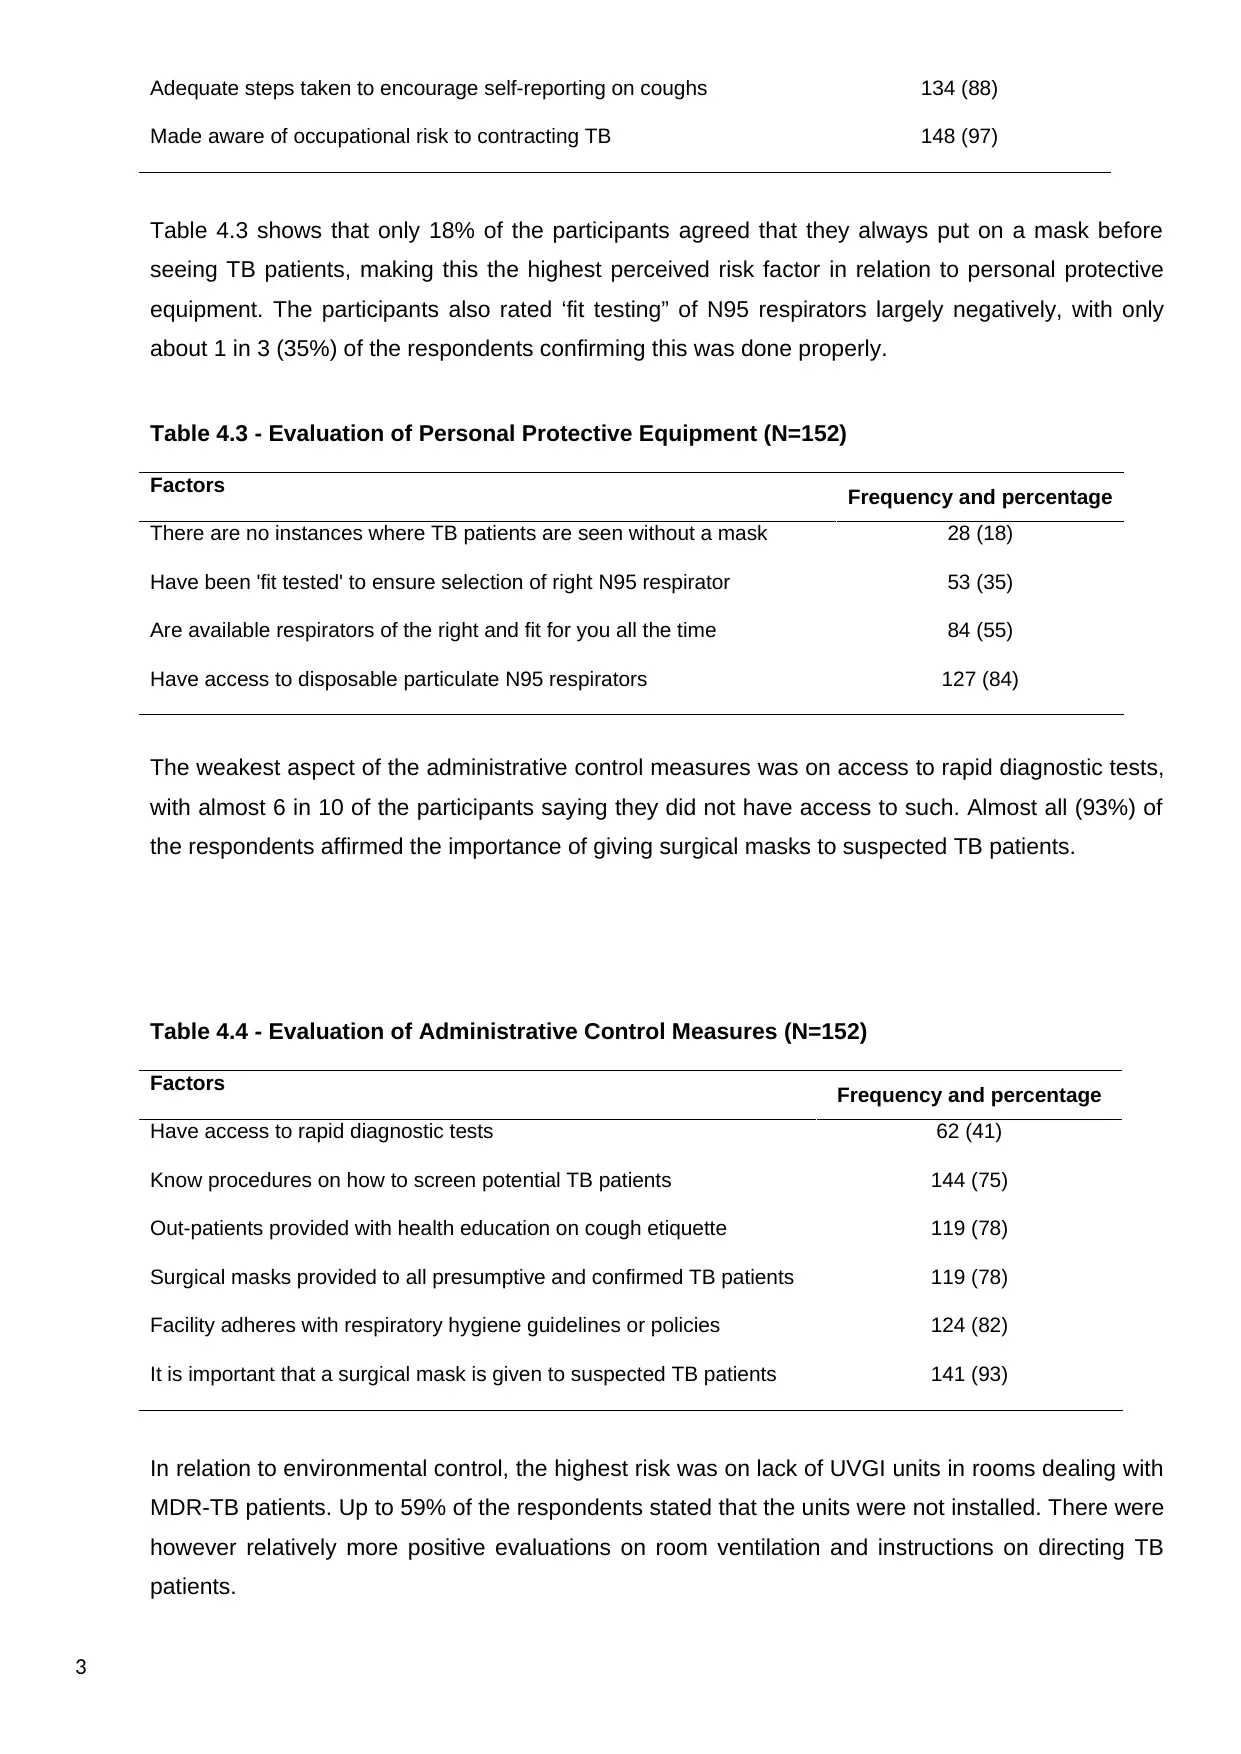
Adequate steps taken to encourage self-reporting on coughs 134 (88)
Made aware of occupational risk to contracting TB 148 (97)
Table 4.3 shows that only 18% of the participants agreed that they always put on a mask before
seeing TB patients, making this the highest perceived risk factor in relation to personal protective
equipment. The participants also rated ‘fit testing” of N95 respirators largely negatively, with only
about 1 in 3 (35%) of the respondents confirming this was done properly.
Table 4.3 - Evaluation of Personal Protective Equipment (N=152)
Factors Frequency and percentage
There are no instances where TB patients are seen without a mask 28 (18)
Have been 'fit tested' to ensure selection of right N95 respirator 53 (35)
Are available respirators of the right and fit for you all the time 84 (55)
Have access to disposable particulate N95 respirators 127 (84)
The weakest aspect of the administrative control measures was on access to rapid diagnostic tests,
with almost 6 in 10 of the participants saying they did not have access to such. Almost all (93%) of
the respondents affirmed the importance of giving surgical masks to suspected TB patients.
Table 4.4 - Evaluation of Administrative Control Measures (N=152)
Factors Frequency and percentage
Have access to rapid diagnostic tests 62 (41)
Know procedures on how to screen potential TB patients 144 (75)
Out-patients provided with health education on cough etiquette 119 (78)
Surgical masks provided to all presumptive and confirmed TB patients 119 (78)
Facility adheres with respiratory hygiene guidelines or policies 124 (82)
It is important that a surgical mask is given to suspected TB patients 141 (93)
In relation to environmental control, the highest risk was on lack of UVGI units in rooms dealing with
MDR-TB patients. Up to 59% of the respondents stated that the units were not installed. There were
however relatively more positive evaluations on room ventilation and instructions on directing TB
patients.
3
⊘ This is a preview!⊘
Do you want full access?
Subscribe today to unlock all pages.
Trusted by 1+ million students worldwide
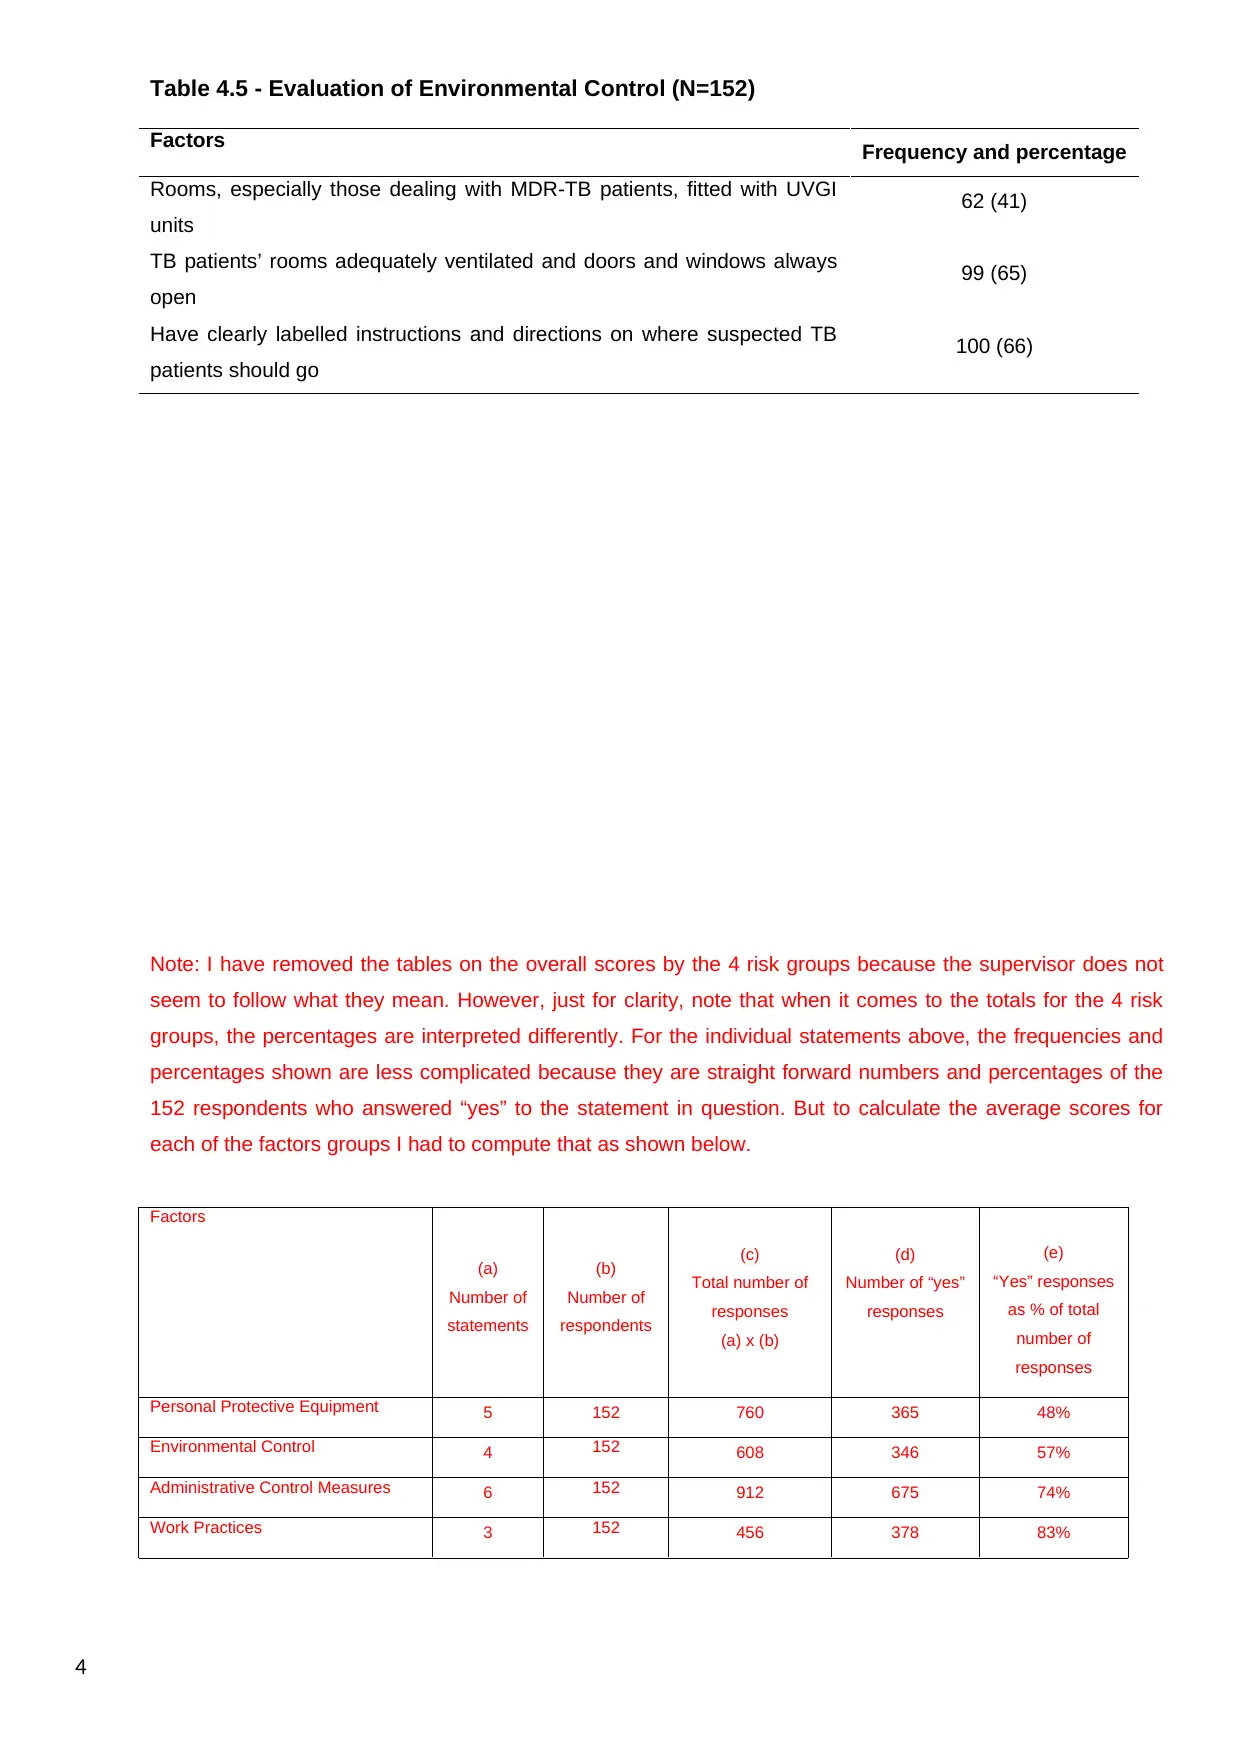
Table 4.5 - Evaluation of Environmental Control (N=152)
Factors Frequency and percentage
Rooms, especially those dealing with MDR-TB patients, fitted with UVGI
units
62 (41)
TB patients’ rooms adequately ventilated and doors and windows always
open
99 (65)
Have clearly labelled instructions and directions on where suspected TB
patients should go
100 (66)
Note: I have removed the tables on the overall scores by the 4 risk groups because the supervisor does not
seem to follow what they mean. However, just for clarity, note that when it comes to the totals for the 4 risk
groups, the percentages are interpreted differently. For the individual statements above, the frequencies and
percentages shown are less complicated because they are straight forward numbers and percentages of the
152 respondents who answered “yes” to the statement in question. But to calculate the average scores for
each of the factors groups I had to compute that as shown below.
Factors
(a)
Number of
statements
(b)
Number of
respondents
(c)
Total number of
responses
(a) x (b)
(d)
Number of “yes”
responses
(e)
“Yes” responses
as % of total
number of
responses
Personal Protective Equipment 5 152 760 365 48%
Environmental Control 4 152 608 346 57%
Administrative Control Measures 6 152 912 675 74%
Work Practices 3 152 456 378 83%
4
Paraphrase This Document
Need a fresh take? Get an instant paraphrase of this document with our AI Paraphraser
The percentage shown in column (e) does not represent the percentage of participants who said “yes”.
Instead it is the percentage of the number of times a “yes” response was given when one looks across all the
statements belonging to that risk group. For example, for personal protective equipment, there were 5
statements each answered by 152 respondents and thus giving a total of 760 responses. Out of those 760
responses, 365 were “yes” answers (i.e. the other 295 were “no”). Therefore, the rate of “yes” responses was
365/760 (i.e. 0.48 or 48%). Because 0.48 is a rate, I then did the comparisons using ANOVA rather than Chi-
square. Like I said in my earlier email, this was the best way of computing total evaluation scores by the
broader risk groups (which I imagined was also required over and above reporting just the categorial yes/no
results for the individual statements). The only other way to get overall scores would have been if the
respondents had been asked directly during the survey to answer yes/no to the overall situation pertaining to
each of the 4 risks groups (e.g. “Taking everything into account, all issues pertaining to personal protective
equipment are provided for sufficiently at the heath facility” – yes/no). In that case the answers would have
been categorical, and the comparisons done using Chi-square. I have since deleted all the ANOVA tables to
keep things simple and am just providing the explanation below in case you would still want to use it.
5
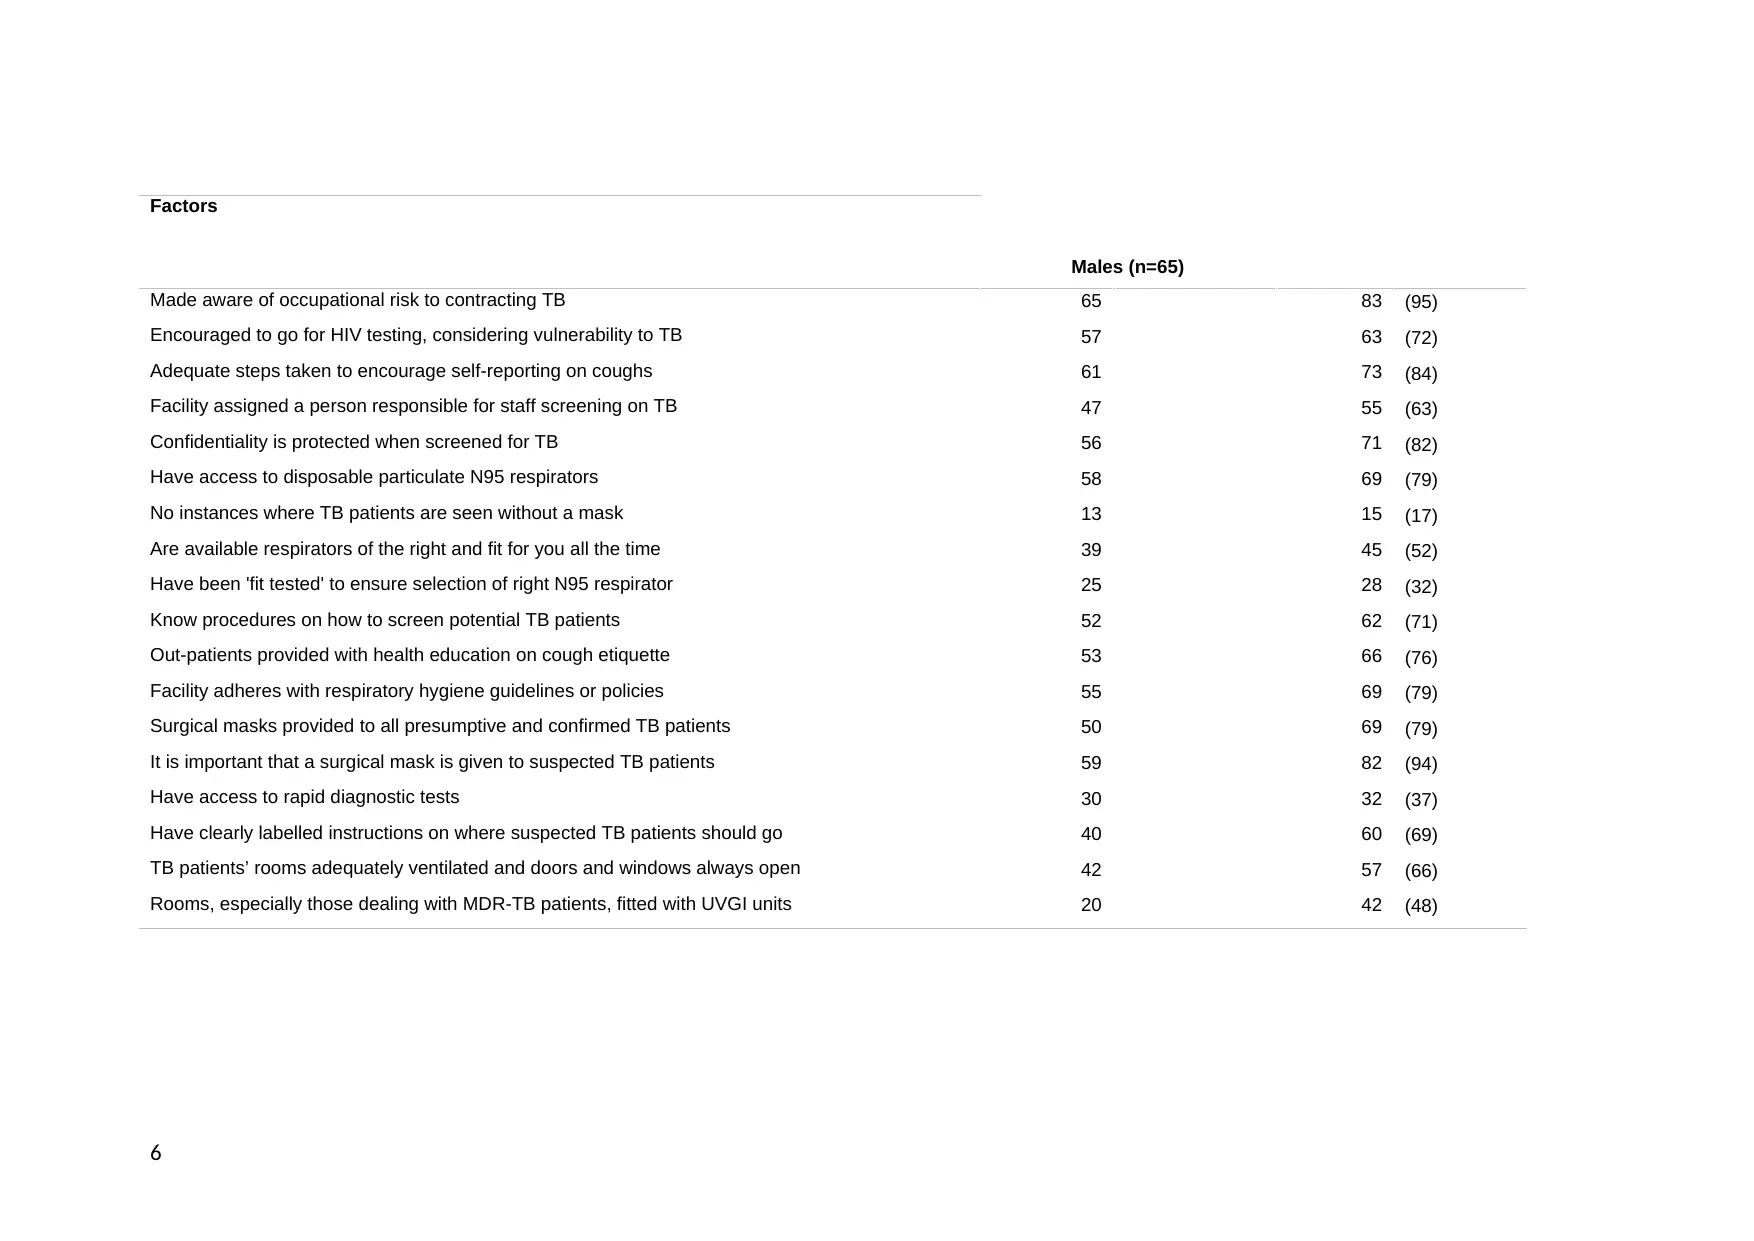
Factors
Males (n=65)
Made aware of occupational risk to contracting TB 65 83 (95)
Encouraged to go for HIV testing, considering vulnerability to TB 57 63 (72)
Adequate steps taken to encourage self-reporting on coughs 61 73 (84)
Facility assigned a person responsible for staff screening on TB 47 55 (63)
Confidentiality is protected when screened for TB 56 71 (82)
Have access to disposable particulate N95 respirators 58 69 (79)
No instances where TB patients are seen without a mask 13 15 (17)
Are available respirators of the right and fit for you all the time 39 45 (52)
Have been 'fit tested' to ensure selection of right N95 respirator 25 28 (32)
Know procedures on how to screen potential TB patients 52 62 (71)
Out-patients provided with health education on cough etiquette 53 66 (76)
Facility adheres with respiratory hygiene guidelines or policies 55 69 (79)
Surgical masks provided to all presumptive and confirmed TB patients 50 69 (79)
It is important that a surgical mask is given to suspected TB patients 59 82 (94)
Have access to rapid diagnostic tests 30 32 (37)
Have clearly labelled instructions on where suspected TB patients should go 40 60 (69)
TB patients’ rooms adequately ventilated and doors and windows always open 42 57 (66)
Rooms, especially those dealing with MDR-TB patients, fitted with UVGI units 20 42 (48)
6
⊘ This is a preview!⊘
Do you want full access?
Subscribe today to unlock all pages.
Trusted by 1+ million students worldwide
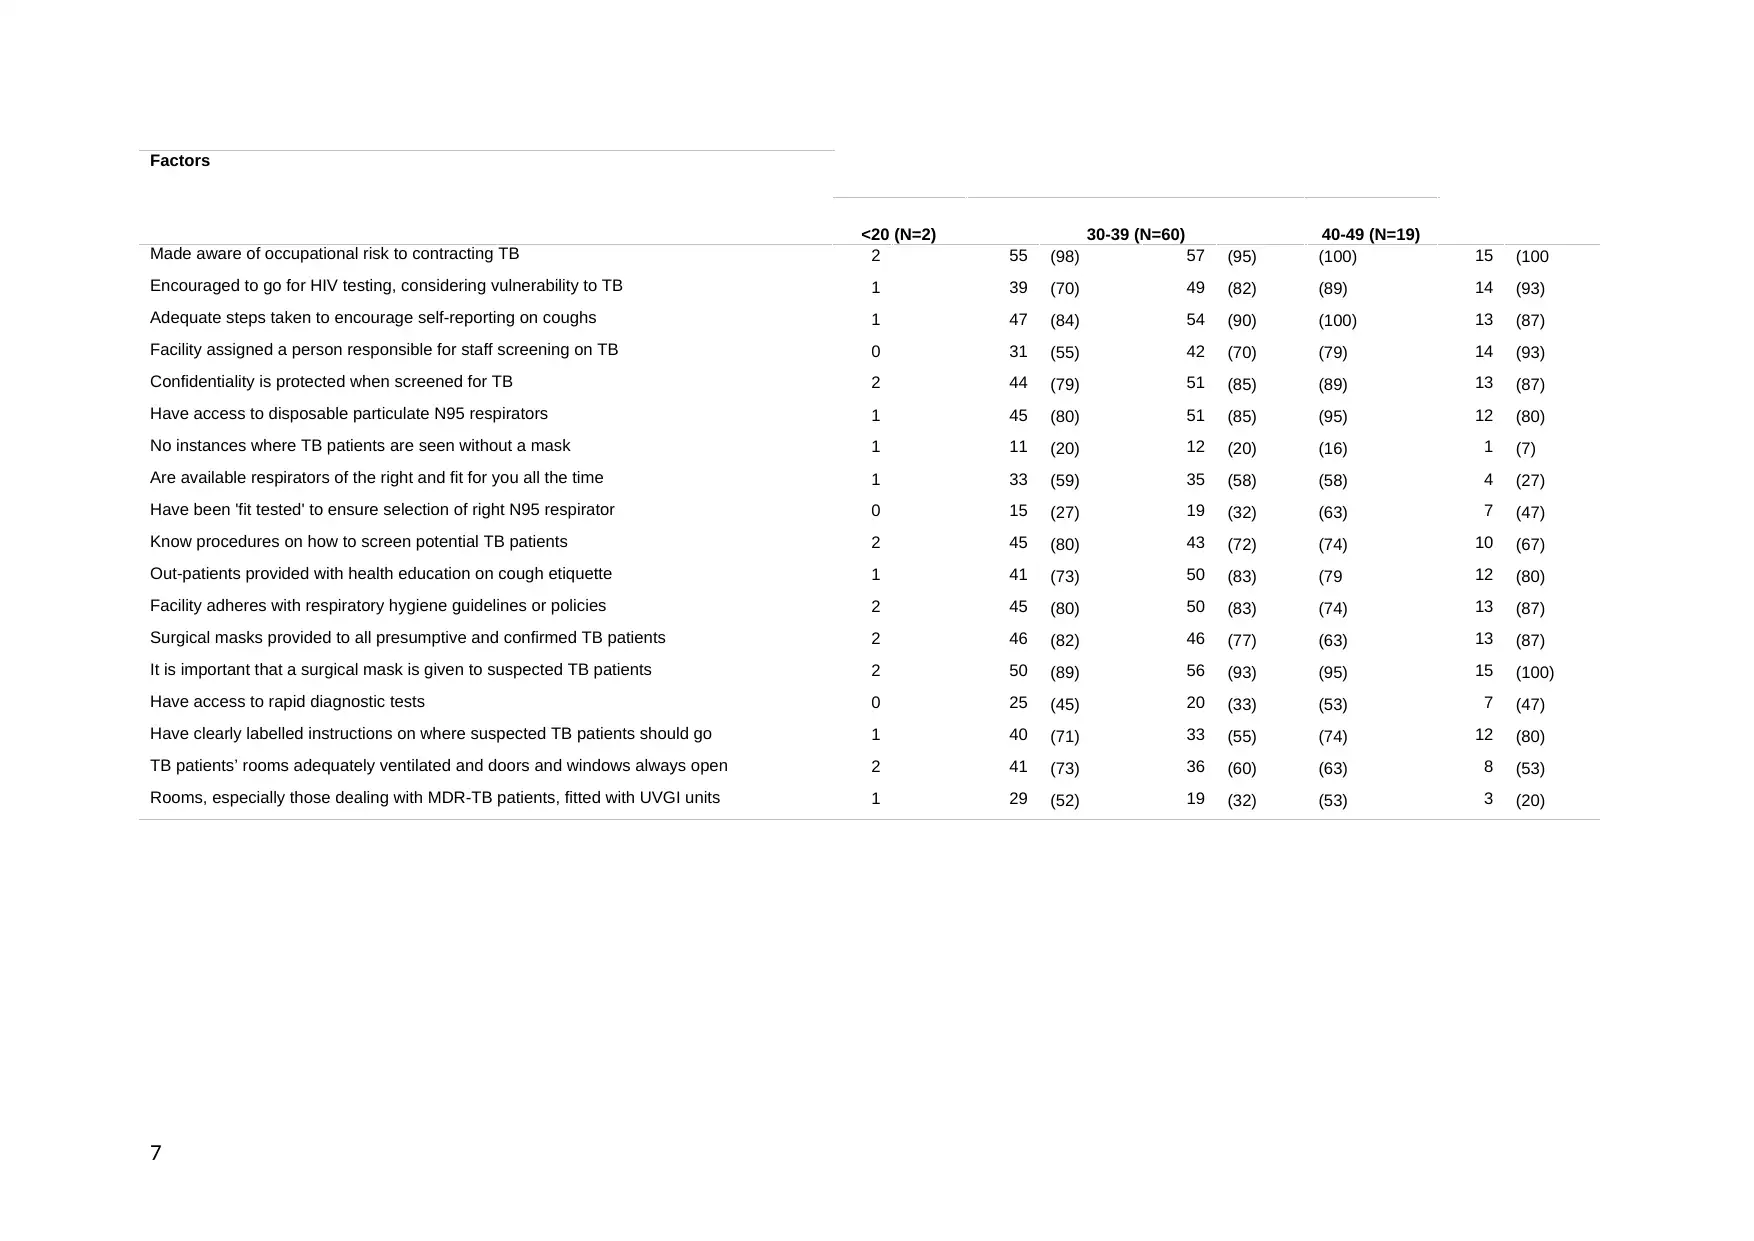
Factors
<20 (N=2) 30-39 (N=60) 40-49 (N=19)
Made aware of occupational risk to contracting TB 2 55 (98) 57 (95) (100) 15 (100
Encouraged to go for HIV testing, considering vulnerability to TB 1 39 (70) 49 (82) (89) 14 (93)
Adequate steps taken to encourage self-reporting on coughs 1 47 (84) 54 (90) (100) 13 (87)
Facility assigned a person responsible for staff screening on TB 0 31 (55) 42 (70) (79) 14 (93)
Confidentiality is protected when screened for TB 2 44 (79) 51 (85) (89) 13 (87)
Have access to disposable particulate N95 respirators 1 45 (80) 51 (85) (95) 12 (80)
No instances where TB patients are seen without a mask 1 11 (20) 12 (20) (16) 1 (7)
Are available respirators of the right and fit for you all the time 1 33 (59) 35 (58) (58) 4 (27)
Have been 'fit tested' to ensure selection of right N95 respirator 0 15 (27) 19 (32) (63) 7 (47)
Know procedures on how to screen potential TB patients 2 45 (80) 43 (72) (74) 10 (67)
Out-patients provided with health education on cough etiquette 1 41 (73) 50 (83) (79 12 (80)
Facility adheres with respiratory hygiene guidelines or policies 2 45 (80) 50 (83) (74) 13 (87)
Surgical masks provided to all presumptive and confirmed TB patients 2 46 (82) 46 (77) (63) 13 (87)
It is important that a surgical mask is given to suspected TB patients 2 50 (89) 56 (93) (95) 15 (100)
Have access to rapid diagnostic tests 0 25 (45) 20 (33) (53) 7 (47)
Have clearly labelled instructions on where suspected TB patients should go 1 40 (71) 33 (55) (74) 12 (80)
TB patients’ rooms adequately ventilated and doors and windows always open 2 41 (73) 36 (60) (63) 8 (53)
Rooms, especially those dealing with MDR-TB patients, fitted with UVGI units 1 29 (52) 19 (32) (53) 3 (20)
7
Paraphrase This Document
Need a fresh take? Get an instant paraphrase of this document with our AI Paraphraser
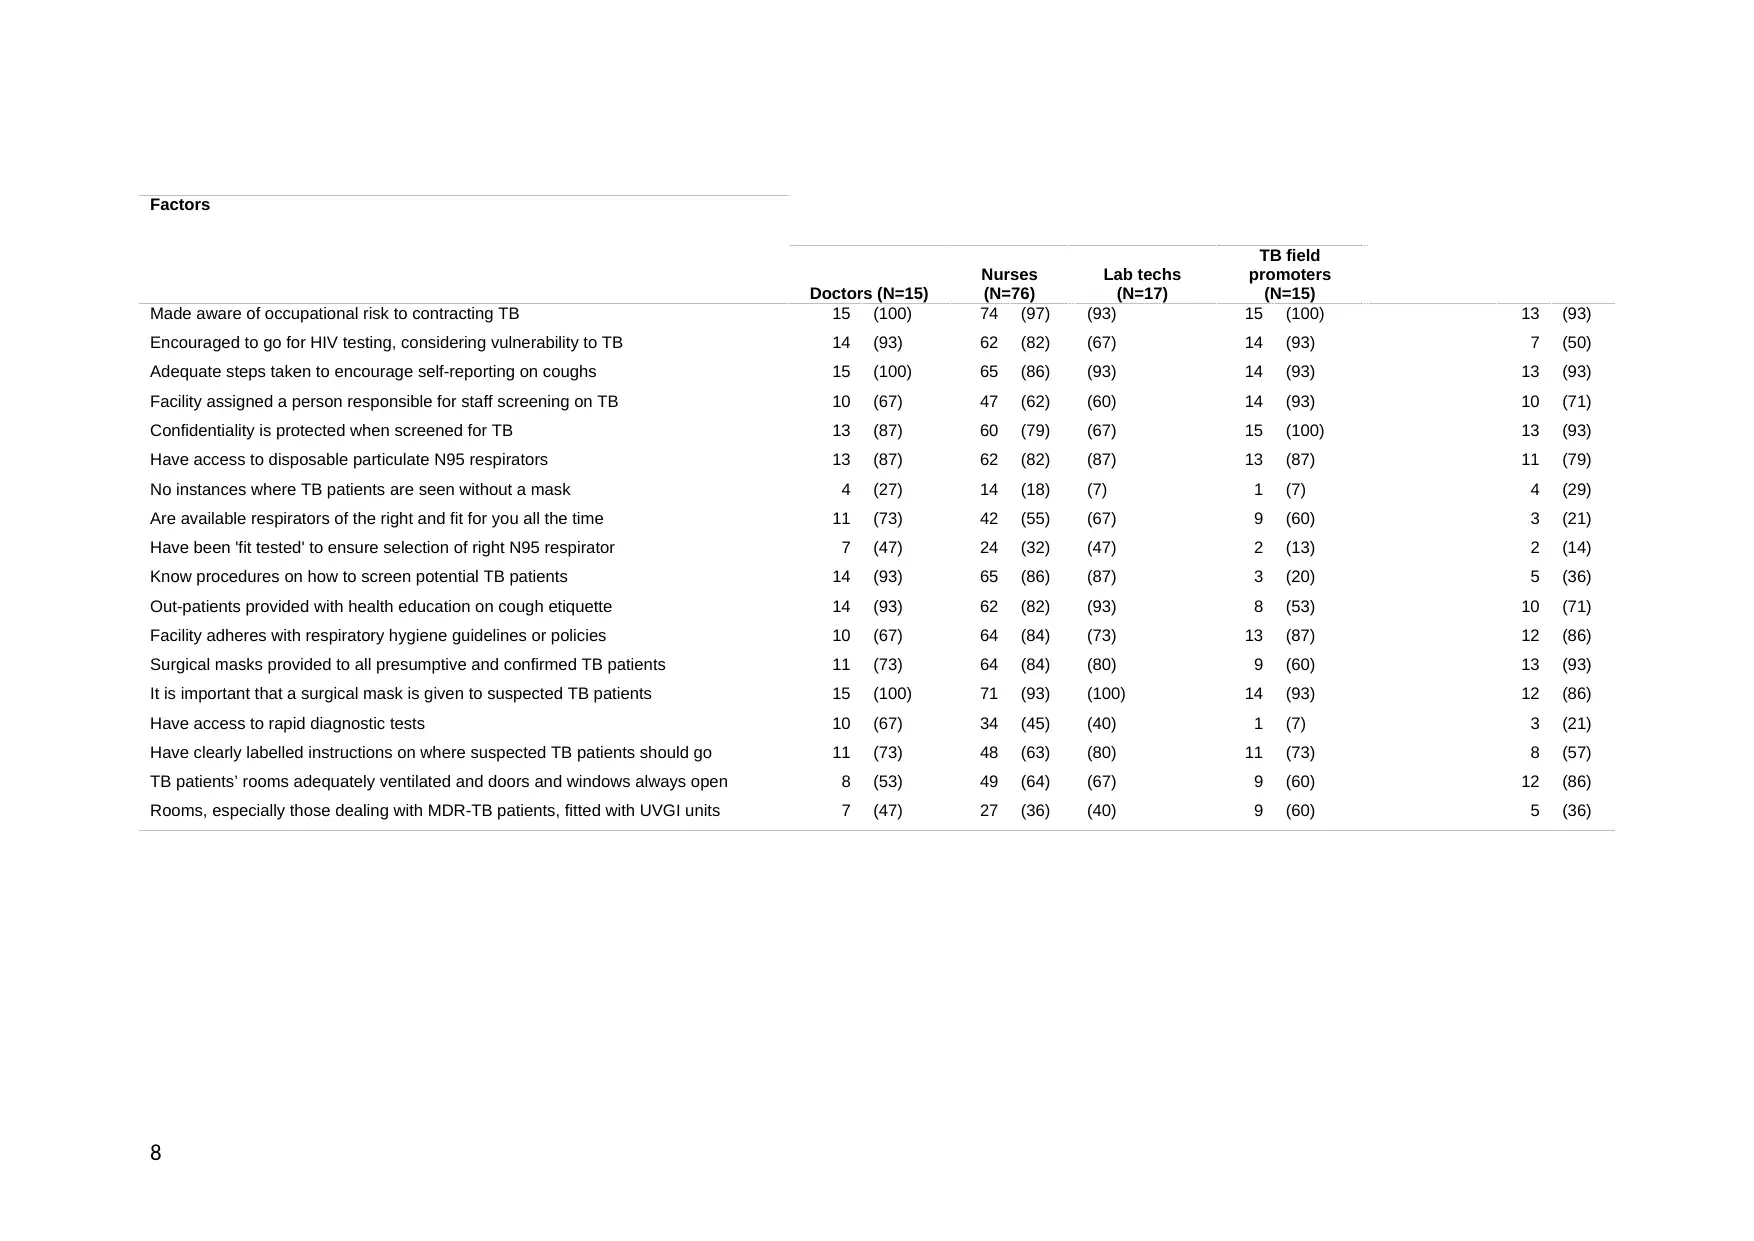
Factors
Doctors (N=15)
Nurses
(N=76)
Lab techs
(N=17)
TB field
promoters
(N=15)
Made aware of occupational risk to contracting TB 15 (100) 74 (97) (93) 15 (100) 13 (93)
Encouraged to go for HIV testing, considering vulnerability to TB 14 (93) 62 (82) (67) 14 (93) 7 (50)
Adequate steps taken to encourage self-reporting on coughs 15 (100) 65 (86) (93) 14 (93) 13 (93)
Facility assigned a person responsible for staff screening on TB 10 (67) 47 (62) (60) 14 (93) 10 (71)
Confidentiality is protected when screened for TB 13 (87) 60 (79) (67) 15 (100) 13 (93)
Have access to disposable particulate N95 respirators 13 (87) 62 (82) (87) 13 (87) 11 (79)
No instances where TB patients are seen without a mask 4 (27) 14 (18) (7) 1 (7) 4 (29)
Are available respirators of the right and fit for you all the time 11 (73) 42 (55) (67) 9 (60) 3 (21)
Have been 'fit tested' to ensure selection of right N95 respirator 7 (47) 24 (32) (47) 2 (13) 2 (14)
Know procedures on how to screen potential TB patients 14 (93) 65 (86) (87) 3 (20) 5 (36)
Out-patients provided with health education on cough etiquette 14 (93) 62 (82) (93) 8 (53) 10 (71)
Facility adheres with respiratory hygiene guidelines or policies 10 (67) 64 (84) (73) 13 (87) 12 (86)
Surgical masks provided to all presumptive and confirmed TB patients 11 (73) 64 (84) (80) 9 (60) 13 (93)
It is important that a surgical mask is given to suspected TB patients 15 (100) 71 (93) (100) 14 (93) 12 (86)
Have access to rapid diagnostic tests 10 (67) 34 (45) (40) 1 (7) 3 (21)
Have clearly labelled instructions on where suspected TB patients should go 11 (73) 48 (63) (80) 11 (73) 8 (57)
TB patients’ rooms adequately ventilated and doors and windows always open 8 (53) 49 (64) (67) 9 (60) 12 (86)
Rooms, especially those dealing with MDR-TB patients, fitted with UVGI units 7 (47) 27 (36) (40) 9 (60) 5 (36)
8
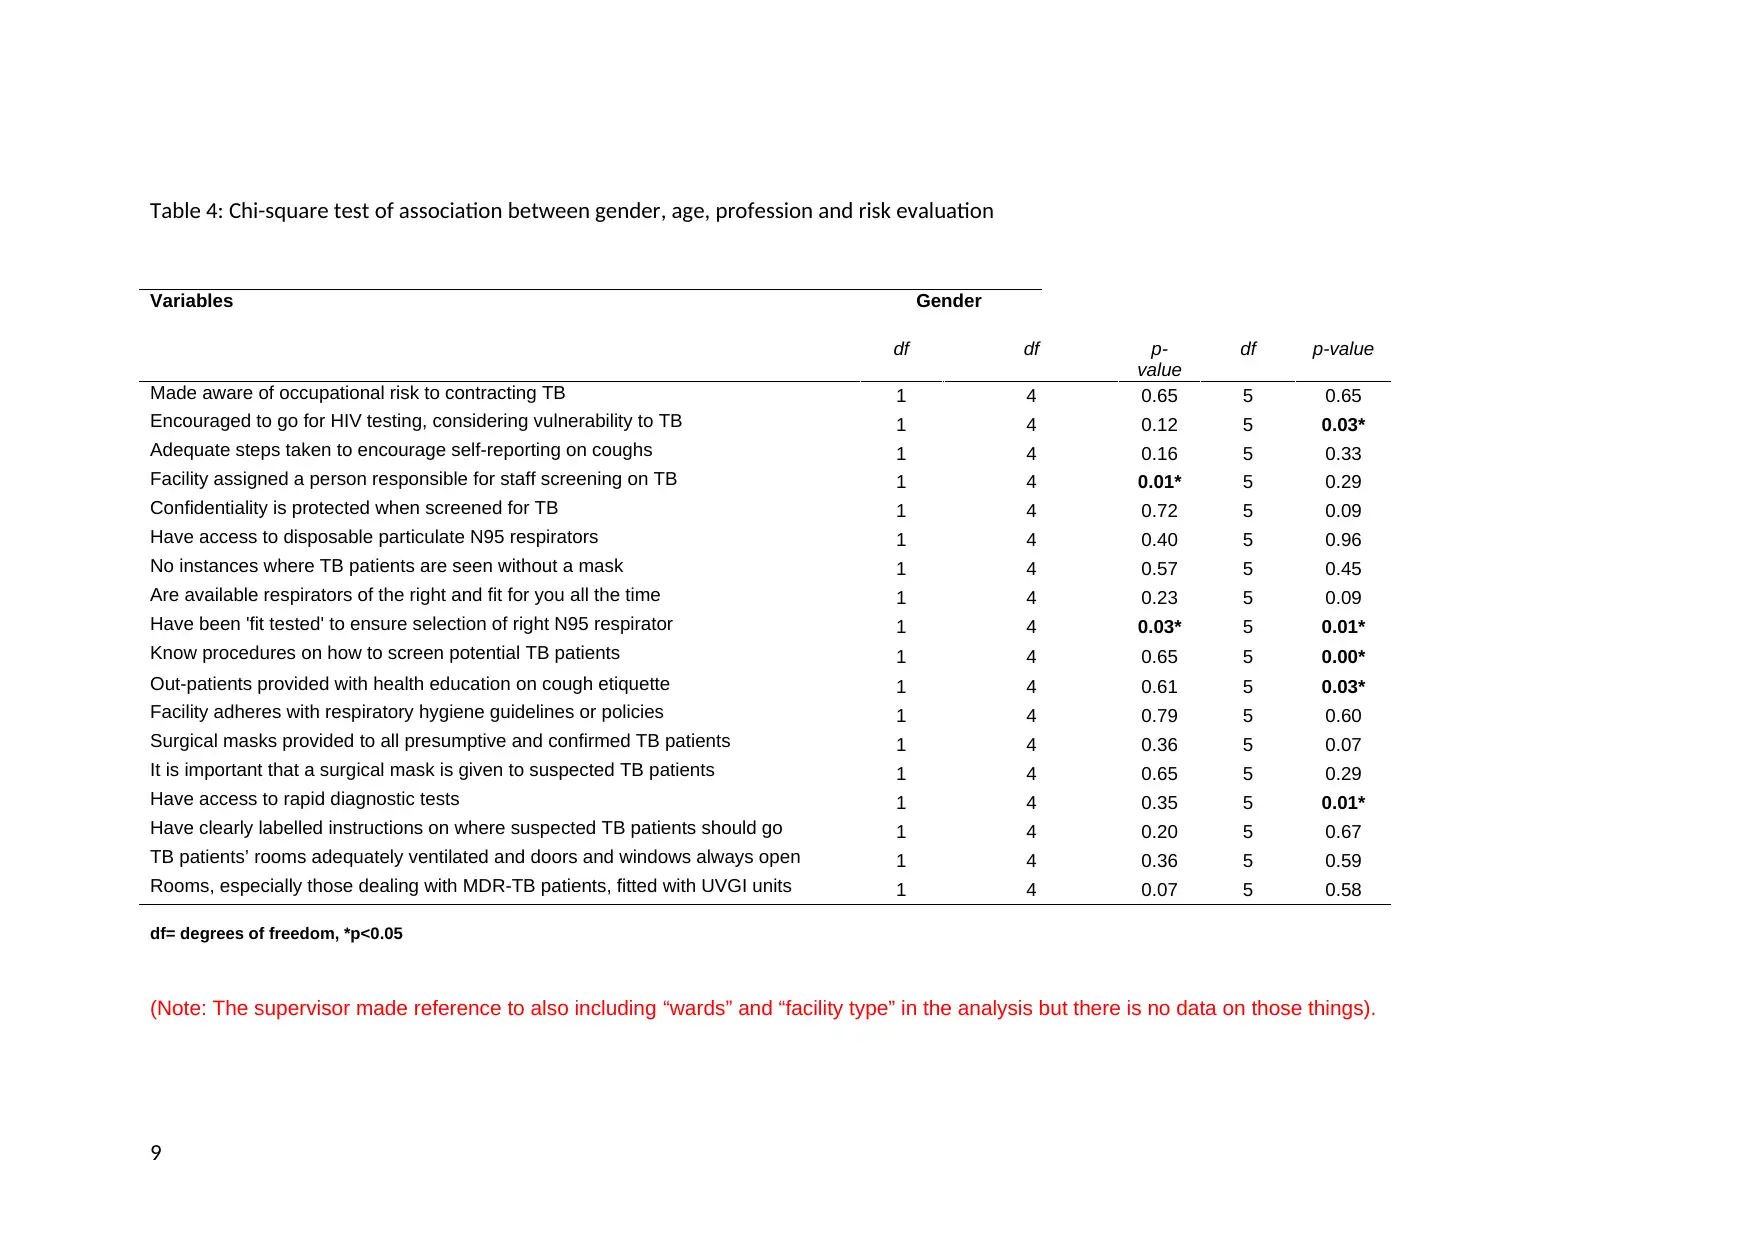
Table 4: Chi-square test of association between gender, age, profession and risk evaluation
Variables Gender
df df p-
value
df p-value
Made aware of occupational risk to contracting TB 1 4 0.65 5 0.65
Encouraged to go for HIV testing, considering vulnerability to TB 1 4 0.12 5 0.03*
Adequate steps taken to encourage self-reporting on coughs 1 4 0.16 5 0.33
Facility assigned a person responsible for staff screening on TB 1 4 0.01* 5 0.29
Confidentiality is protected when screened for TB 1 4 0.72 5 0.09
Have access to disposable particulate N95 respirators 1 4 0.40 5 0.96
No instances where TB patients are seen without a mask 1 4 0.57 5 0.45
Are available respirators of the right and fit for you all the time 1 4 0.23 5 0.09
Have been 'fit tested' to ensure selection of right N95 respirator 1 4 0.03* 5 0.01*
Know procedures on how to screen potential TB patients 1 4 0.65 5 0.00*
Out-patients provided with health education on cough etiquette 1 4 0.61 5 0.03*
Facility adheres with respiratory hygiene guidelines or policies 1 4 0.79 5 0.60
Surgical masks provided to all presumptive and confirmed TB patients 1 4 0.36 5 0.07
It is important that a surgical mask is given to suspected TB patients 1 4 0.65 5 0.29
Have access to rapid diagnostic tests 1 4 0.35 5 0.01*
Have clearly labelled instructions on where suspected TB patients should go 1 4 0.20 5 0.67
TB patients’ rooms adequately ventilated and doors and windows always open 1 4 0.36 5 0.59
Rooms, especially those dealing with MDR-TB patients, fitted with UVGI units 1 4 0.07 5 0.58
df= degrees of freedom, *p<0.05
(Note: The supervisor made reference to also including “wards” and “facility type” in the analysis but there is no data on those things).
9
⊘ This is a preview!⊘
Do you want full access?
Subscribe today to unlock all pages.
Trusted by 1+ million students worldwide

CHAPTER - 5
DISCUSSION
The present study identified the potential risk factors associated with pulmonary
tuberculosis among Namibian health care workers, respectively. Tuberculosis is a type of chronic
and infectious disease which is caused by micro organism called Mycobacterium tuberculosis.
These can enter into human body thorough various ways, such as, lungs and other parts as, from
the blood stream or their lymphatic system (Diacon and et.al., 2014). As per the above result
there has been various tests were performed on the data base on which various information has
been gathered. Number of participants taken were 152 in which majority were female (57%,
N=87) and remaining were male (43%, N=65).
From the overall test which is performed has helped in concluding that pulmonary
tuberculosis has a huge impact on the health care workers of Namibia. Present report has shown
that highest number of Health Care Workers who were diagnosed with TB was received in 2015,
i.e., N = 55 and the least was recorded in 2016, i.e., N = 41. An average number of TB cases
diagnosed over those 5 years has been of a general decline in their number, respectively
(Guariguata and et.al., 2015). From the secondary data as well it is clear that it has a huge impact
on the workers as stated by Baussano et al. (2011), according to which healthcare workers
(HCWs) are at maximum risk of getting tuberculosis (TB) as compared to the general
population. This had lead to increase the exposure and chances of getting infection that put them
at a very high risk since resource-constrained settings are very common in most of the hospitals
or medical institute.
Evaluation of Pulmonary Tuberculosis risk factors in workers of Namibian healthcare
sector, it has been identified that there are various factors which helped in getting to understand
these risk factors accurately, such as, in evaluating the work practices in Namibian health center,
five different factors were analyzed, such as, facility assigned to a person responsible for staff
screening on TB, encouraging going for HIV testing, considering vulnerability to TB, made
aware of occupational risk to contracting TB, etc (Imtiaz and et.al., 2017). From which is
estimated that lowest possibility was for persons responsible for staff screening on TB at the
health facilities and highest respondents agreed they had been made aware of the occupational
risk of contracting TB. This shows that evaluation in work practice has a positive result overall.
As it was suggested by Kapweya (2010), infection get develop very soon if it gets in touch with
the workers who are susceptible to it. In 2007, it was recorded that, Namibia was among the
world’s highest incidence rates of tuberculosis (TB) and has a case notification rate (CNR) of
722 per 100 000 in 2007. So it is very important to perform the work practices very carefully in
the institute. This will help in reducing the impact of getting infected.
In previous studies, it was identified that there are various risk factors which has to be
reduced significantly in the institute. Health care workers are confirmed to be at great risks of
contracting TB due to the nature of their work. To reduce this impact it is very essential to have
improved personal protective equipment which can help health care workers to protect
themselves from getting infection. From the literature review, it can be identified that, the risk of
1
Paraphrase This Document
Need a fresh take? Get an instant paraphrase of this document with our AI Paraphraser
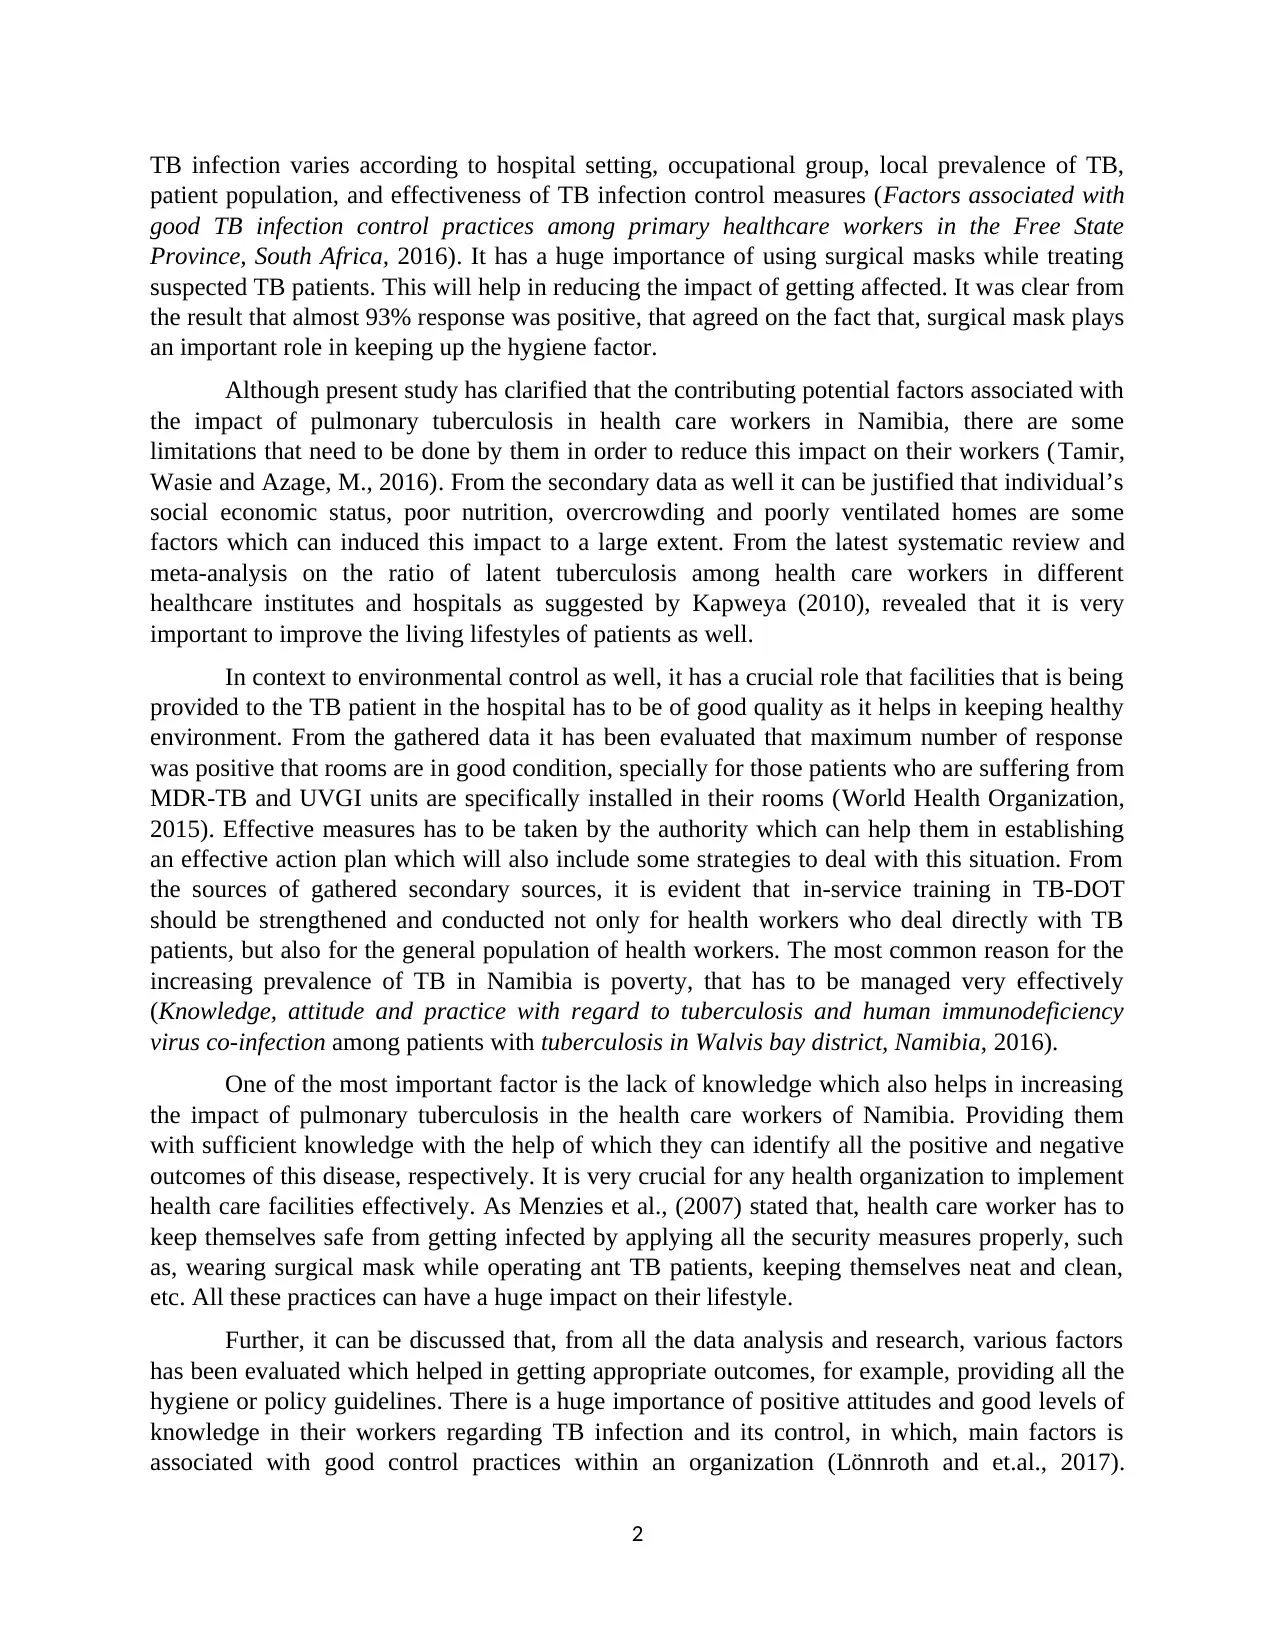
TB infection varies according to hospital setting, occupational group, local prevalence of TB,
patient population, and effectiveness of TB infection control measures (Factors associated with
good TB infection control practices among primary healthcare workers in the Free State
Province, South Africa, 2016). It has a huge importance of using surgical masks while treating
suspected TB patients. This will help in reducing the impact of getting affected. It was clear from
the result that almost 93% response was positive, that agreed on the fact that, surgical mask plays
an important role in keeping up the hygiene factor.
Although present study has clarified that the contributing potential factors associated with
the impact of pulmonary tuberculosis in health care workers in Namibia, there are some
limitations that need to be done by them in order to reduce this impact on their workers ( Tamir,
Wasie and Azage, M., 2016). From the secondary data as well it can be justified that individual’s
social economic status, poor nutrition, overcrowding and poorly ventilated homes are some
factors which can induced this impact to a large extent. From the latest systematic review and
meta-analysis on the ratio of latent tuberculosis among health care workers in different
healthcare institutes and hospitals as suggested by Kapweya (2010), revealed that it is very
important to improve the living lifestyles of patients as well.
In context to environmental control as well, it has a crucial role that facilities that is being
provided to the TB patient in the hospital has to be of good quality as it helps in keeping healthy
environment. From the gathered data it has been evaluated that maximum number of response
was positive that rooms are in good condition, specially for those patients who are suffering from
MDR-TB and UVGI units are specifically installed in their rooms (World Health Organization,
2015). Effective measures has to be taken by the authority which can help them in establishing
an effective action plan which will also include some strategies to deal with this situation. From
the sources of gathered secondary sources, it is evident that in-service training in TB-DOT
should be strengthened and conducted not only for health workers who deal directly with TB
patients, but also for the general population of health workers. The most common reason for the
increasing prevalence of TB in Namibia is poverty, that has to be managed very effectively
(Knowledge, attitude and practice with regard to tuberculosis and human immunodeficiency
virus co-infection among patients with tuberculosis in Walvis bay district, Namibia, 2016).
One of the most important factor is the lack of knowledge which also helps in increasing
the impact of pulmonary tuberculosis in the health care workers of Namibia. Providing them
with sufficient knowledge with the help of which they can identify all the positive and negative
outcomes of this disease, respectively. It is very crucial for any health organization to implement
health care facilities effectively. As Menzies et al., (2007) stated that, health care worker has to
keep themselves safe from getting infected by applying all the security measures properly, such
as, wearing surgical mask while operating ant TB patients, keeping themselves neat and clean,
etc. All these practices can have a huge impact on their lifestyle.
Further, it can be discussed that, from all the data analysis and research, various factors
has been evaluated which helped in getting appropriate outcomes, for example, providing all the
hygiene or policy guidelines. There is a huge importance of positive attitudes and good levels of
knowledge in their workers regarding TB infection and its control, in which, main factors is
associated with good control practices within an organization (Lönnroth and et.al., 2017).
2
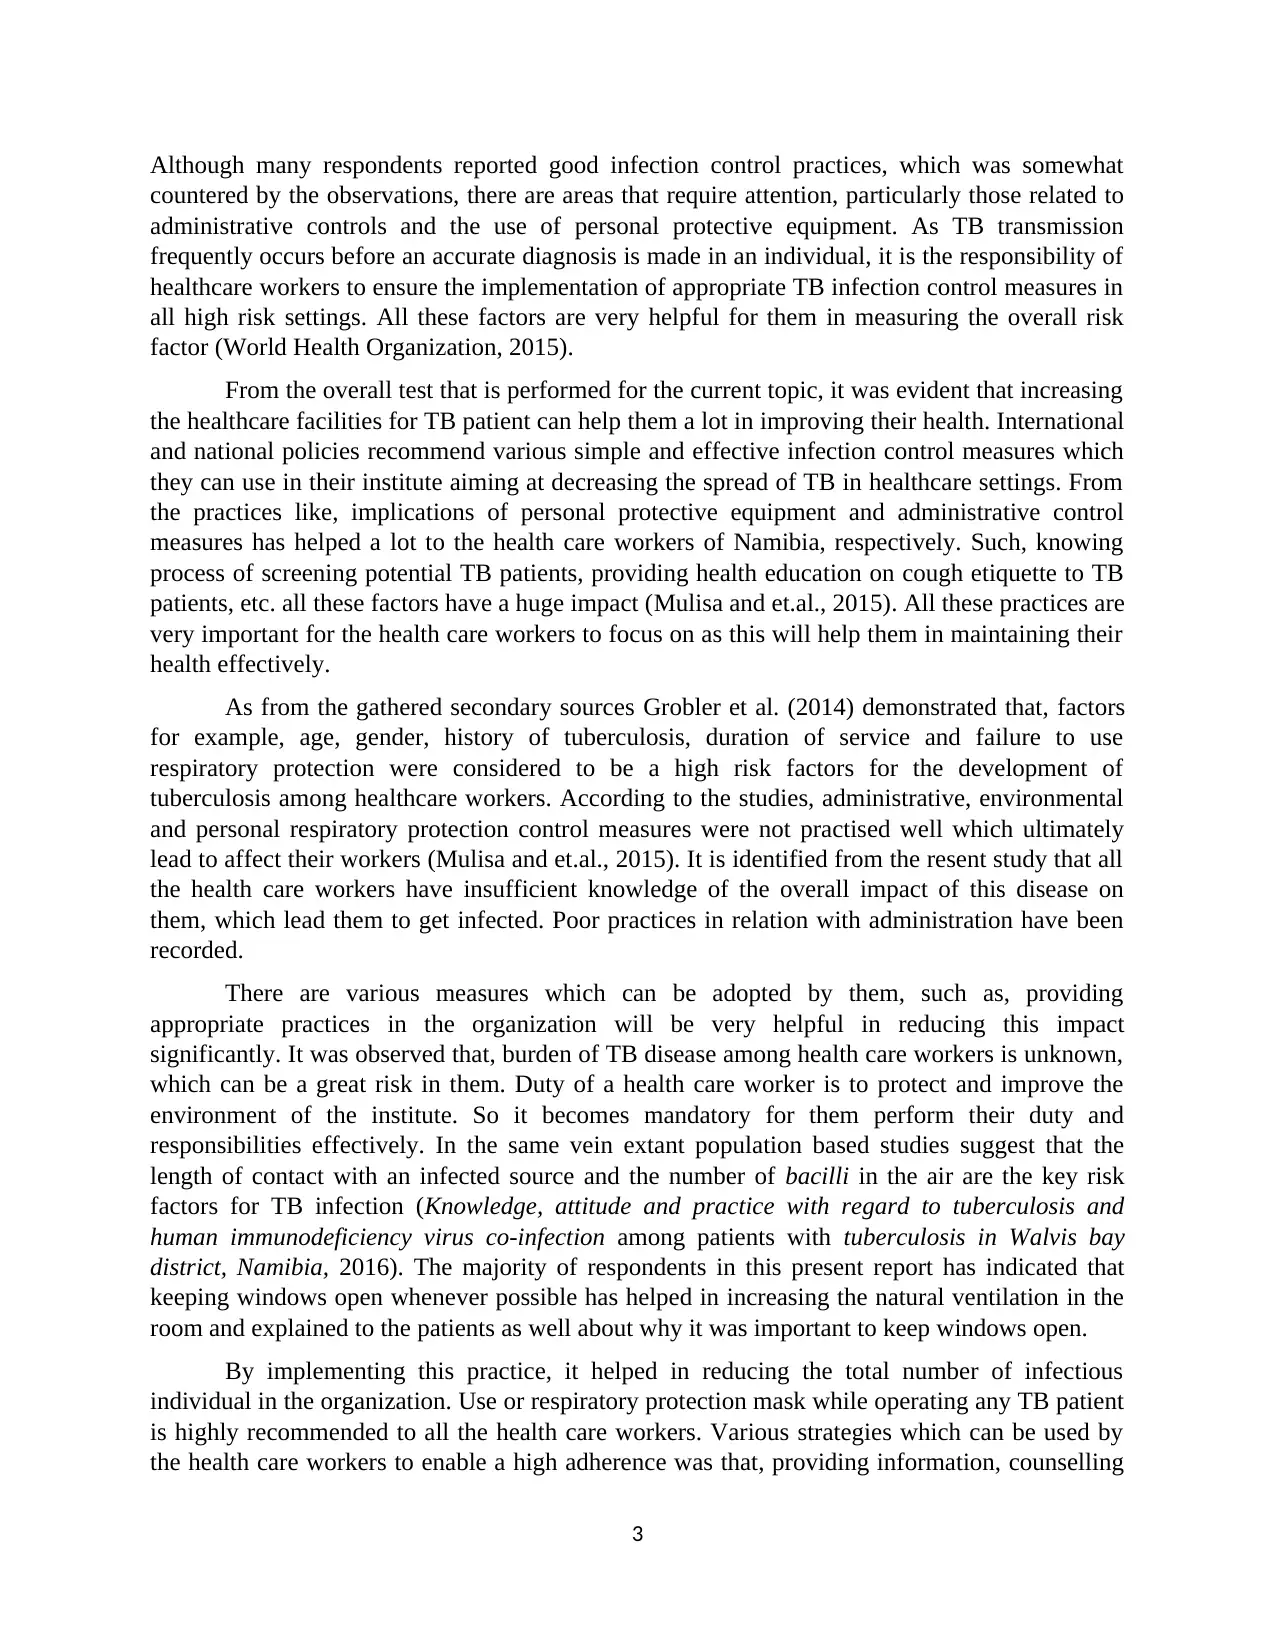
Although many respondents reported good infection control practices, which was somewhat
countered by the observations, there are areas that require attention, particularly those related to
administrative controls and the use of personal protective equipment. As TB transmission
frequently occurs before an accurate diagnosis is made in an individual, it is the responsibility of
healthcare workers to ensure the implementation of appropriate TB infection control measures in
all high risk settings. All these factors are very helpful for them in measuring the overall risk
factor (World Health Organization, 2015).
From the overall test that is performed for the current topic, it was evident that increasing
the healthcare facilities for TB patient can help them a lot in improving their health. International
and national policies recommend various simple and effective infection control measures which
they can use in their institute aiming at decreasing the spread of TB in healthcare settings. From
the practices like, implications of personal protective equipment and administrative control
measures has helped a lot to the health care workers of Namibia, respectively. Such, knowing
process of screening potential TB patients, providing health education on cough etiquette to TB
patients, etc. all these factors have a huge impact (Mulisa and et.al., 2015). All these practices are
very important for the health care workers to focus on as this will help them in maintaining their
health effectively.
As from the gathered secondary sources Grobler et al. (2014) demonstrated that, factors
for example, age, gender, history of tuberculosis, duration of service and failure to use
respiratory protection were considered to be a high risk factors for the development of
tuberculosis among healthcare workers. According to the studies, administrative, environmental
and personal respiratory protection control measures were not practised well which ultimately
lead to affect their workers (Mulisa and et.al., 2015). It is identified from the resent study that all
the health care workers have insufficient knowledge of the overall impact of this disease on
them, which lead them to get infected. Poor practices in relation with administration have been
recorded.
There are various measures which can be adopted by them, such as, providing
appropriate practices in the organization will be very helpful in reducing this impact
significantly. It was observed that, burden of TB disease among health care workers is unknown,
which can be a great risk in them. Duty of a health care worker is to protect and improve the
environment of the institute. So it becomes mandatory for them perform their duty and
responsibilities effectively. In the same vein extant population based studies suggest that the
length of contact with an infected source and the number of bacilli in the air are the key risk
factors for TB infection (Knowledge, attitude and practice with regard to tuberculosis and
human immunodeficiency virus co-infection among patients with tuberculosis in Walvis bay
district, Namibia, 2016). The majority of respondents in this present report has indicated that
keeping windows open whenever possible has helped in increasing the natural ventilation in the
room and explained to the patients as well about why it was important to keep windows open.
By implementing this practice, it helped in reducing the total number of infectious
individual in the organization. Use or respiratory protection mask while operating any TB patient
is highly recommended to all the health care workers. Various strategies which can be used by
the health care workers to enable a high adherence was that, providing information, counselling
3
⊘ This is a preview!⊘
Do you want full access?
Subscribe today to unlock all pages.
Trusted by 1+ million students worldwide
1 out of 15


Your All-in-One AI-Powered Toolkit for Academic Success.
+13062052269
info@desklib.com
Available 24*7 on WhatsApp / Email
![[object Object]](/_next/static/media/star-bottom.7253800d.svg)
Unlock your academic potential
Copyright © 2020–2026 A2Z Services. All Rights Reserved. Developed and managed by ZUCOL.