MATH240 Journal Dataset Analysis

Verified

Added on  2019/09/16

|2
|438
|289
Homework Assignment
AI Summary
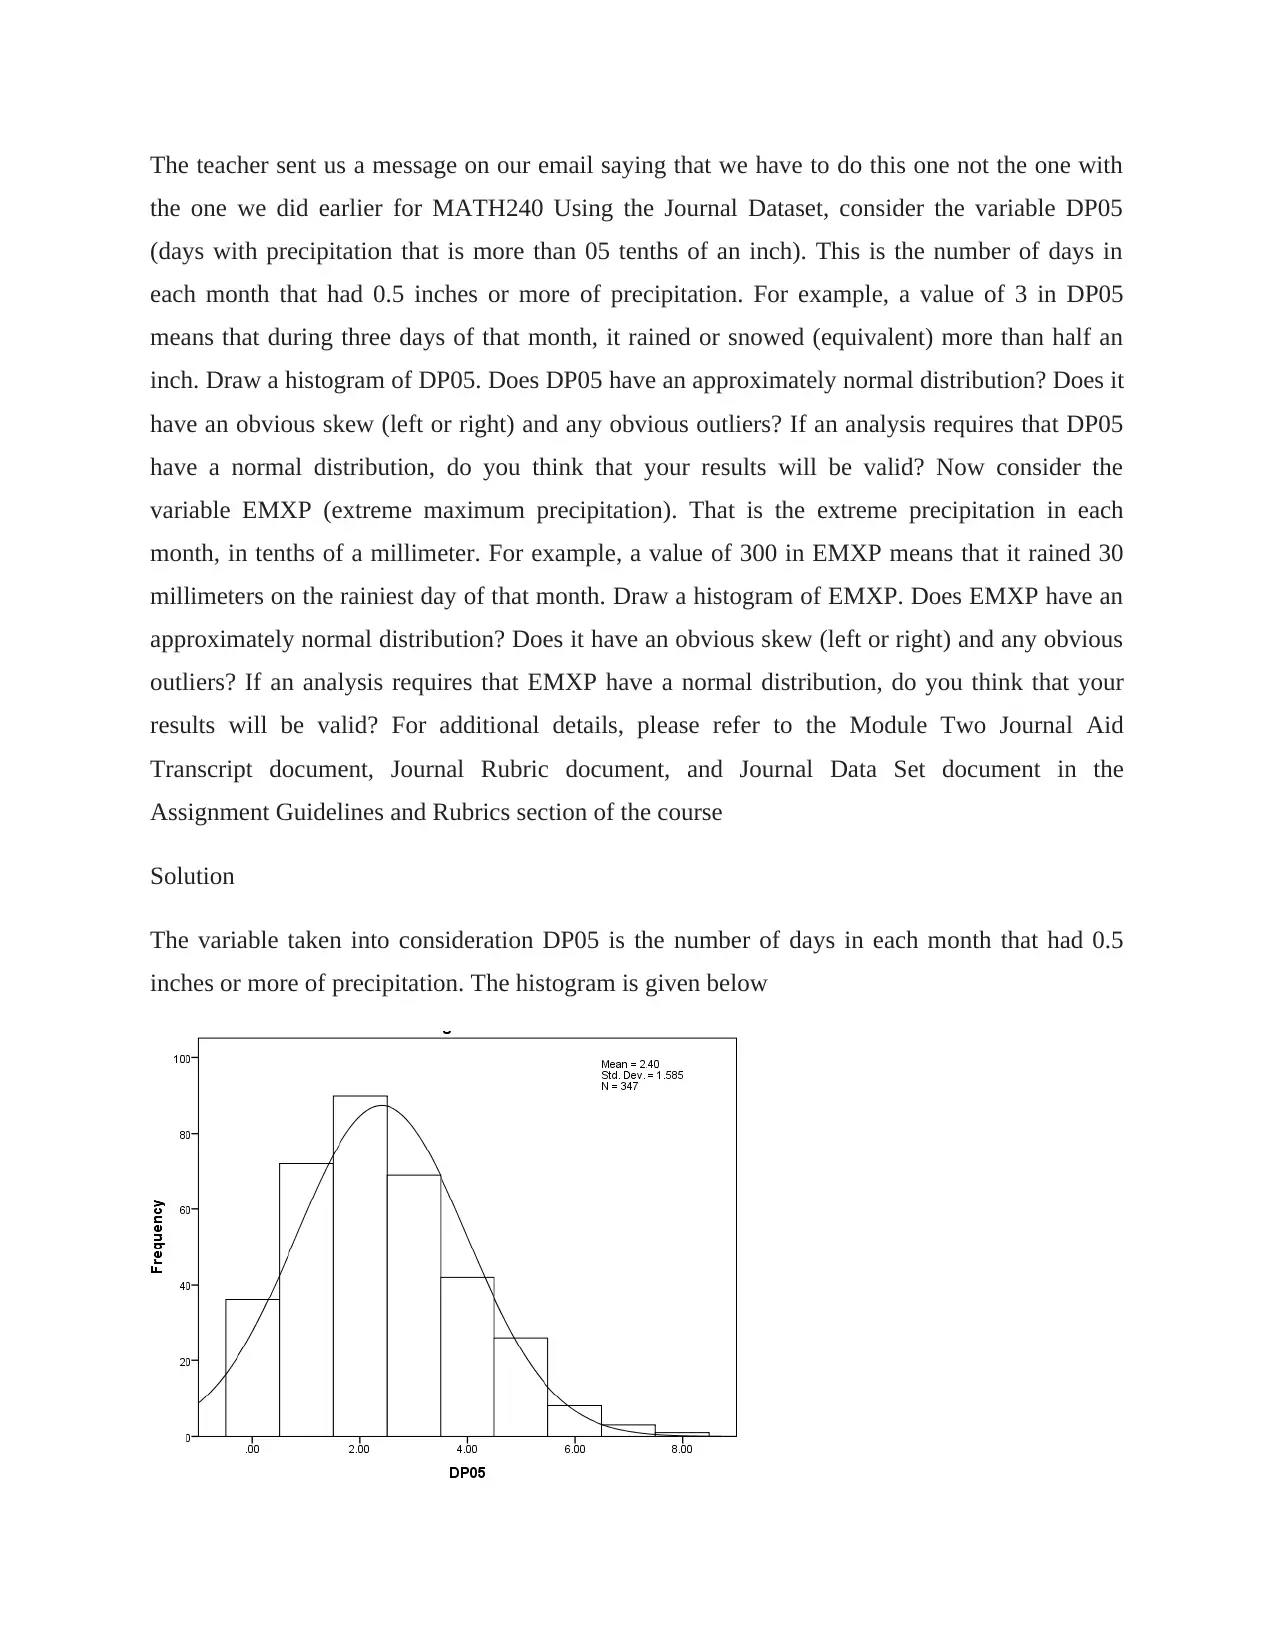
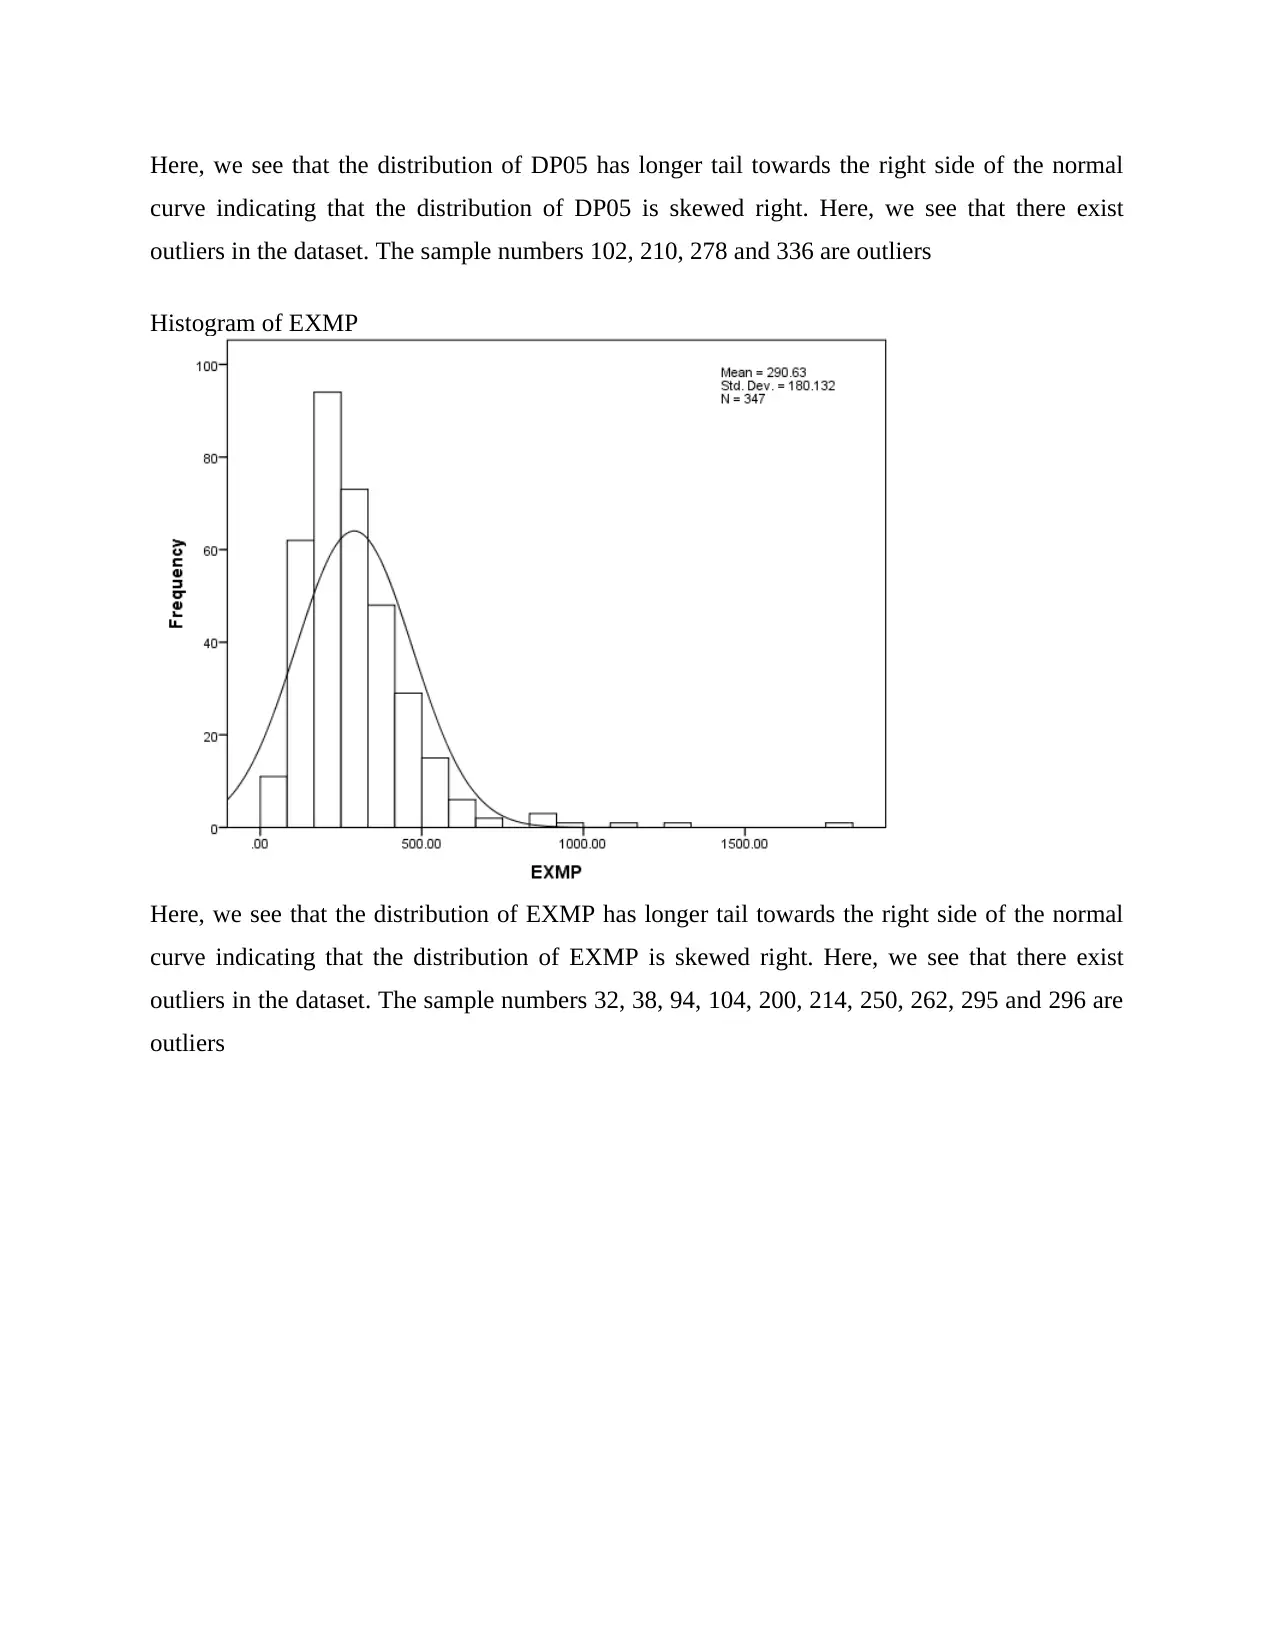
This document provides a solution to a homework assignment for MATH240, focusing on the analysis of the DP05 and EMXP variables from the Journal Dataset. The solution includes histograms for both variables, an assessment of their normality, identification of skewness (right-skewed for both), and the detection of outliers. The analysis concludes that neither variable has a normal distribution, which may impact the validity of analyses requiring normality. Specific sample numbers are identified as outliers for both DP05 and EMXP.
Document Page
The teacher sent us a message on our email saying that we have to do this one not the one with
the one we did earlier for MATH240 Using the Journal Dataset, consider the variable DP05
(days with precipitation that is more than 05 tenths of an inch). This is the number of days in
each month that had 0.5 inches or more of precipitation. For example, a value of 3 in DP05
means that during three days of that month, it rained or snowed (equivalent) more than half an
inch. Draw a histogram of DP05. Does DP05 have an approximately normal distribution? Does it
have an obvious skew (left or right) and any obvious outliers? If an analysis requires that DP05
have a normal distribution, do you think that your results will be valid? Now consider the
variable EMXP (extreme maximum precipitation). That is the extreme precipitation in each
month, in tenths of a millimeter. For example, a value of 300 in EMXP means that it rained 30
millimeters on the rainiest day of that month. Draw a histogram of EMXP. Does EMXP have an
approximately normal distribution? Does it have an obvious skew (left or right) and any obvious
outliers? If an analysis requires that EMXP have a normal distribution, do you think that your
results will be valid? For additional details, please refer to the Module Two Journal Aid
Transcript document, Journal Rubric document, and Journal Data Set document in the
Assignment Guidelines and Rubrics section of the course
Solution
The variable taken into consideration DP05 is the number of days in each month that had 0.5
inches or more of precipitation. The histogram is given below
tabler-icon-diamond-filled.svg

Paraphrase This Document

Need a fresh take? Get an instant paraphrase of this document with our AI Paraphraser
Document Page
Here, we see that the distribution of DP05 has longer tail towards the right side of the normal
curve indicating that the distribution of DP05 is skewed right. Here, we see that there exist
outliers in the dataset. The sample numbers 102, 210, 278 and 336 are outliers
Histogram of EXMP
Here, we see that the distribution of EXMP has longer tail towards the right side of the normal
curve indicating that the distribution of EXMP is skewed right. Here, we see that there exist
outliers in the dataset. The sample numbers 32, 38, 94, 104, 200, 214, 250, 262, 295 and 296 are
outliers
chevron_up_icon
1 out of 2
circle_padding
hide_on_mobile
zoom_out_icon
[object Object]