Woolworths Group Financial Statement Analysis & Investor Review
VerifiedAdded on 2023/05/23
|18
|1342
|357
Report
AI Summary
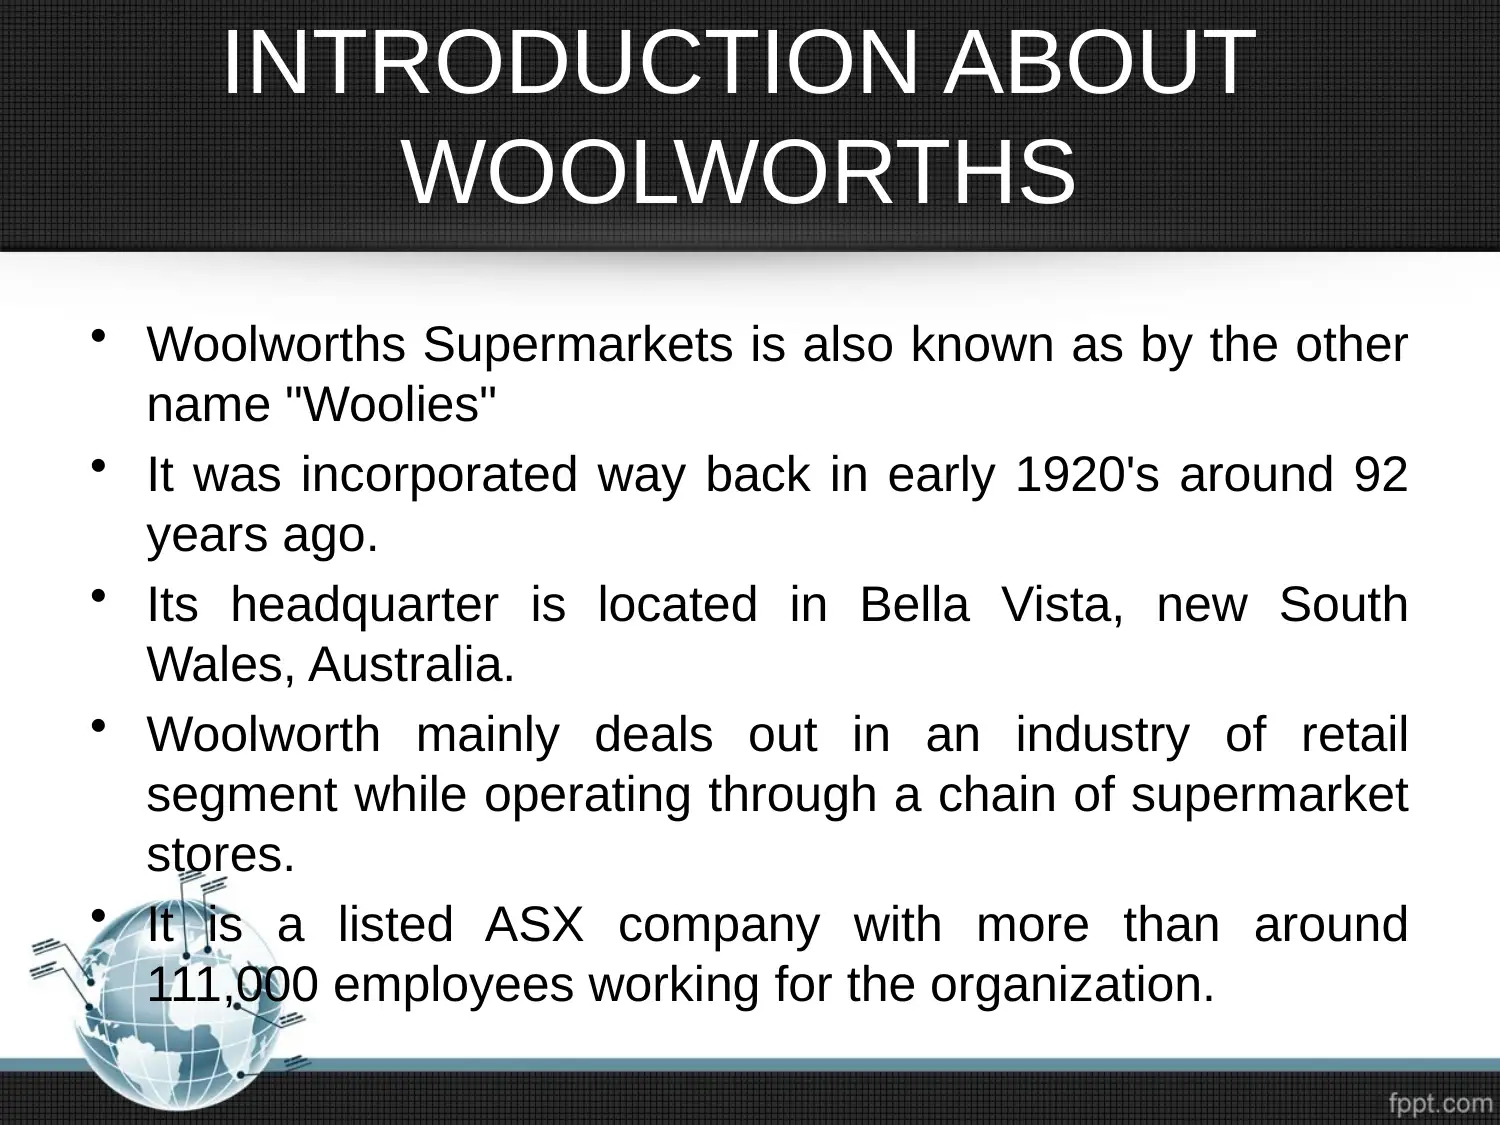
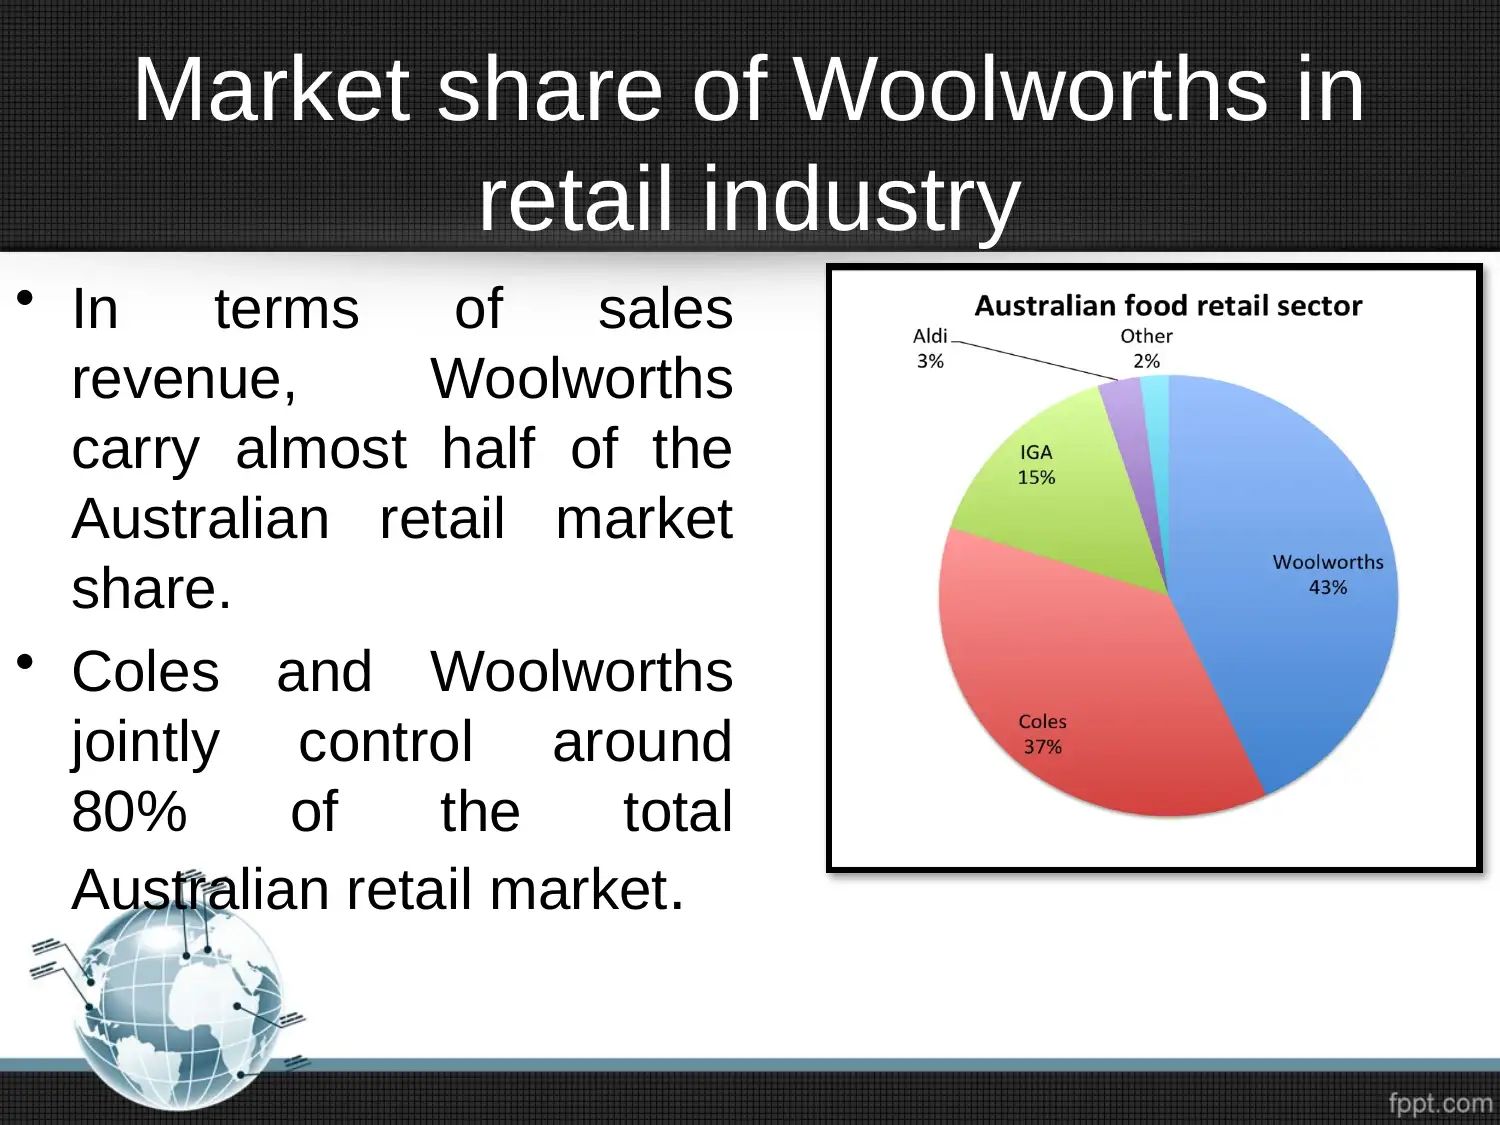
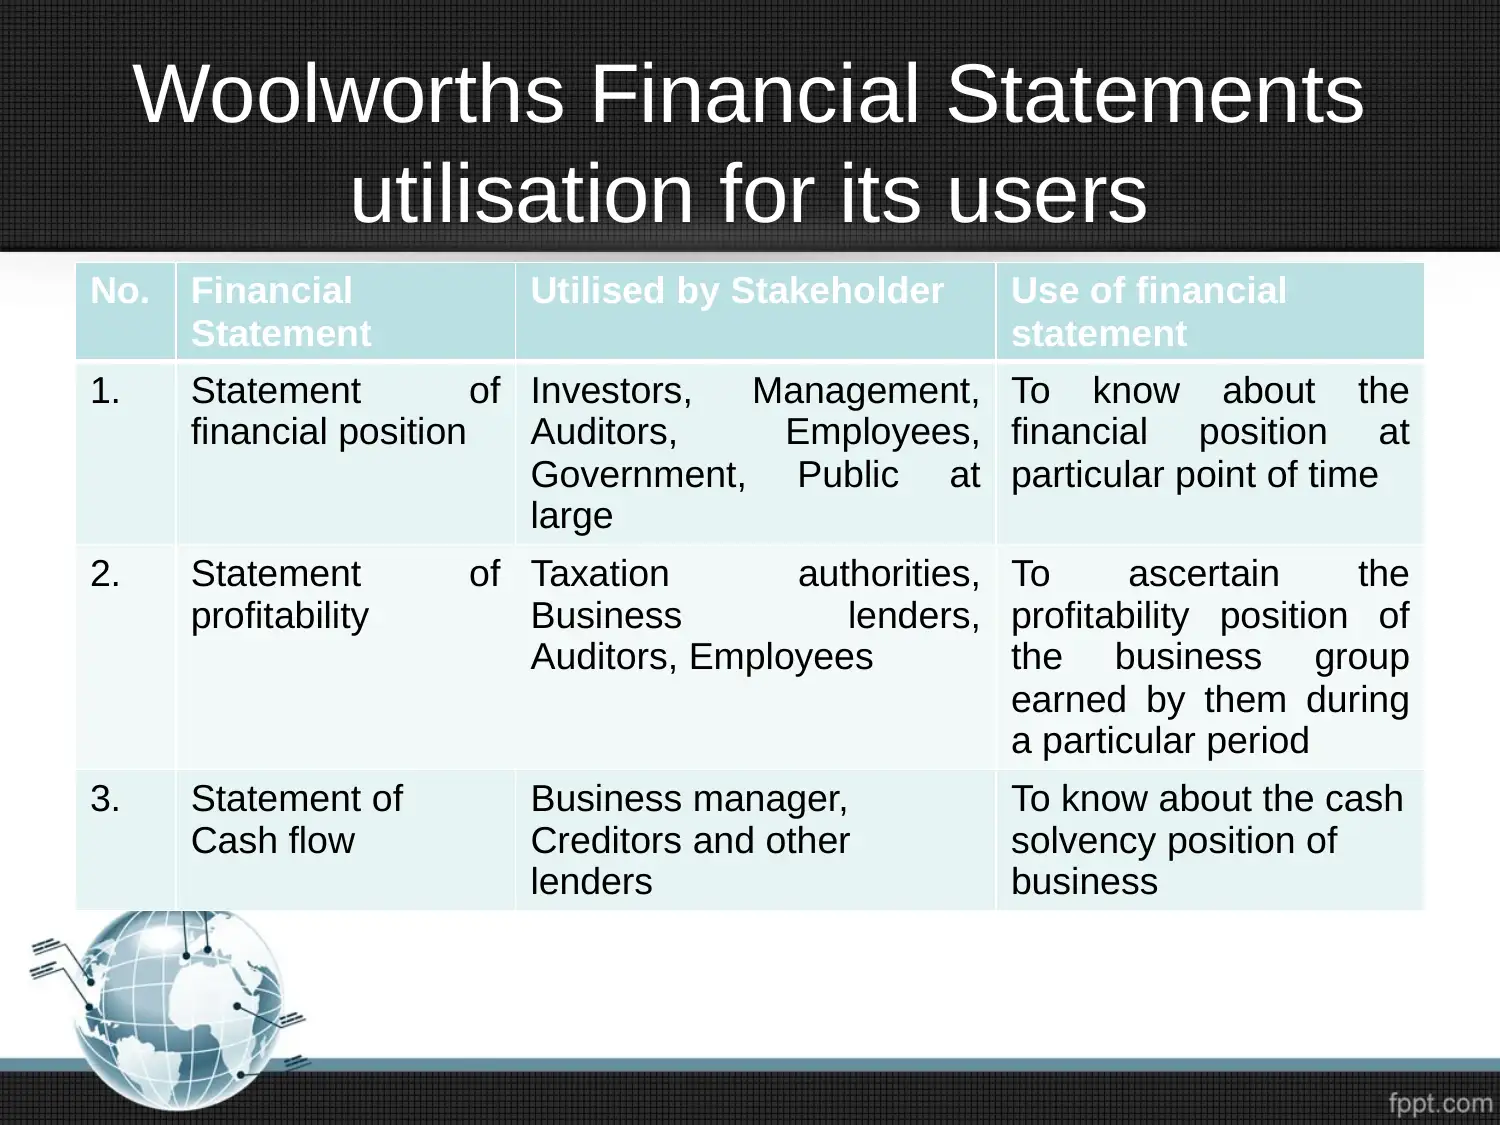
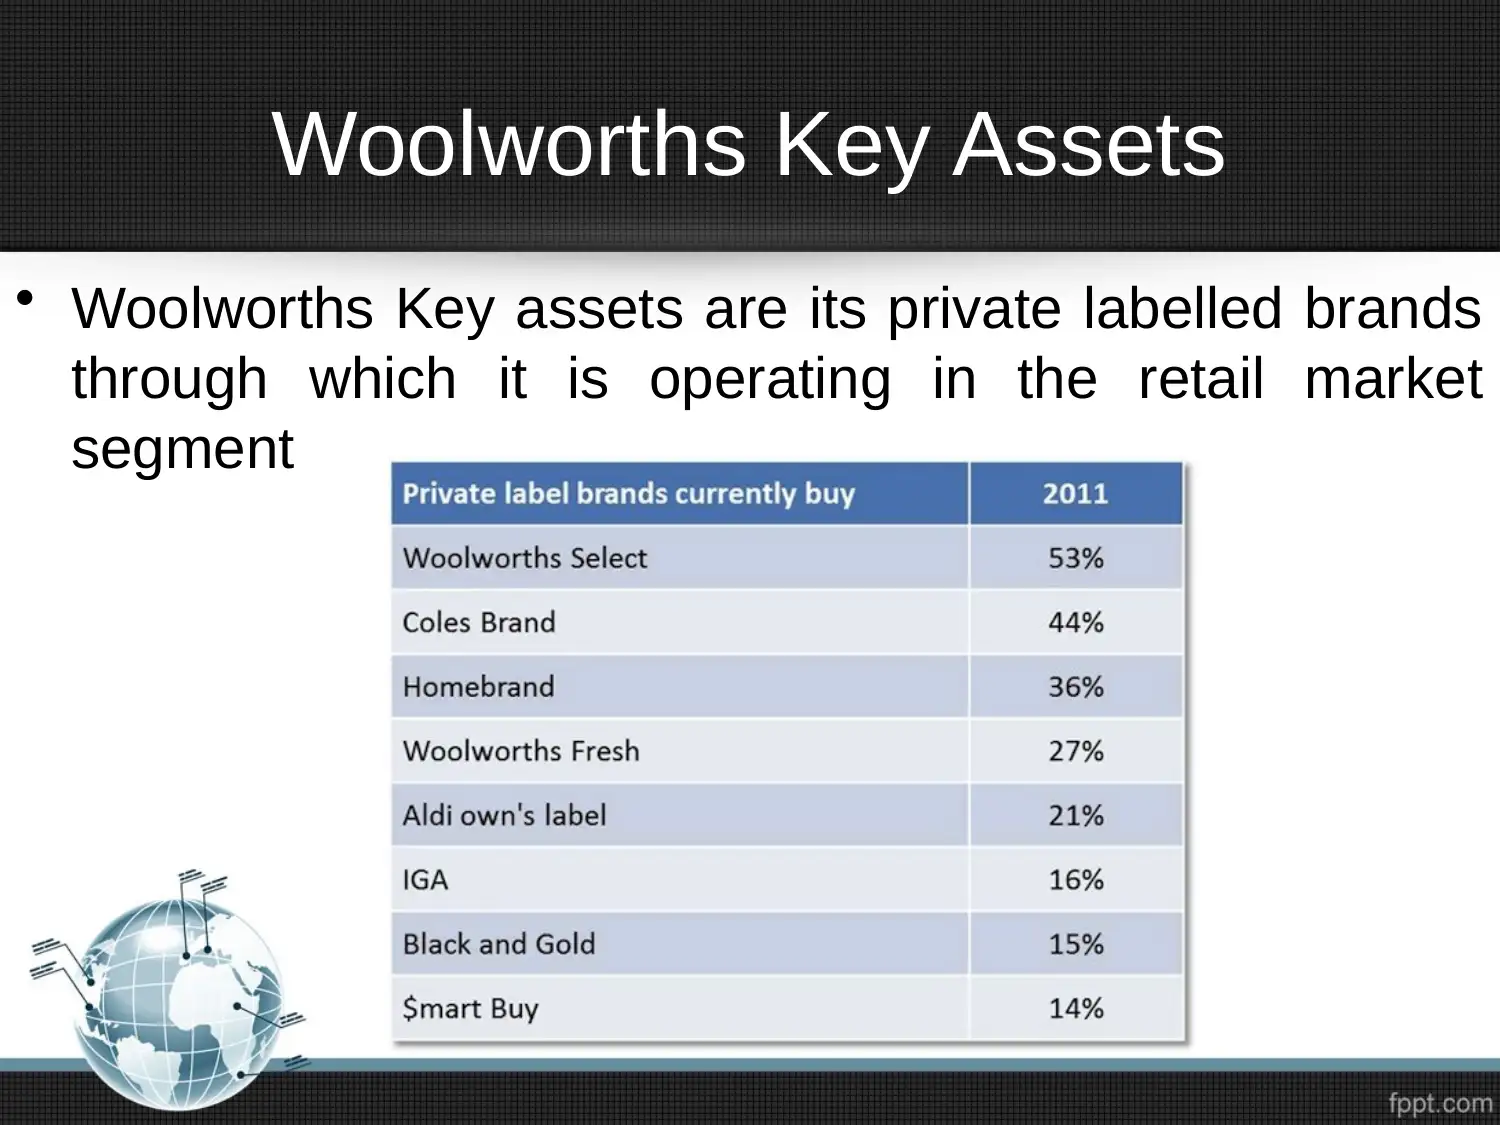
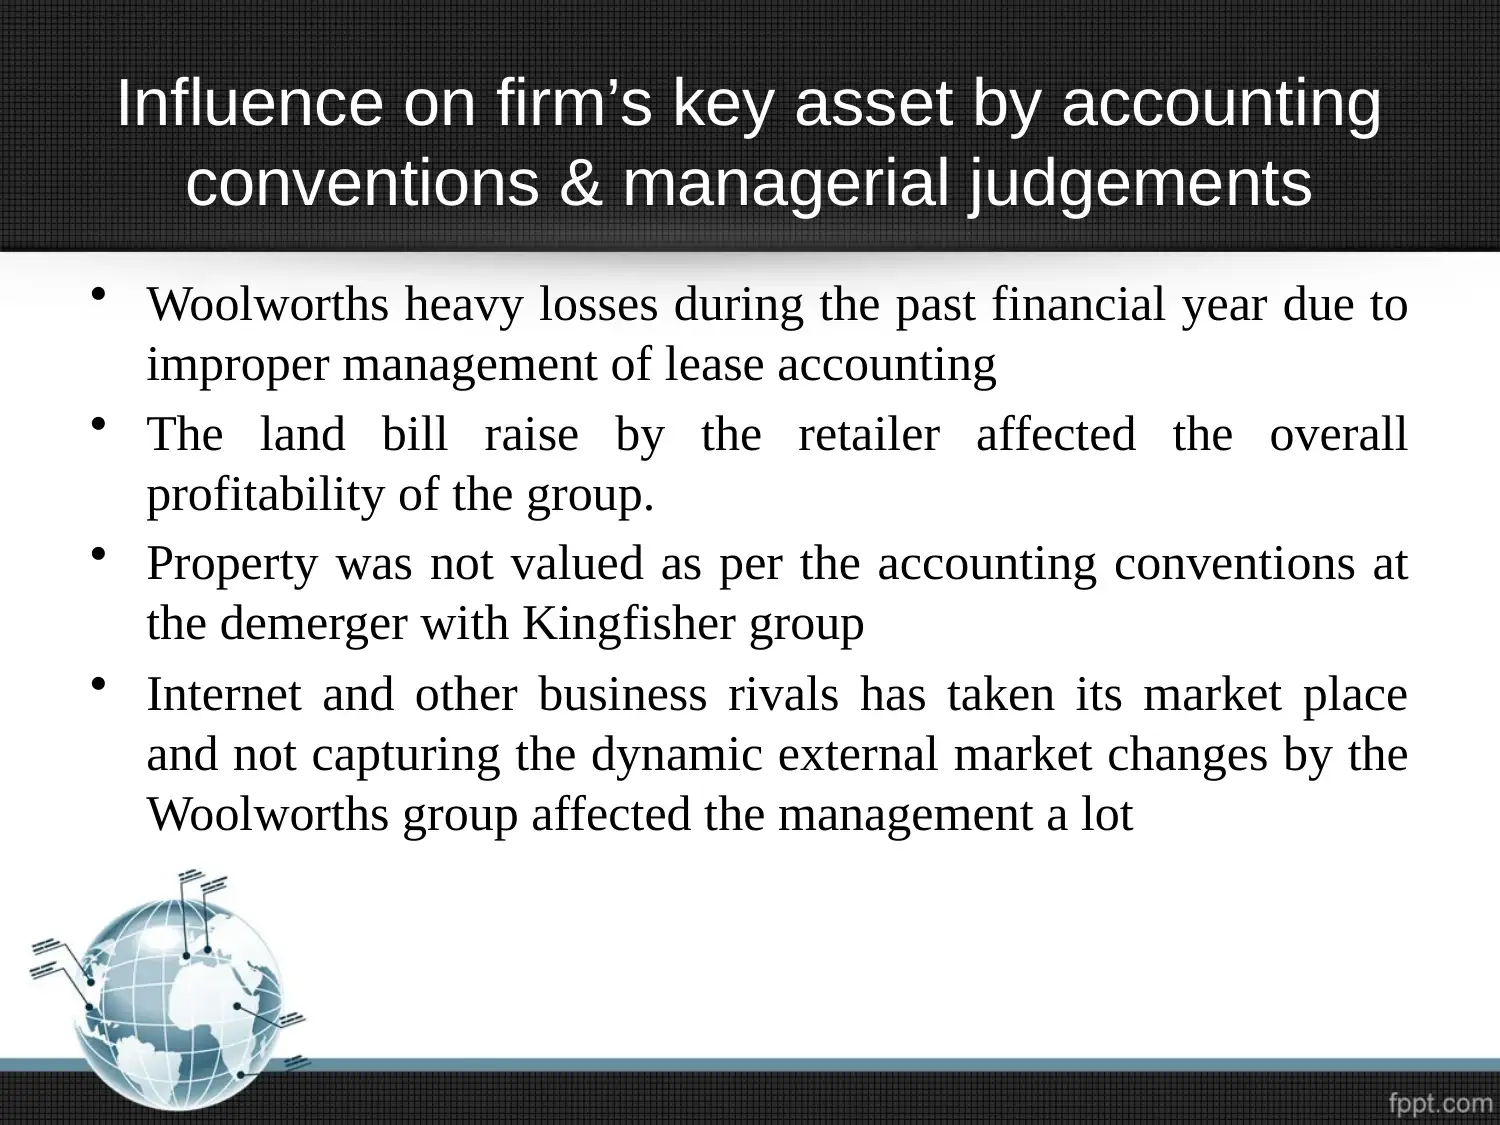
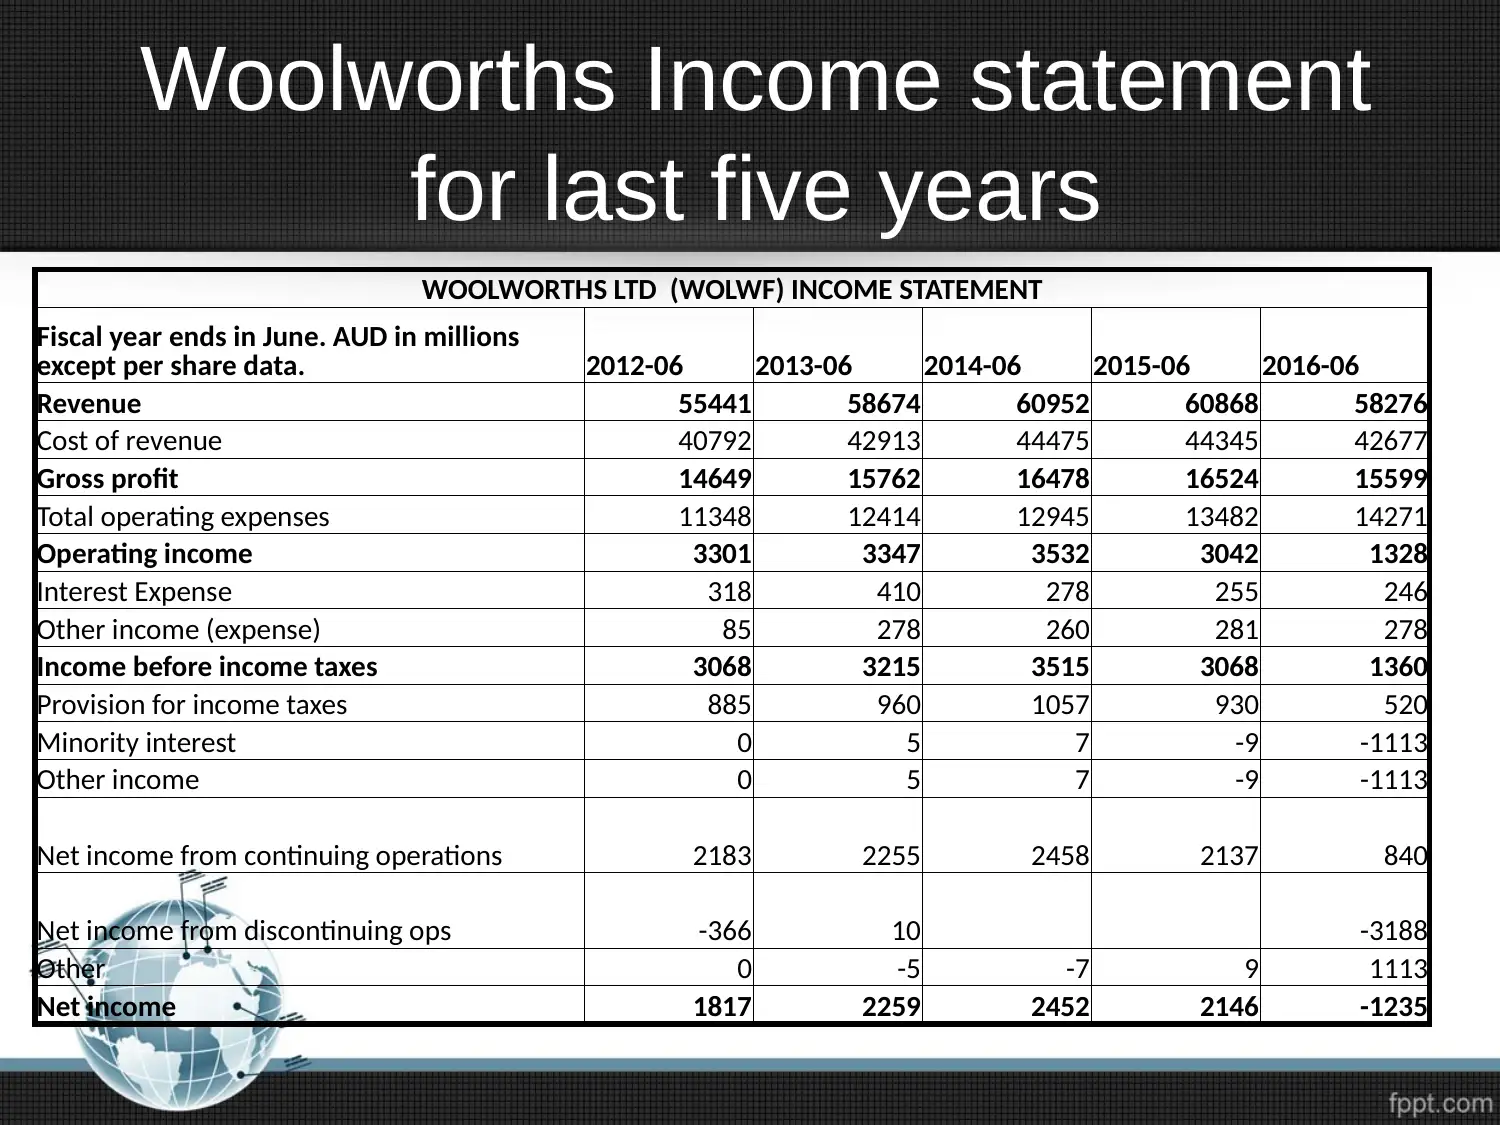
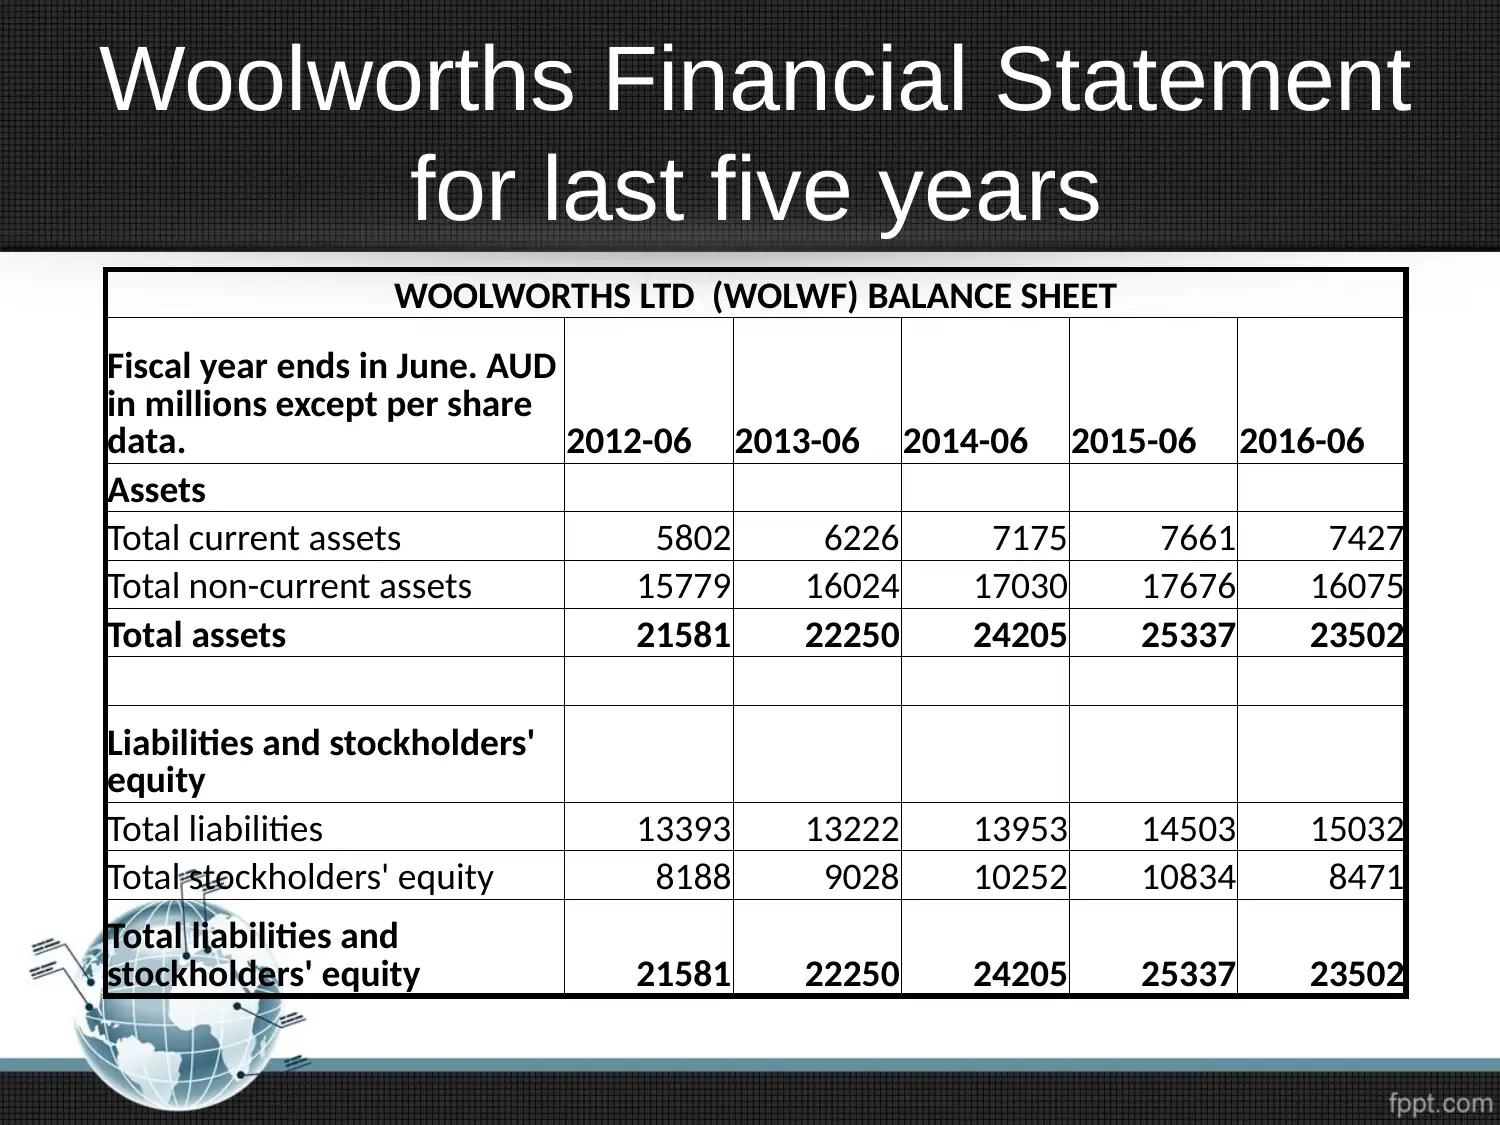
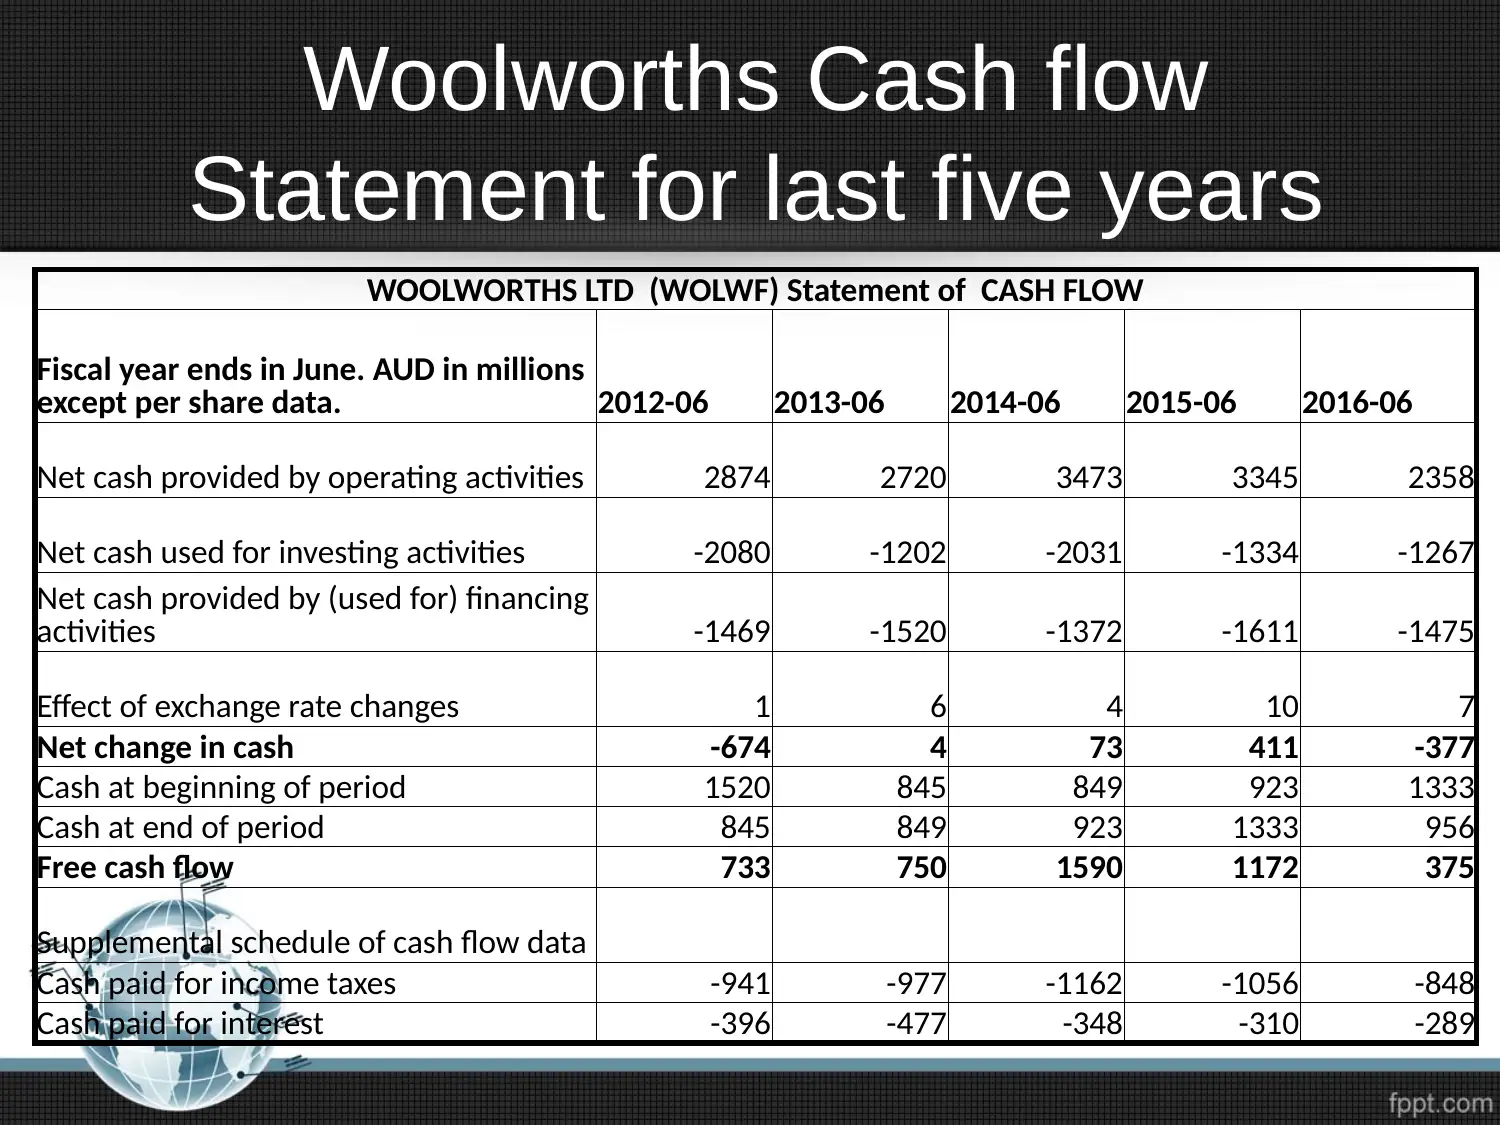
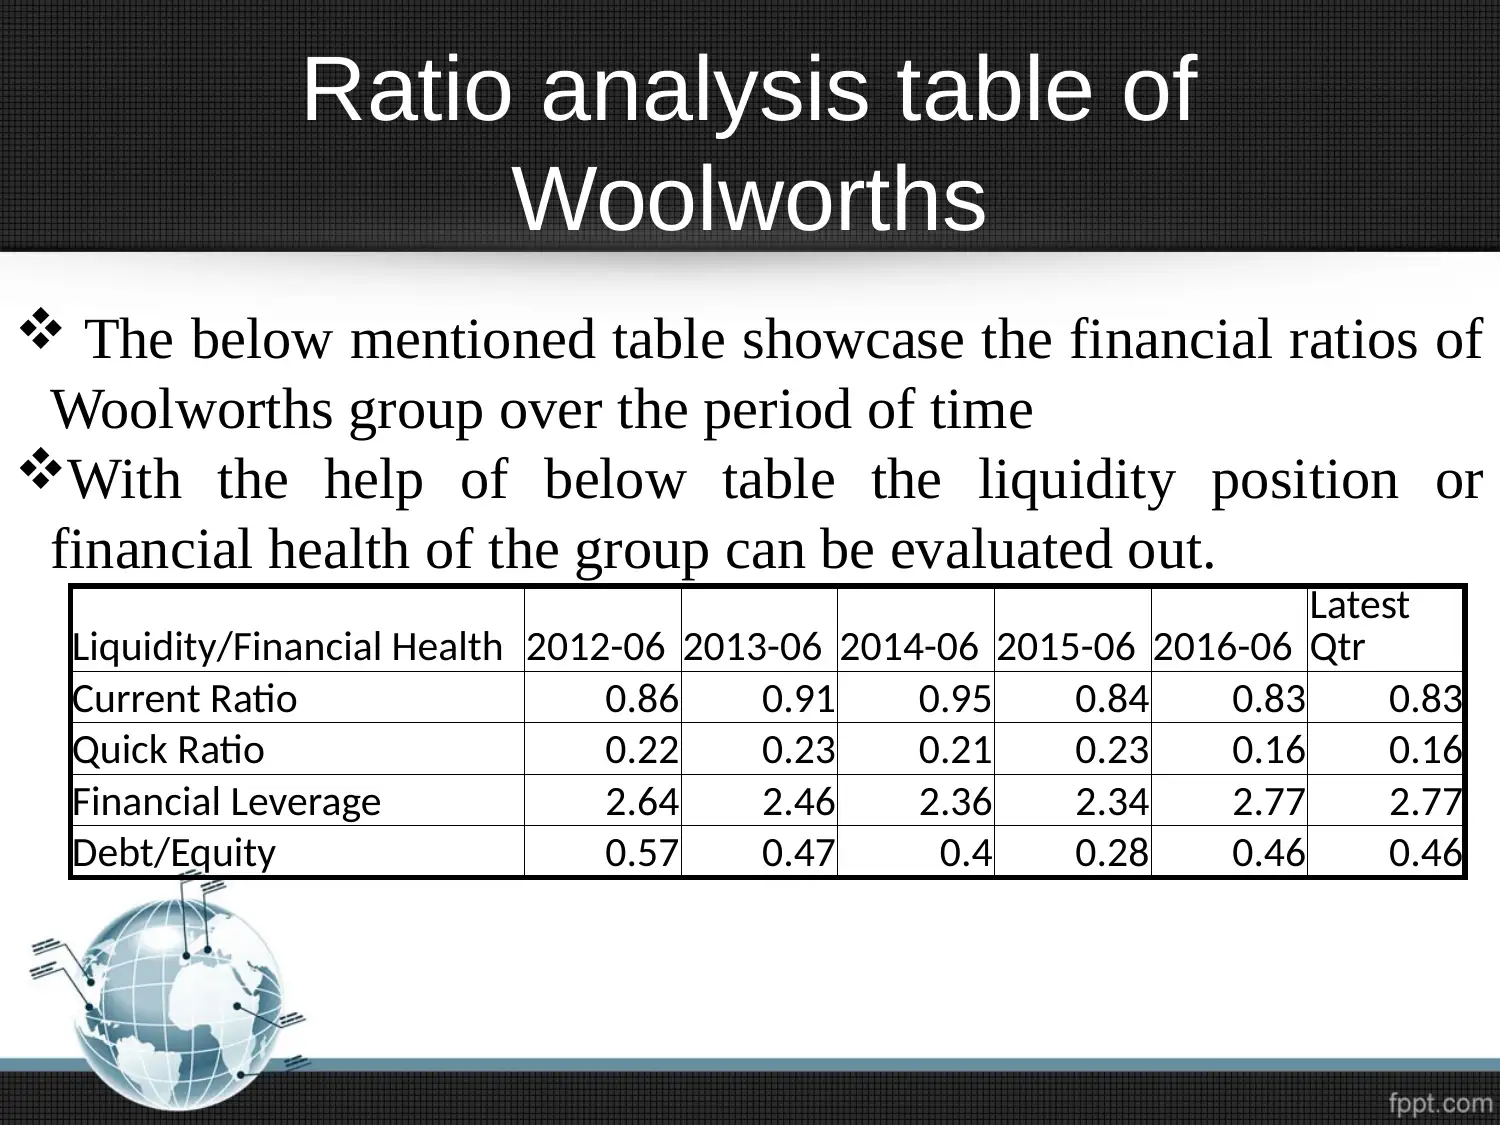
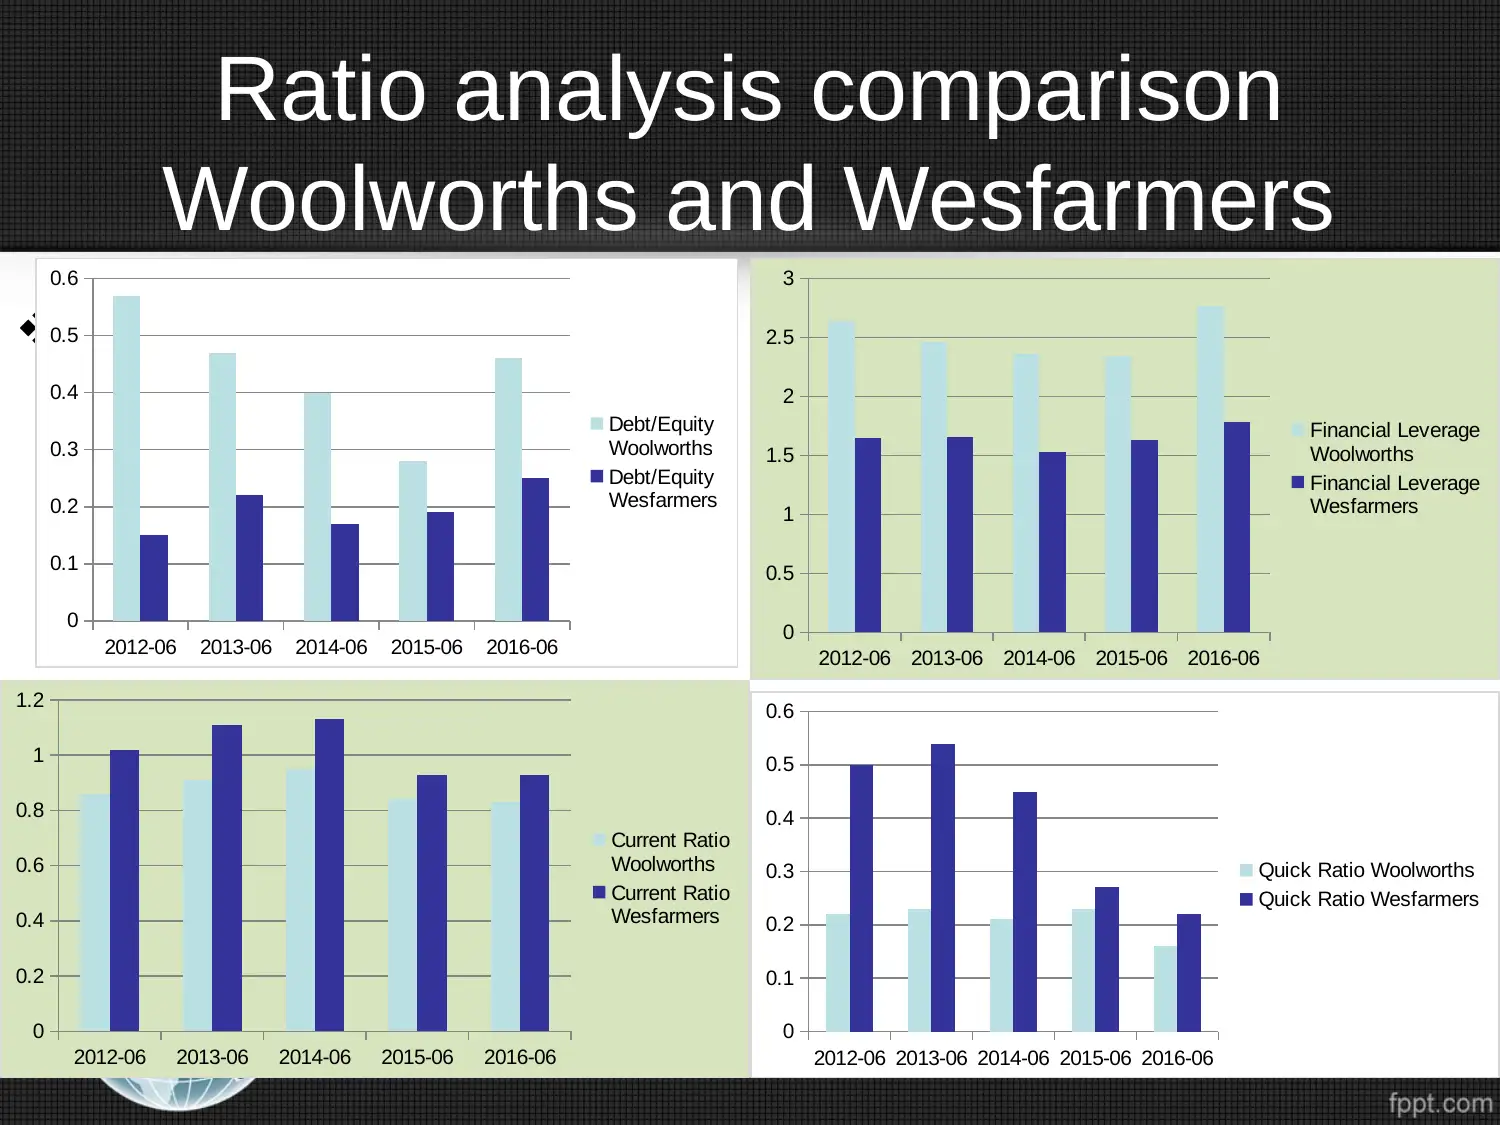
This report provides a comprehensive financial analysis of Woolworths Group, an ASX-listed retail company. It begins with an overview of Woolworths, including its history, market share, and key assets. The analysis delves into the company's financial statements (income statement, balance sheet, and cash flow statement) for the past five years, highlighting key trends and influences. It examines the impact of accounting conventions and managerial judgments on Woolworths' financial performance, particularly noting losses due to lease accounting and competitive pressures. The report includes a ratio analysis comparing Woolworths to Wesfarmers, focusing on liquidity, financial leverage, and efficiency. The analysis concludes with a discussion of Woolworths' shareholder equity position and solvency ratios, referencing external sources for supporting data and insights. Desklib is a platform where students can find similar solved assignments and study resources.
1 out of 18
Related Documents


Your All-in-One AI-Powered Toolkit for Academic Success.
+13062052269
info@desklib.com
Available 24*7 on WhatsApp / Email
![[object Object]](/_next/static/media/star-bottom.7253800d.svg)
Copyright © 2020–2026 A2Z Services. All Rights Reserved. Developed and managed by ZUCOL.