Solution: Maths and Statistics for Social Scientists Assessment 2
VerifiedAdded on 2023/01/10
|6
|687
|62
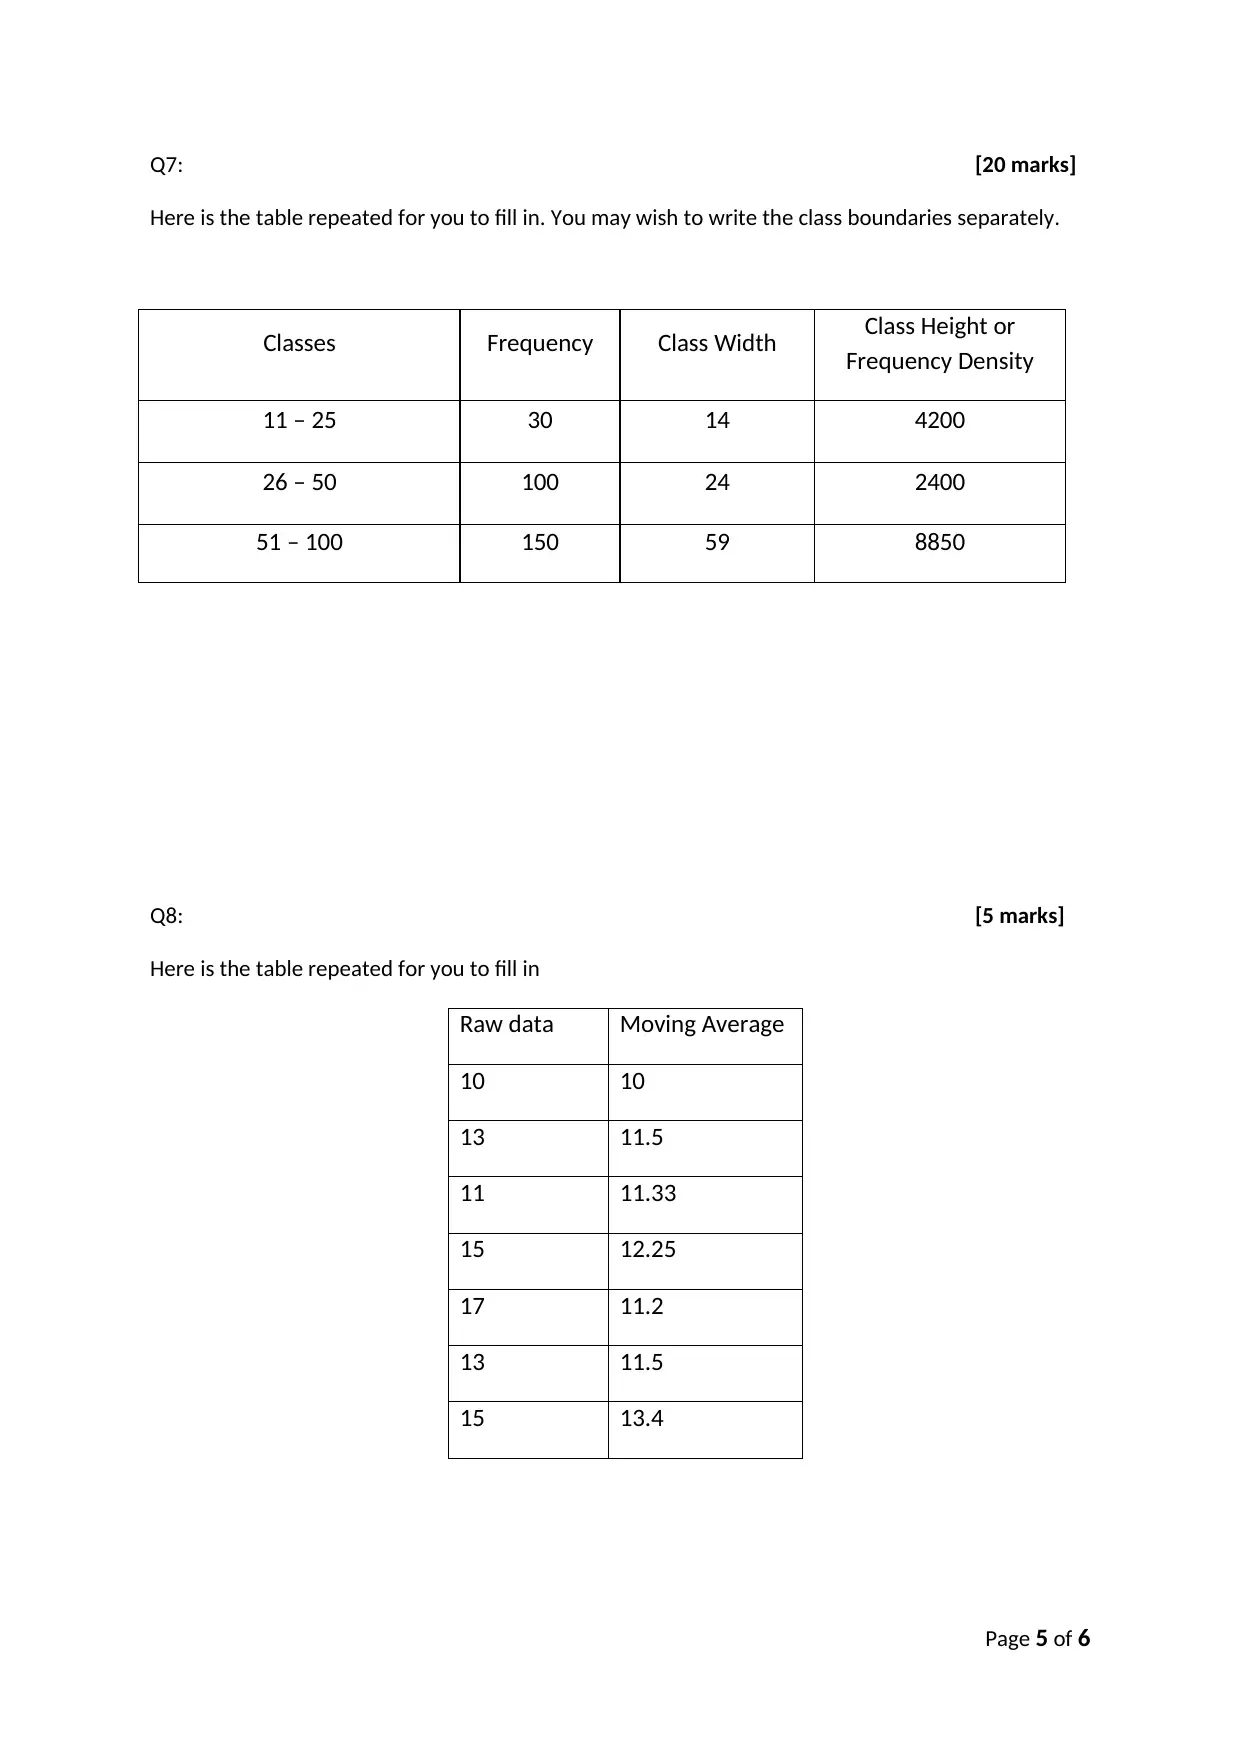
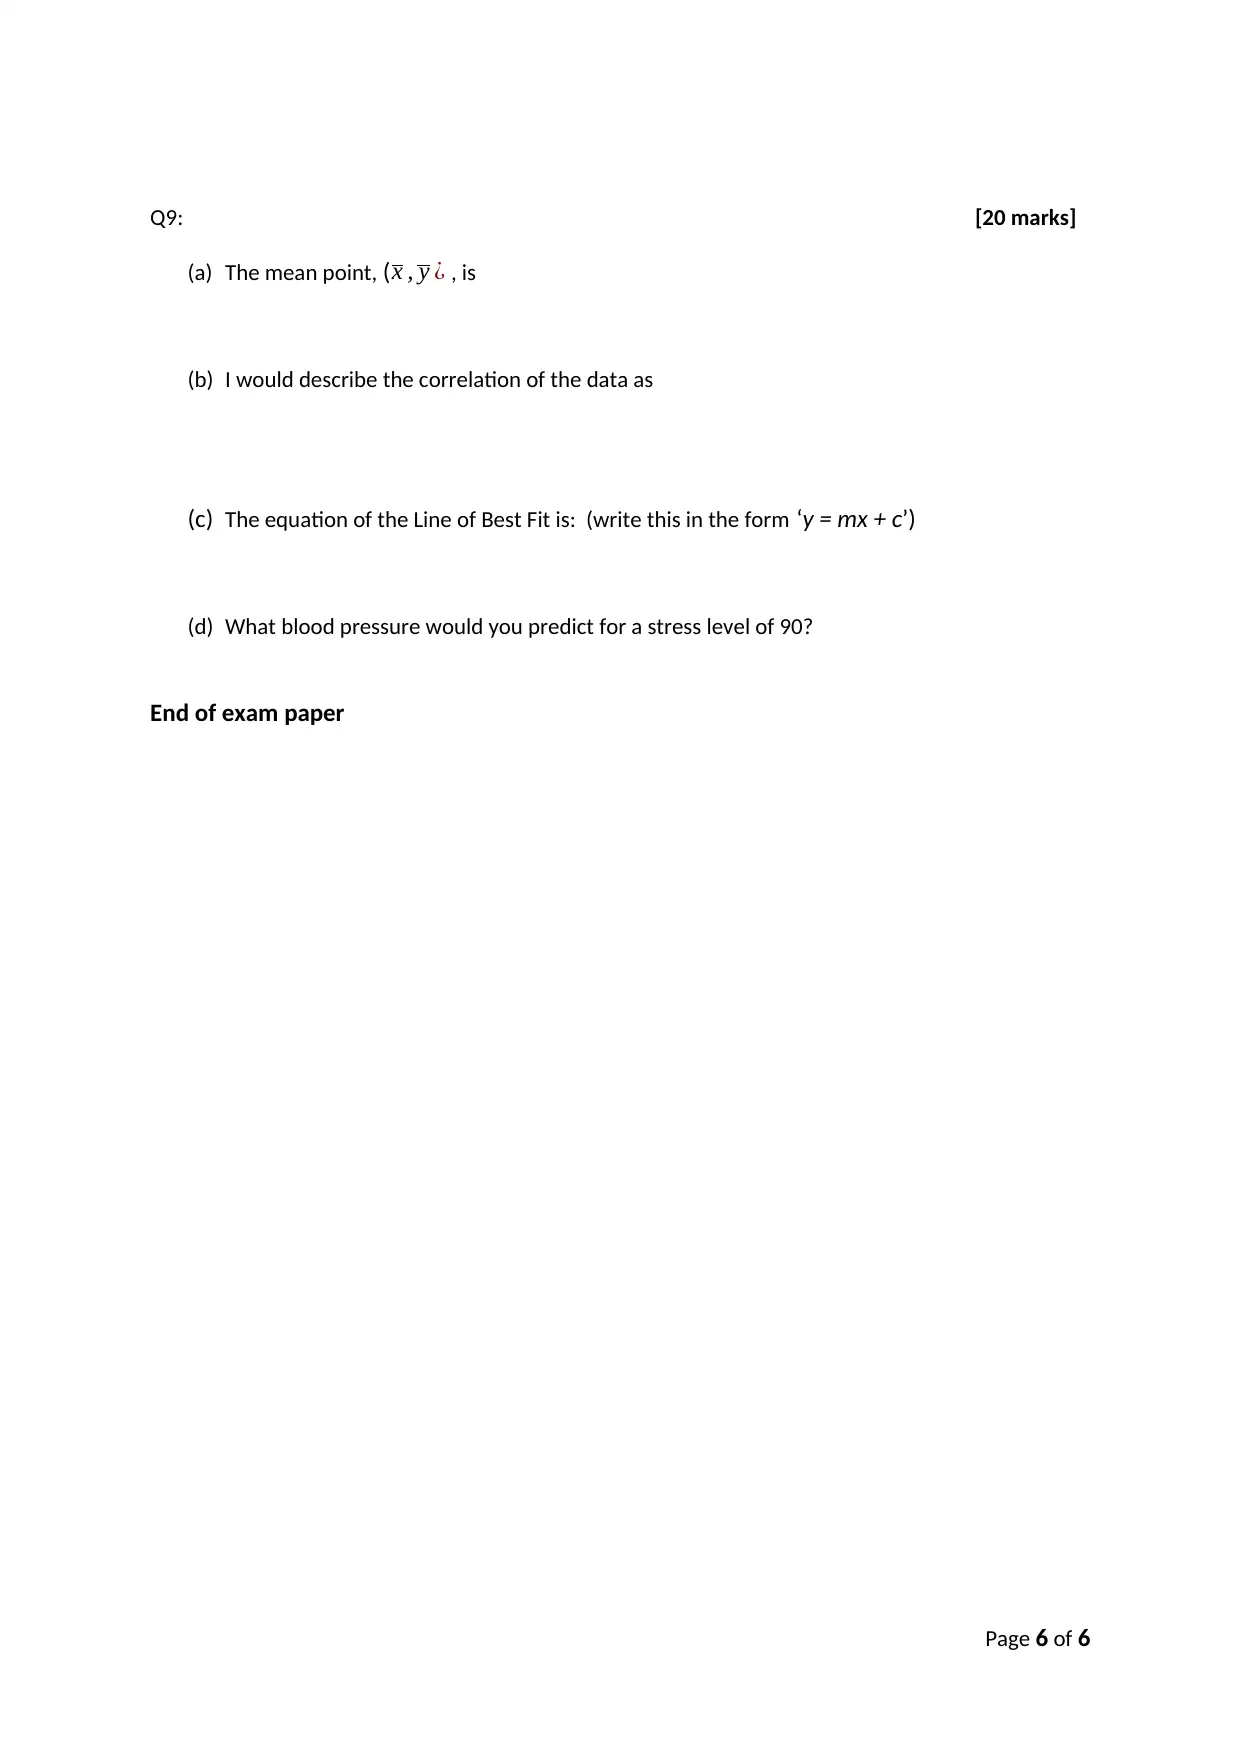
Homework Assignment
AI Summary
This document provides a comprehensive solution to the Maths and Statistics for Social Scientists Assessment 2. The solution includes answers to all nine questions, covering a range of statistical concepts such as ratios, proportions, mode, mean, median, variance, linear equations, discrete data, chart types, frequency distributions, moving averages, and correlation. Detailed workings and calculations are provided for each question, ensuring a clear understanding of the problem-solving process. The assessment also involves the interpretation and analysis of data, the creation of tables and charts, and the application of statistical methods to real-world scenarios. The solution is designed to assist students in understanding and mastering the key concepts of statistics relevant to social sciences.
1 out of 6
Related Documents


Your All-in-One AI-Powered Toolkit for Academic Success.
+13062052269
info@desklib.com
Available 24*7 on WhatsApp / Email
![[object Object]](/_next/static/media/star-bottom.7253800d.svg)
Copyright © 2020–2026 A2Z Services. All Rights Reserved. Developed and managed by ZUCOL.