SIT717 Assignment 2: Time Series Forecasting of Air-Quality Data
VerifiedAdded on 2022/10/19
|45
|5008
|72
Report
AI Summary
This technical report explores time series forecasting applied to air quality data. The study utilizes linear regression and data mining techniques to predict temperature, relative humidity, and absolute humidity. The dataset comprises weather characteristics collected from chemical sensors, focusing on hourly data from 2004 to 2005. The report compares the effectiveness of linear regression and time series forecasting models, evaluating their performance based on various error metrics. The analysis includes detailed results, evaluations, and demonstrations of both methods, with a focus on predicting future values for temperature and humidity. The document concludes by comparing the two methods. The report also includes the prediction of CO and NOx concentrations. This assignment is from the course SIT717, and is a technical report based on the student's data analysis.
Running head: TIME SERIES FORECASTING OF AIR-QUALITY DATA
Time Series Forecasting of Air-Quality Data
Name of the Student
Name of the University
Author Note
Time Series Forecasting of Air-Quality Data
Name of the Student
Name of the University
Author Note
Paraphrase This Document
Need a fresh take? Get an instant paraphrase of this document with our AI Paraphraser
1TIME SERIES FORECASTING OF AIR-QUALITY DATA
Abstract:
Weather forecasting is important because it helps to determine the expectations of
future climate. The forecasting of weather is the prediction of weather through the techniques
of machine learning. In addition to the forecast of the atmospheric phenomenon, weather
forecasting of weather also involves guessing of changes in the outside of the earth that is
caused by the atmospheric conditions. The forecasting of weather is still done in the same
way as it was done by the early humans but many tools that are modern are used to compute
humidity, temperature, wind and the humidity. Even the numerically calculated forecast that
is sophisticated and is made on a computer needs a set of computation of the atmospheric
conditions- a picture of wind, temperature and the other elements that are basic. Since the
mid-20th century, the computers that are digital have made it feasible to compute the changes
in the atmospheric conditions objectively and mathematically in a way such that everyone
can get the outputs that are same from the initial conditions that are same. The acquisition of
the numerical models of prediction of weather brought the computer experts and specialists in
statistics and numerical processing to a scene in order to work with the scientists that work on
atmosphere and meteorology. The increased ability to analyse and process the data of the
weather that has triggered the interest of the meteorologists in securing more observations
that are of great accuracy. In this report the temperature, relative humidity and the absolute
humidity is predicted taking date as the independent variable and the ones that are being
predicted are dependent on date.
2TIME SERIES FORECASTING OF AIR-QUALITY DATA
Table of Contents
Introduction:...............................................................................................................................4
Dataset summary:.......................................................................................................................5
Data mining techniques:.............................................................................................................5
Results, evaluation and demonstration:......................................................................................7
Conclusions:.............................................................................................................................44
References:...............................................................................................................................45
⊘ This is a preview!⊘
Do you want full access?
Subscribe today to unlock all pages.
Trusted by 1+ million students worldwide
3TIME SERIES FORECASTING OF AIR-QUALITY DATA
Introduction:
In this particular report time series forecasting is used as one of the most essential part
of machine learning that is sometimes forgotten. It is essential as there are problems related to
prediction that sometimes involves a component of time. These problems are often neglected
because it is the component that makes the problems of time series difficult to handle. Time
plays an essential role in the datasets of normal machine learning datasets. By the prediction
technique the unknown data which is the outside the range of selected sample is predicted. In
the predicted data the future outcomes are guessed, however, all the previous data have been
treated by equal expertise. The main dynamics of the model are overcome by the ‘concept
drift’ theory. Time series dataset is different from normal data as the dependence of the
values of variables in this method are represented by the time dimension. By the time
dimension an additional structure and information is obtained from the data. The report deals
with the prediction of the relative humidity, temperature and absolute humidity by taking
time as the independent variable and the ones that are being predicted are taken as the
dependent variable. The characteristics of the data set are multivariate and time-series.
The main objective of this experiment is to predict the weather data in future of February
2005 by time series furcating method. The humidity (relative or absolute) and temperature are
main properties of air and this these two are predicted for 10 hours in future of the given
sample on hourly basis. Additionally, the same fitting of data is performed by linear
regression where the same relative humidity and temperature is fitted by the predictors except
time and date (Junior et al. 2019). The two methods are compared and the best method is
selected based on the properties of fitting output like absolute error and the relative error.
Paraphrase This Document
Need a fresh take? Get an instant paraphrase of this document with our AI Paraphraser
4TIME SERIES FORECASTING OF AIR-QUALITY DATA
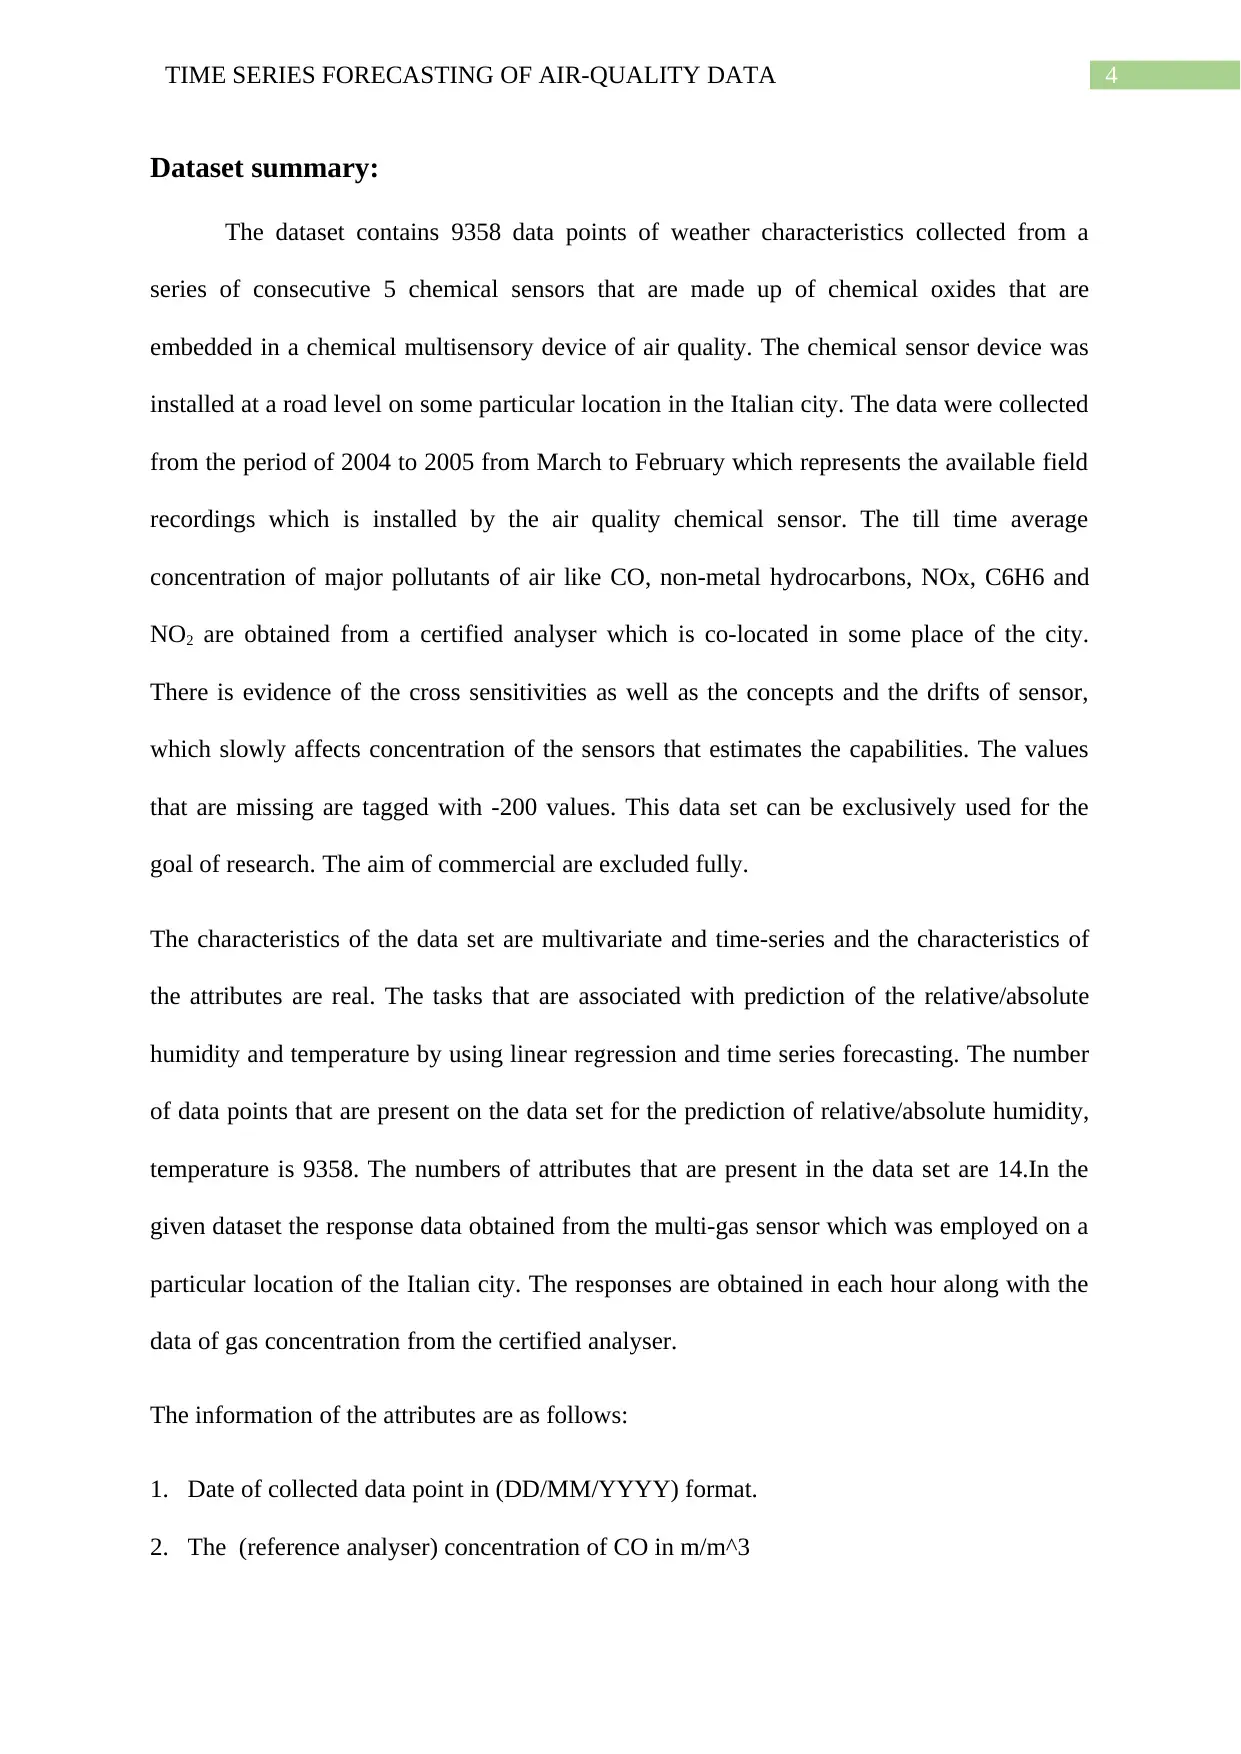
Dataset summary:
The dataset contains 9358 data points of weather characteristics collected from a
series of consecutive 5 chemical sensors that are made up of chemical oxides that are
embedded in a chemical multisensory device of air quality. The chemical sensor device was
installed at a road level on some particular location in the Italian city. The data were collected
from the period of 2004 to 2005 from March to February which represents the available field
recordings which is installed by the air quality chemical sensor. The till time average
concentration of major pollutants of air like CO, non-metal hydrocarbons, NOx, C6H6 and
NO2 are obtained from a certified analyser which is co-located in some place of the city.
There is evidence of the cross sensitivities as well as the concepts and the drifts of sensor,
which slowly affects concentration of the sensors that estimates the capabilities. The values
that are missing are tagged with -200 values. This data set can be exclusively used for the
goal of research. The aim of commercial are excluded fully.
The characteristics of the data set are multivariate and time-series and the characteristics of
the attributes are real. The tasks that are associated with prediction of the relative/absolute
humidity and temperature by using linear regression and time series forecasting. The number
of data points that are present on the data set for the prediction of relative/absolute humidity,
temperature is 9358. The numbers of attributes that are present in the data set are 14.In the
given dataset the response data obtained from the multi-gas sensor which was employed on a
particular location of the Italian city. The responses are obtained in each hour along with the
data of gas concentration from the certified analyser.
The information of the attributes are as follows:
1. Date of collected data point in (DD/MM/YYYY) format.
2. The (reference analyser) concentration of CO in m/m^3
5TIME SERIES FORECASTING OF AIR-QUALITY DATA
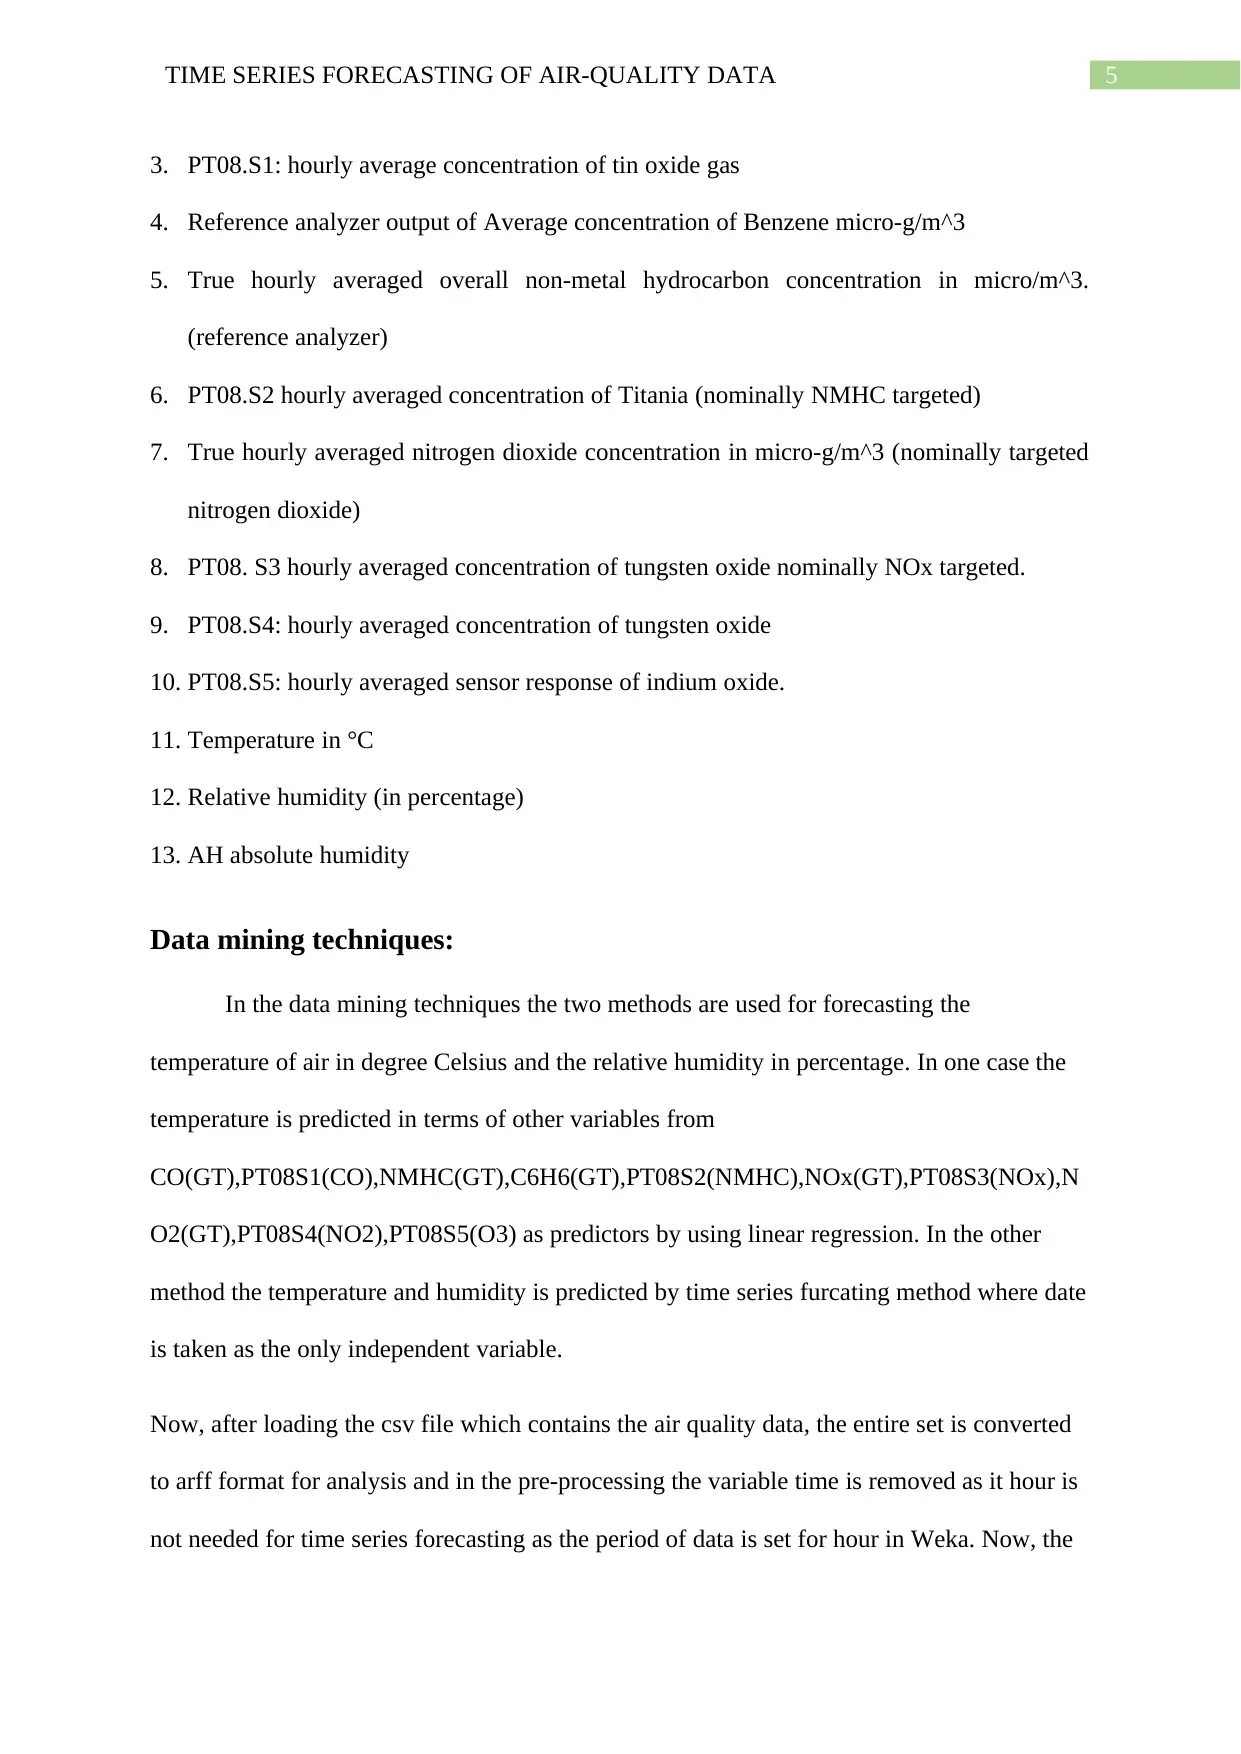
3. PT08.S1: hourly average concentration of tin oxide gas
4. Reference analyzer output of Average concentration of Benzene micro-g/m^3
5. True hourly averaged overall non-metal hydrocarbon concentration in micro/m^3.
(reference analyzer)
6. PT08.S2 hourly averaged concentration of Titania (nominally NMHC targeted)
7. True hourly averaged nitrogen dioxide concentration in micro-g/m^3 (nominally targeted
nitrogen dioxide)
8. PT08. S3 hourly averaged concentration of tungsten oxide nominally NOx targeted.
9. PT08.S4: hourly averaged concentration of tungsten oxide
10. PT08.S5: hourly averaged sensor response of indium oxide.
11. Temperature in °C
12. Relative humidity (in percentage)
13. AH absolute humidity
Data mining techniques:
In the data mining techniques the two methods are used for forecasting the
temperature of air in degree Celsius and the relative humidity in percentage. In one case the
temperature is predicted in terms of other variables from
CO(GT),PT08S1(CO),NMHC(GT),C6H6(GT),PT08S2(NMHC),NOx(GT),PT08S3(NOx),N
O2(GT),PT08S4(NO2),PT08S5(O3) as predictors by using linear regression. In the other
method the temperature and humidity is predicted by time series furcating method where date
is taken as the only independent variable.
Now, after loading the csv file which contains the air quality data, the entire set is converted
to arff format for analysis and in the pre-processing the variable time is removed as it hour is
not needed for time series forecasting as the period of data is set for hour in Weka. Now, the
⊘ This is a preview!⊘
Do you want full access?
Subscribe today to unlock all pages.
Trusted by 1+ million students worldwide
6TIME SERIES FORECASTING OF AIR-QUALITY DATA
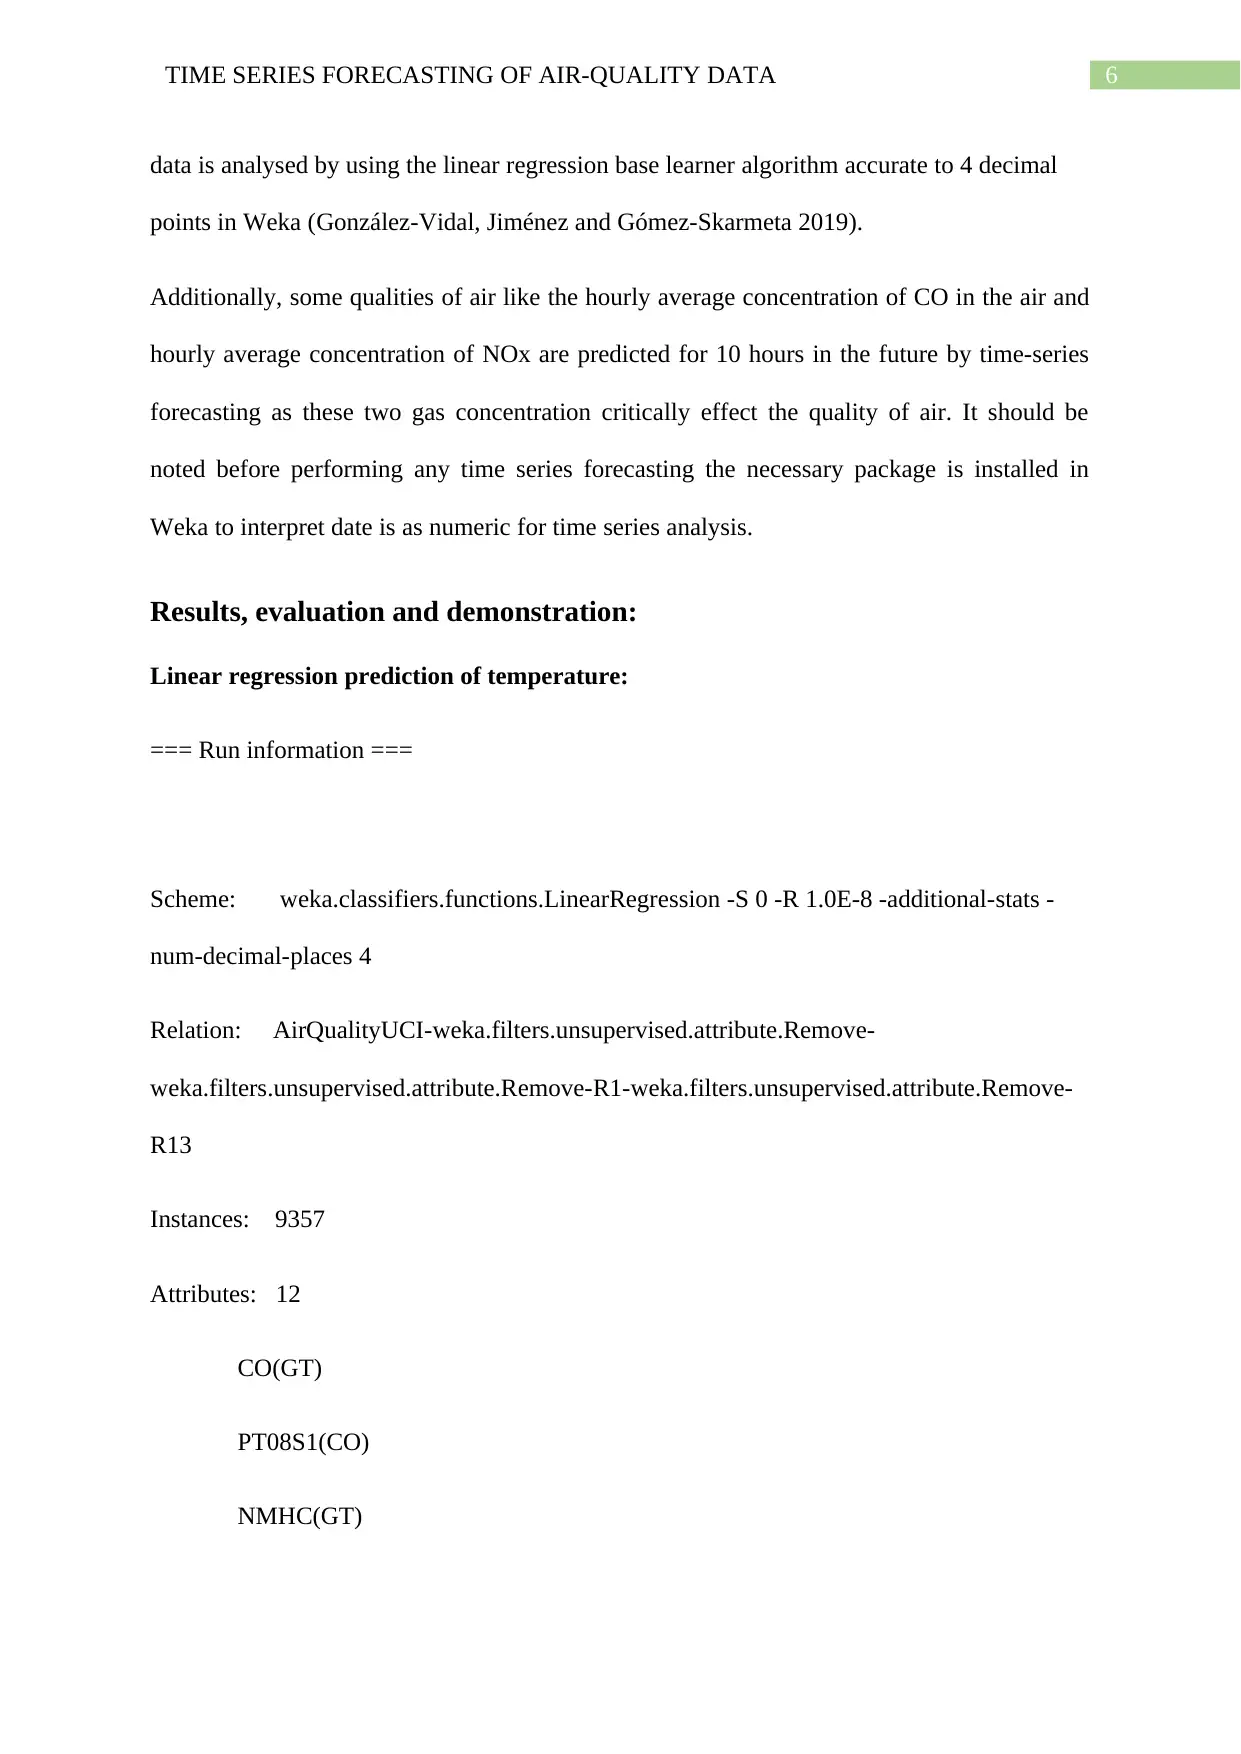
data is analysed by using the linear regression base learner algorithm accurate to 4 decimal
points in Weka (González-Vidal, Jiménez and Gómez-Skarmeta 2019).
Additionally, some qualities of air like the hourly average concentration of CO in the air and
hourly average concentration of NOx are predicted for 10 hours in the future by time-series
forecasting as these two gas concentration critically effect the quality of air. It should be
noted before performing any time series forecasting the necessary package is installed in
Weka to interpret date is as numeric for time series analysis.
Results, evaluation and demonstration:
Linear regression prediction of temperature:
=== Run information ===
Scheme: weka.classifiers.functions.LinearRegression -S 0 -R 1.0E-8 -additional-stats -
num-decimal-places 4
Relation: AirQualityUCI-weka.filters.unsupervised.attribute.Remove-
weka.filters.unsupervised.attribute.Remove-R1-weka.filters.unsupervised.attribute.Remove-
R13
Instances: 9357
Attributes: 12
CO(GT)
PT08S1(CO)
NMHC(GT)
Paraphrase This Document
Need a fresh take? Get an instant paraphrase of this document with our AI Paraphraser
7TIME SERIES FORECASTING OF AIR-QUALITY DATA
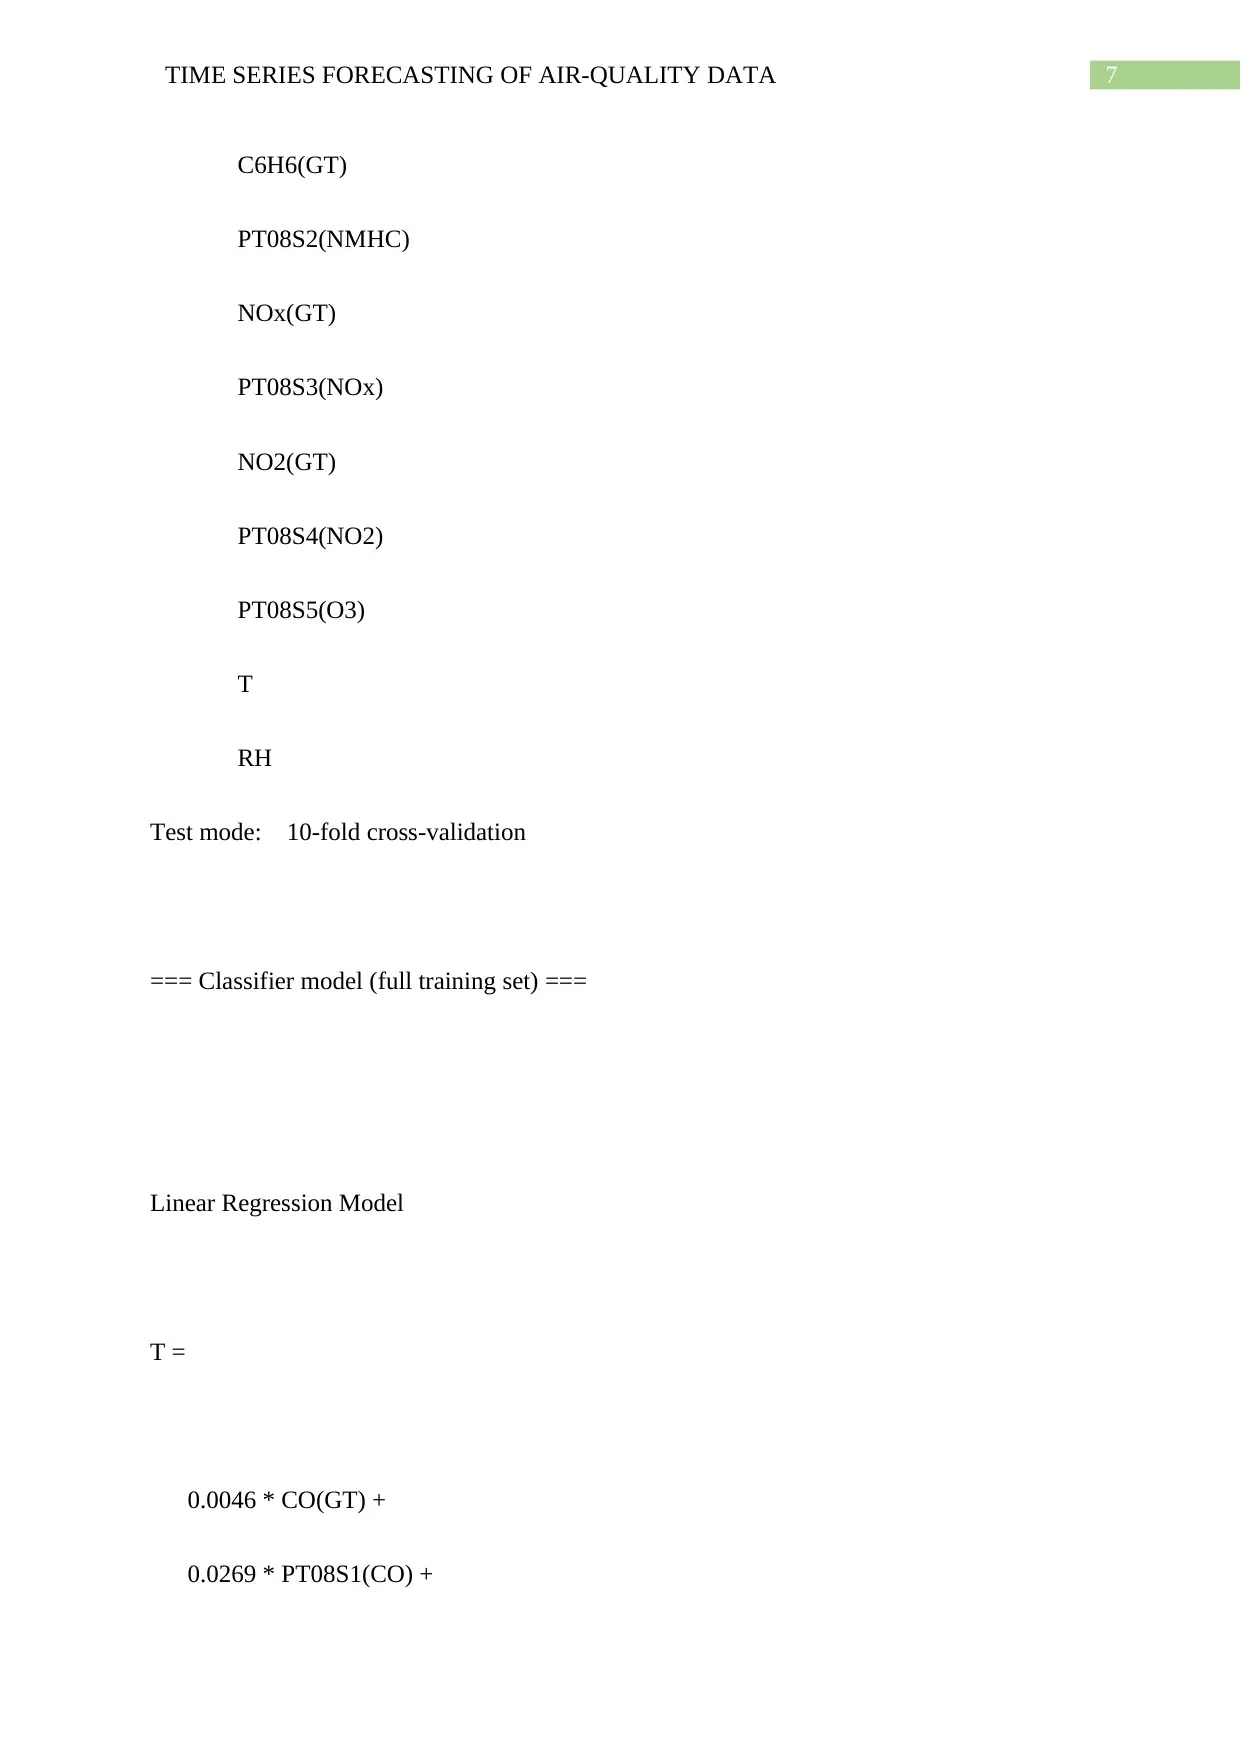
C6H6(GT)
PT08S2(NMHC)
NOx(GT)
PT08S3(NOx)
NO2(GT)
PT08S4(NO2)
PT08S5(O3)
T
RH
Test mode: 10-fold cross-validation
=== Classifier model (full training set) ===
Linear Regression Model
T =
0.0046 * CO(GT) +
0.0269 * PT08S1(CO) +
C6H6(GT)
PT08S2(NMHC)
NOx(GT)
PT08S3(NOx)
NO2(GT)
PT08S4(NO2)
PT08S5(O3)
T
RH
Test mode: 10-fold cross-validation
=== Classifier model (full training set) ===
Linear Regression Model
T =
0.0046 * CO(GT) +
0.0269 * PT08S1(CO) +
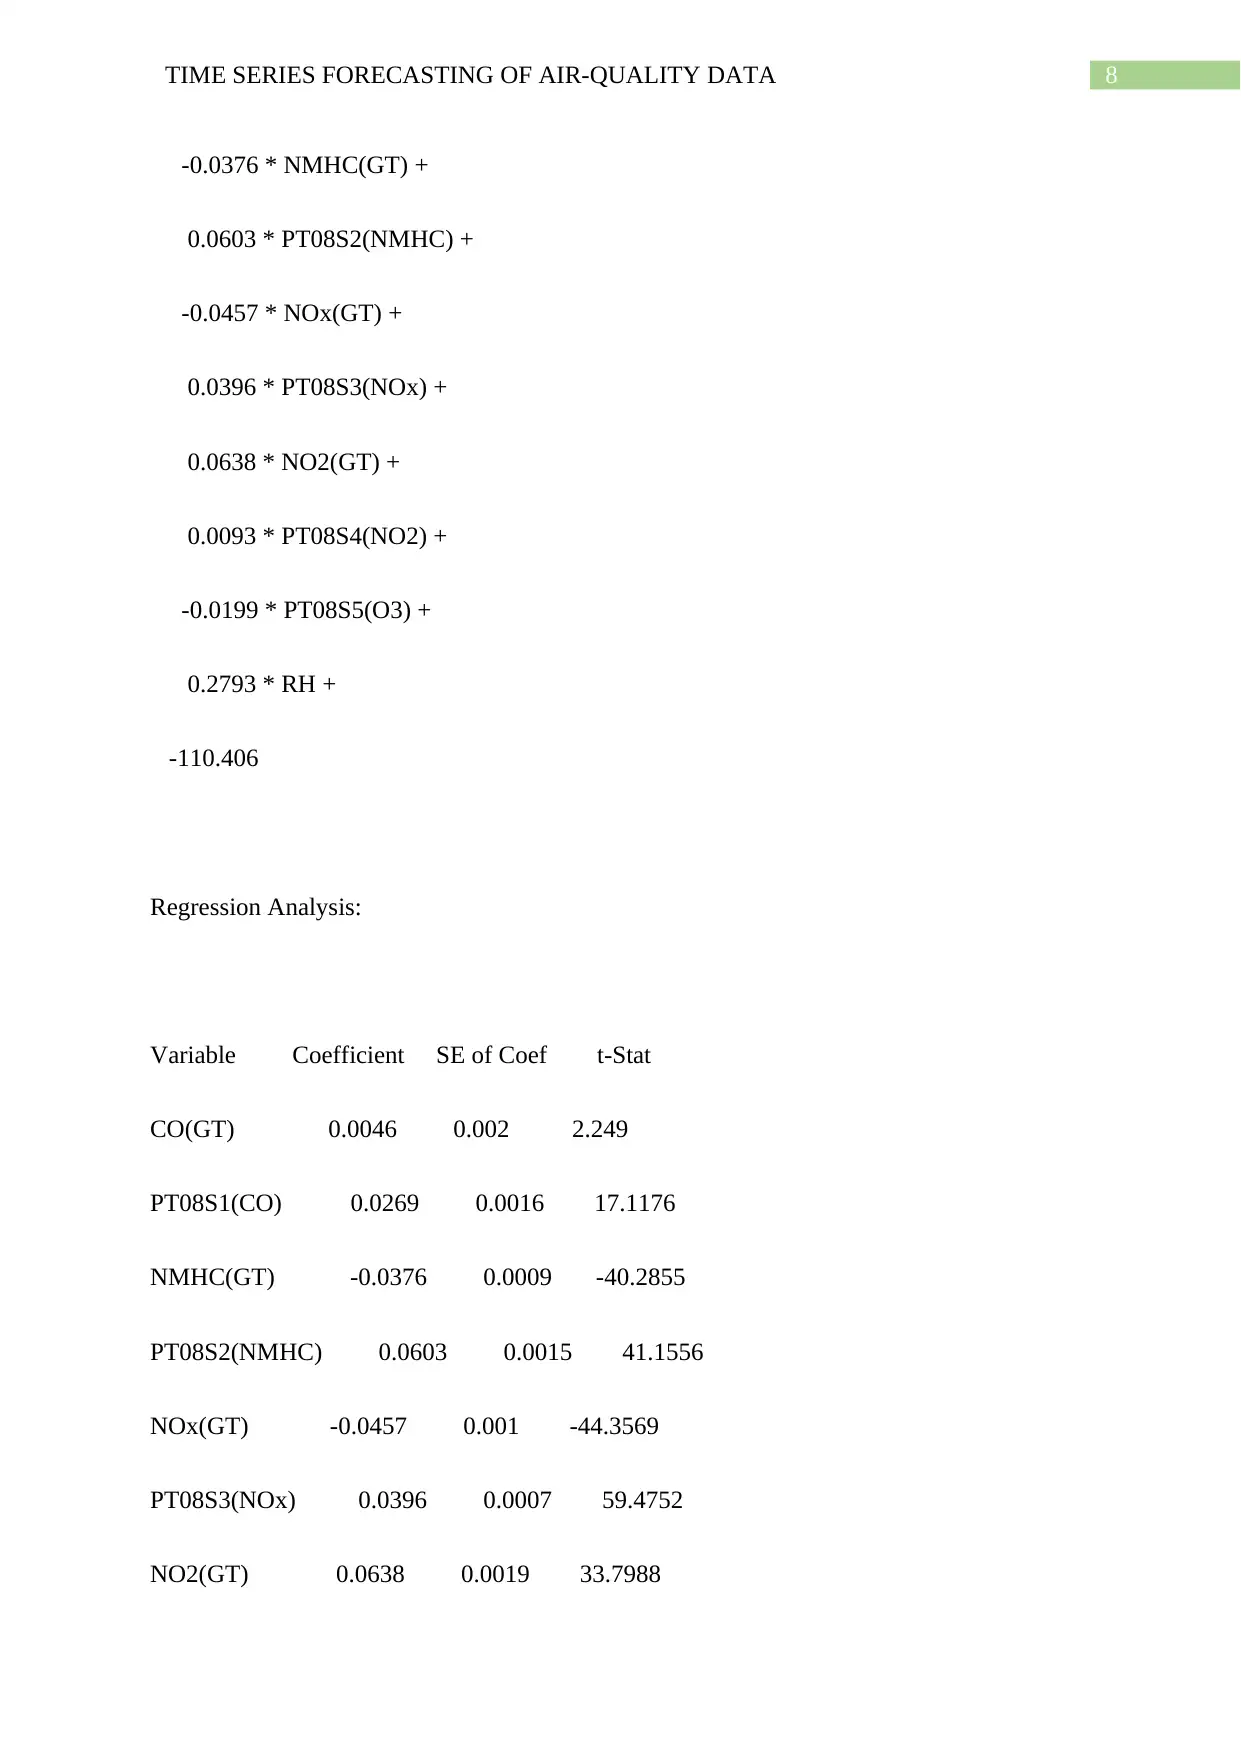
8TIME SERIES FORECASTING OF AIR-QUALITY DATA
-0.0376 * NMHC(GT) +
0.0603 * PT08S2(NMHC) +
-0.0457 * NOx(GT) +
0.0396 * PT08S3(NOx) +
0.0638 * NO2(GT) +
0.0093 * PT08S4(NO2) +
-0.0199 * PT08S5(O3) +
0.2793 * RH +
-110.406
Regression Analysis:
Variable Coefficient SE of Coef t-Stat
CO(GT) 0.0046 0.002 2.249
PT08S1(CO) 0.0269 0.0016 17.1176
NMHC(GT) -0.0376 0.0009 -40.2855
PT08S2(NMHC) 0.0603 0.0015 41.1556
NOx(GT) -0.0457 0.001 -44.3569
PT08S3(NOx) 0.0396 0.0007 59.4752
NO2(GT) 0.0638 0.0019 33.7988
⊘ This is a preview!⊘
Do you want full access?
Subscribe today to unlock all pages.
Trusted by 1+ million students worldwide
9TIME SERIES FORECASTING OF AIR-QUALITY DATA
PT08S4(NO2) 0.0093 0.0006 14.4045
PT08S5(O3) -0.0199 0.0008 -24.09
RH 0.2793 0.0059 47.3266
const -110.406 1.0529 -104.8572
Degrees of freedom = 9346
R^2 value = 0.9338
Adjusted R^2 = 0.93368
F-statistic = 13173.648
Time taken to build model: 0.09 seconds
=== Cross-validation ===
=== Summary ===
Correlation coefficient 0.9662
Mean absolute error 8.54
Root mean squared error 11.139
Relative absolute error 48.3804 %
Root relative squared error 25.7812 %
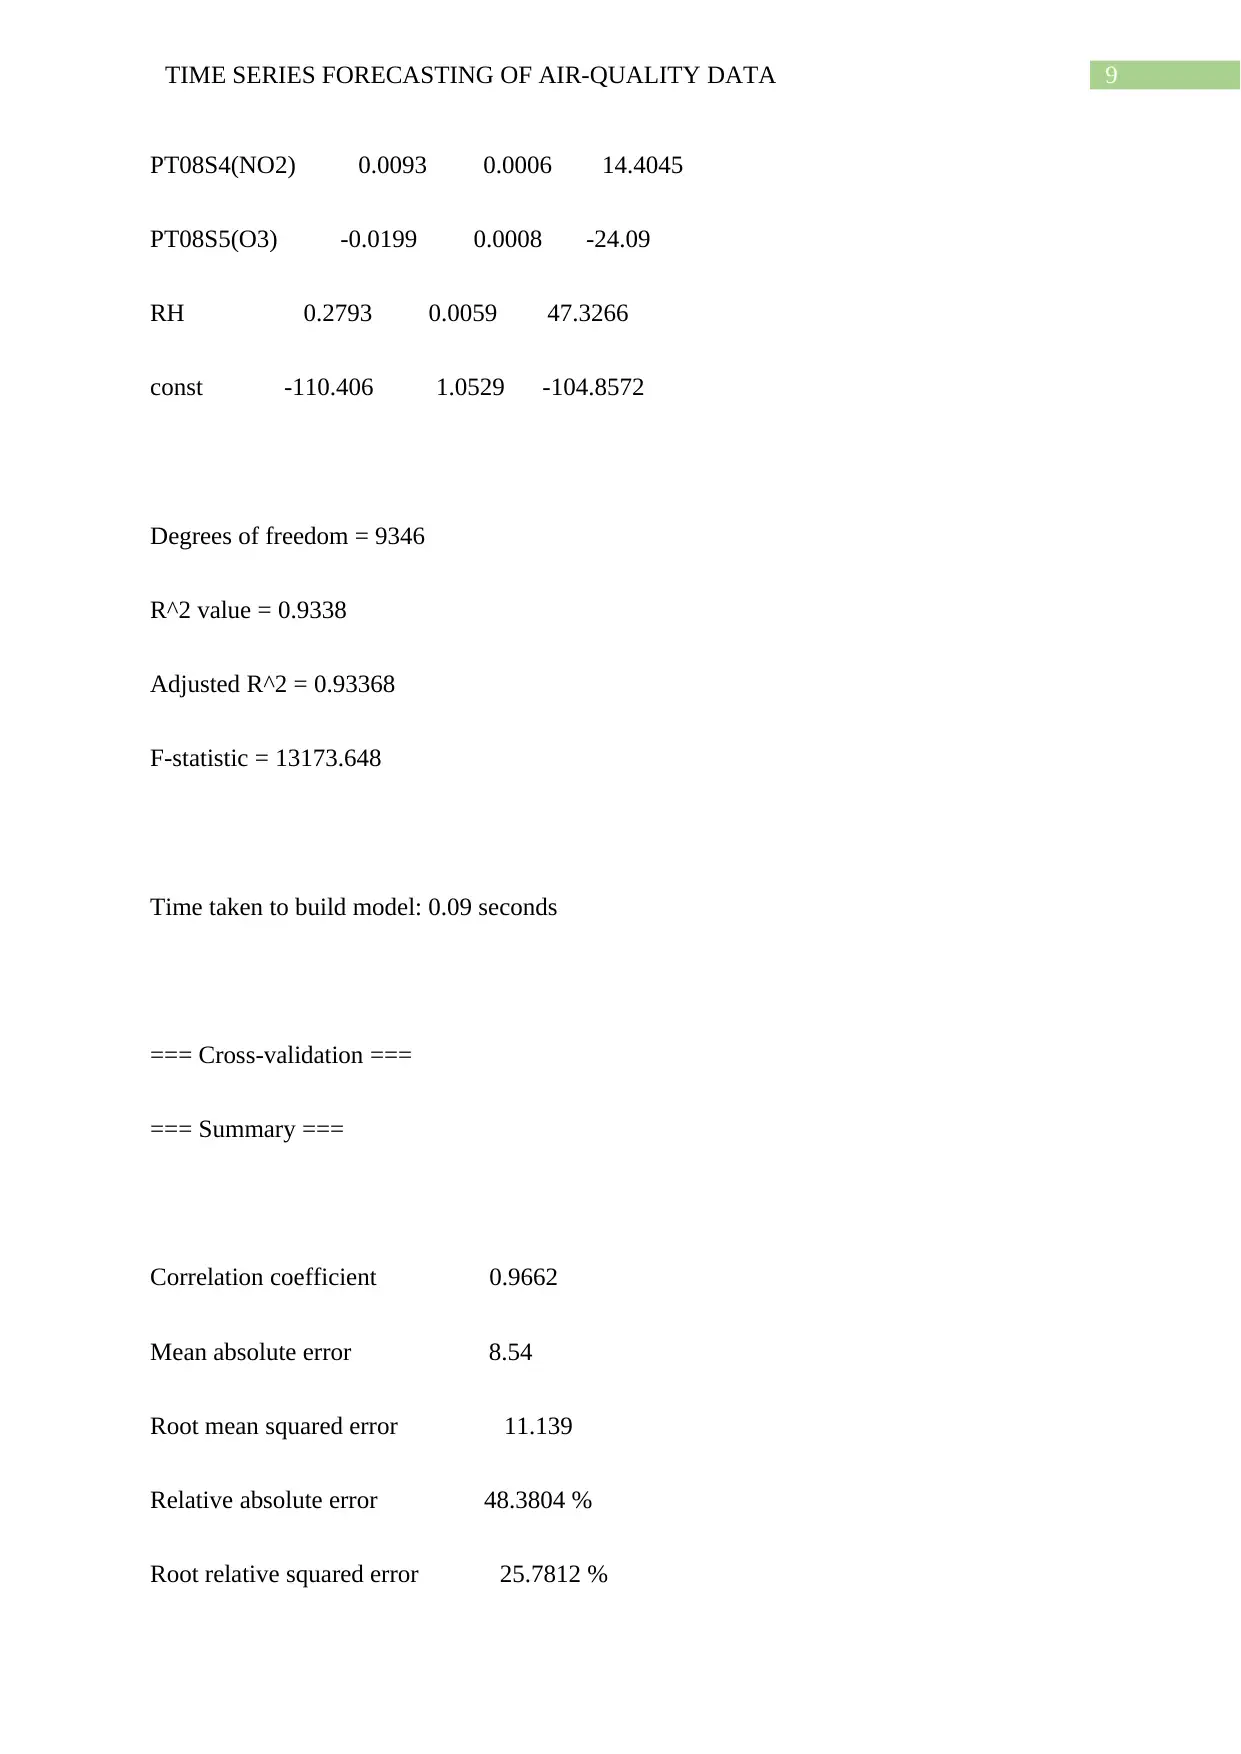
Paraphrase This Document
Need a fresh take? Get an instant paraphrase of this document with our AI Paraphraser
10TIME SERIES FORECASTING OF AIR-QUALITY DATA
Total Number of Instances 9357
Linear regression prediction of Relative humidity:
=== Run information ===
Scheme: weka.classifiers.functions.LinearRegression -S 0 -R 1.0E-8 -additional-stats -
num-decimal-places 4
Relation: AirQualityUCI-weka.filters.unsupervised.attribute.Remove-
weka.filters.unsupervised.attribute.Remove-R1-weka.filters.unsupervised.attribute.Remove-
R13
Instances: 9357
Attributes: 12
CO(GT)
PT08S1(CO)
NMHC(GT)
C6H6(GT)
PT08S2(NMHC)
NOx(GT)
PT08S3(NOx)
NO2(GT)
PT08S4(NO2)
PT08S5(O3)
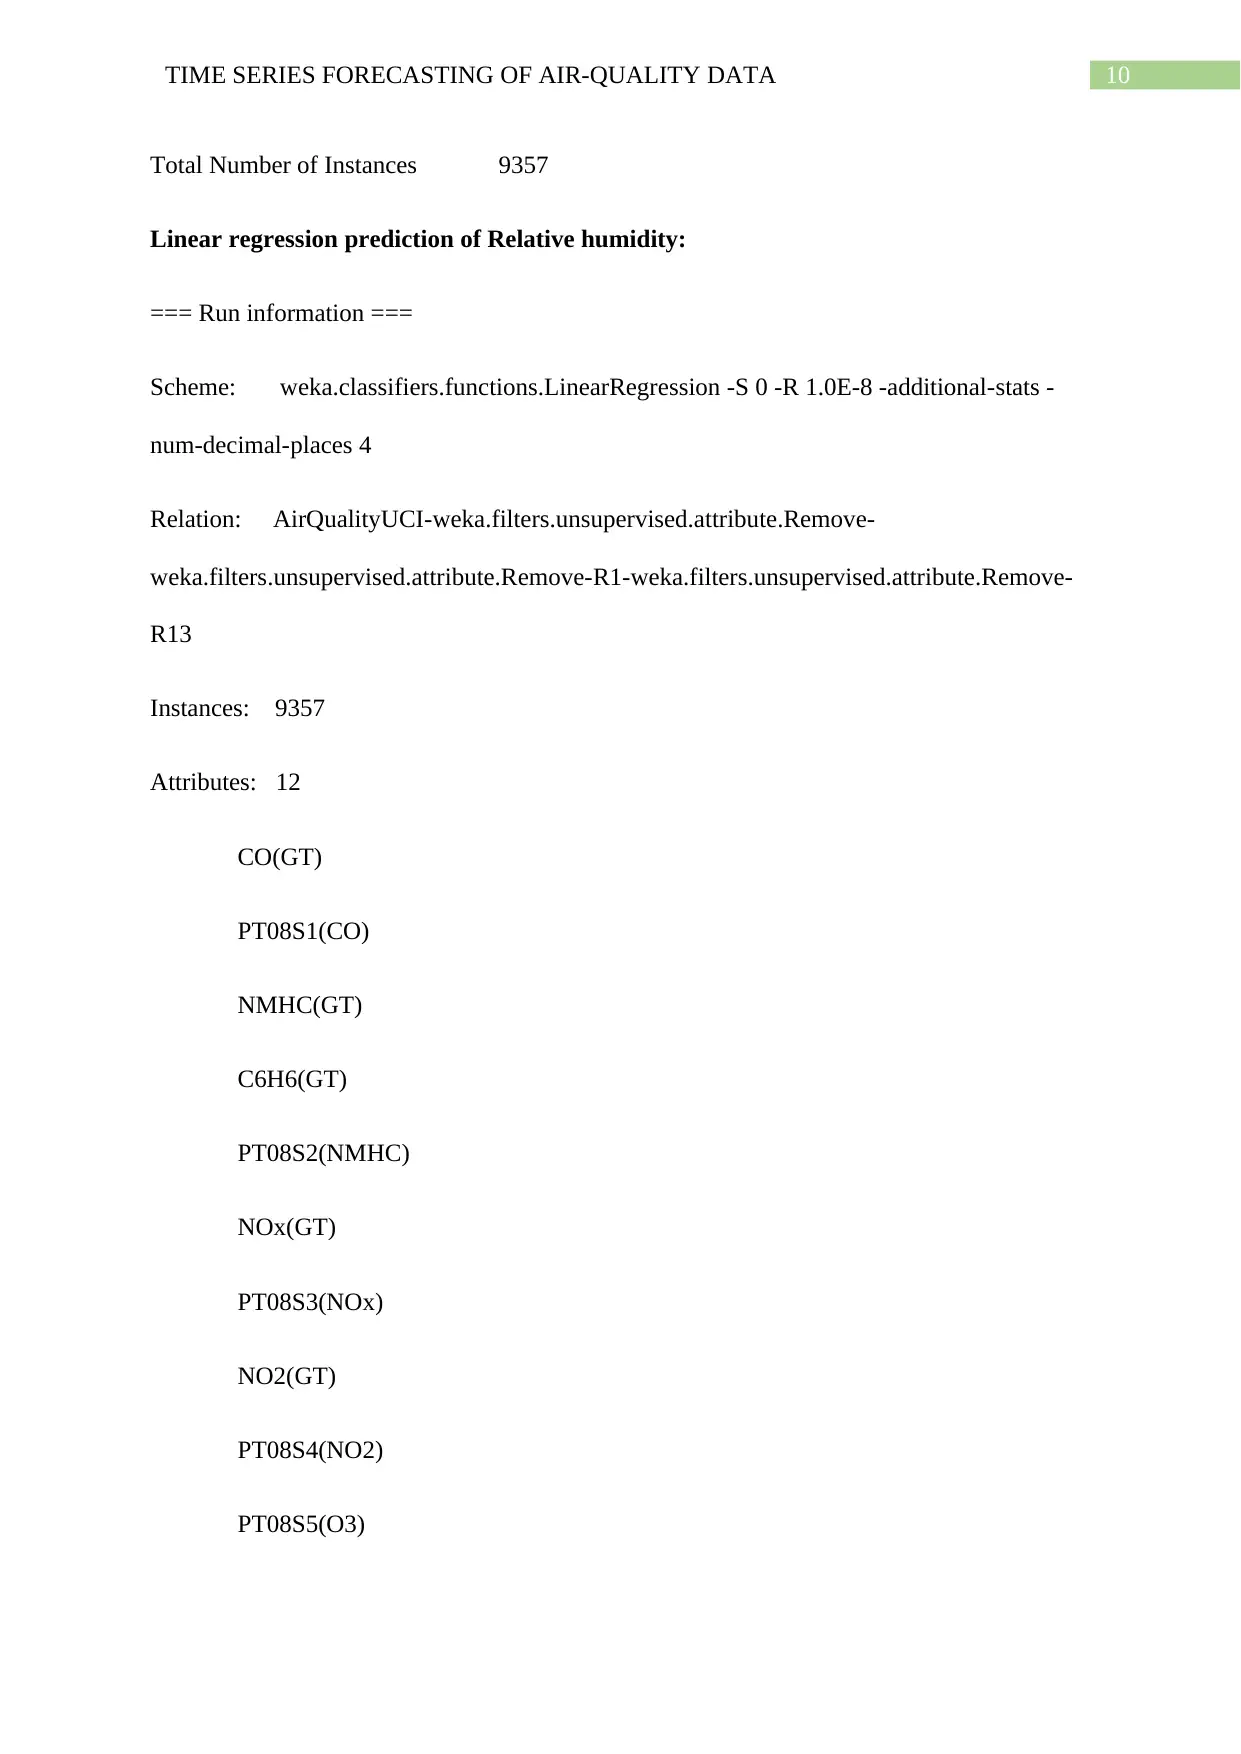
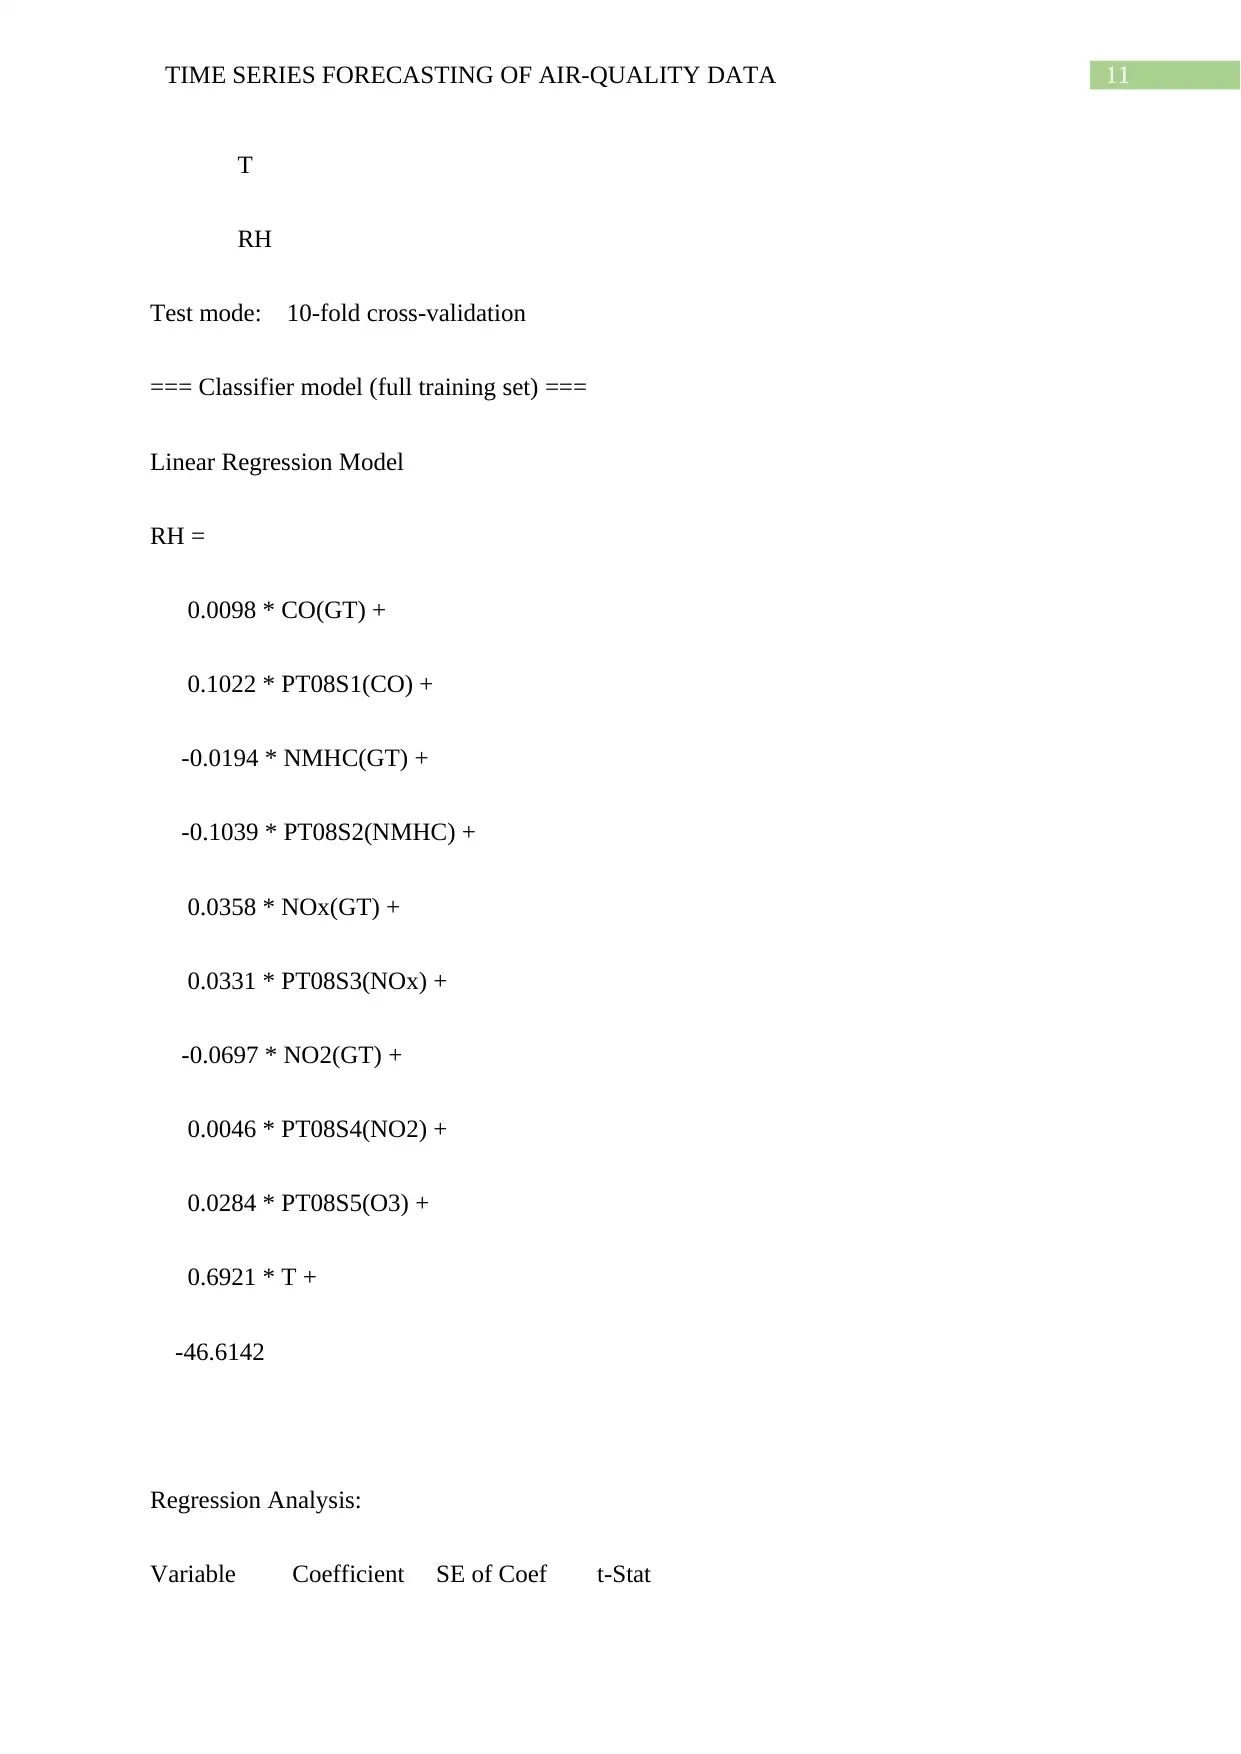
11TIME SERIES FORECASTING OF AIR-QUALITY DATA
T
RH
Test mode: 10-fold cross-validation
=== Classifier model (full training set) ===
Linear Regression Model
RH =
0.0098 * CO(GT) +
0.1022 * PT08S1(CO) +
-0.0194 * NMHC(GT) +
-0.1039 * PT08S2(NMHC) +
0.0358 * NOx(GT) +
0.0331 * PT08S3(NOx) +
-0.0697 * NO2(GT) +
0.0046 * PT08S4(NO2) +
0.0284 * PT08S5(O3) +
0.6921 * T +
-46.6142
Regression Analysis:
Variable Coefficient SE of Coef t-Stat
⊘ This is a preview!⊘
Do you want full access?
Subscribe today to unlock all pages.
Trusted by 1+ million students worldwide
1 out of 45
Related Documents


Your All-in-One AI-Powered Toolkit for Academic Success.
+13062052269
info@desklib.com
Available 24*7 on WhatsApp / Email
![[object Object]](/_next/static/media/star-bottom.7253800d.svg)
Unlock your academic potential
Copyright © 2020–2026 A2Z Services. All Rights Reserved. Developed and managed by ZUCOL.