Ask a question from expert
Titanic Survivability Prediction - Doc
11 Pages1948 Words132 Views
Added on 2021-06-18
Titanic Survivability Prediction - Doc
Added on 2021-06-18
BookmarkShareRelated Documents
Titanic Survivability Prediction 1Titanic Survivability PredictionNameCourse NumberDateFaculty Name

Titanic Survivability Prediction 2Titanic Survivability PredictionIntroductionThe Titanic tragedy was one of the most devastating and deadliest events ever happened in themodern history. People have developed models to predict the probability that an individual in thepassenger liner would have survived, considering different factors such as class, gender and ageamong others. A lot of machine learning activities and predictive methods have been tried todevelop a model with the highest predictive power of survivability in the incident. Therefore, thispaper is focused on developing a predictive model to predict the probability that an individualwould have survived the accident given different factors, which affected the victims differently.The passenger liner was divided into 3 classes –first class being in the topmost, second class inthe middle and third class being at the bottom. This already shows that people in the third classwere more likely to die compared to the other classes. However, it is important to prove thishypothesis, hence supporting our ideas and theories. It has been documented that most people die because there were no enough lifesaving jackets,which rendered most of the people who could have survived death. Due to theories of nature,scarcity of the lifesaver jackets exposed men more compared to the other groups – women andchildren. In addition, this effect would have been affected by levels of class. It would behypothesized that men in the first class were more romantic compared to those in second andthird classes. Therefore, the trends of survivability would vary between class for men andwomen. In an ideal situation, men and women in the third class would have struggled in thesame manner to save their lives. Due to the life dynamics, it is possible to predict theirsurvivability. As much as the survivability levels would have been due to chance, these dynamicscan explain to some level of confidence. Exploratory data analysis will be conducted to identify

Titanic Survivability Prediction 3the possible significant predictors of survivability. Further, these variables will be used togenerate the model and predict the probability of surviving in the test dataset(Friendly, 2012). MethodsData PreparationThe titanic data has several missing values but for the predictive model, we decide toleave them because most of them are affecting variables which might not be used in the modelsuch as the cabin number. Due to the high number of missing values of the cabin variable, it willnot be used in the model, hence no need to remove the missing values. Several variables will betransformed to allow better analysis. For instance, the Pclass variable which denotes the class ofthe individuals will be transformed into a factor, to allow categorical analysis. Similarly, thesurvived variable is transformed into a categorical variable. This transformation will be done forthe entire dataset because the test and train sets should be identical except for the dependentvariable. Duplicates will be checked using the name variable and if any repeated entries based onthe name are identified, they will be removed. Below is the data dictionary for the variables to beused in the model. Table 1: Data dictionaryVariableDefinitionKeysurvivalSurvival0 = No, 1 = YespclassTicket class1 = 1st (Upper)2 = 2nd (Middle)3 = 3rd (Lower)sexSexAgeAge in years
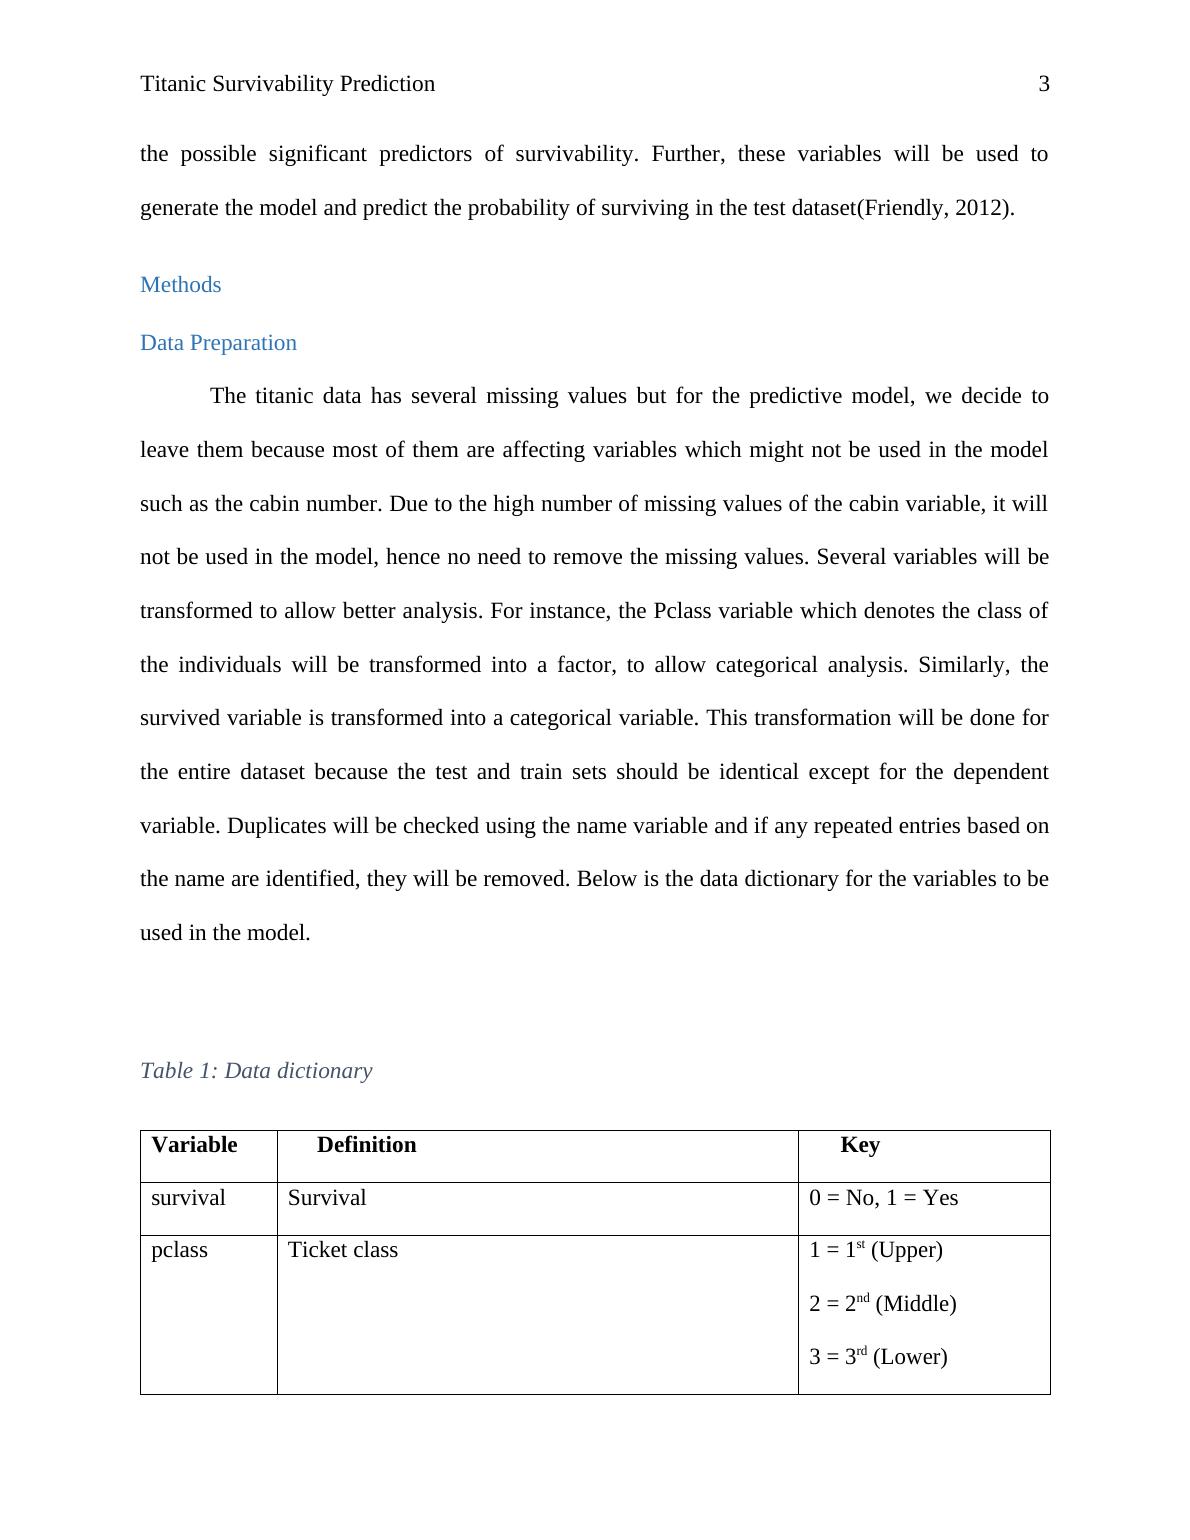
Titanic Survivability Prediction 4sibspNumber of siblings/spouses aboard the TitanicparchNumber of parents/children aboard the TitanicfarePassenger fareembarkedPort of EmbarkationC = Cherbourg, Q =Queenstown, S =SouthamptonData SamplingThe data has already been sampled into the train and test dataset to allow fitting andtesting the model. Therefore, the two sets will be combined to allow data transformations asdescribed in data preparation section above. Therefore, using row binding capability in R, wewill set the train set to be above the test set. Further, the first 891 rows will be used in the modelfor training and the last 418 rows will be used for testing(Aczel & Sounderpandian, 2008). Building the model342 (38.38%) people survived and 549 (61.62%) died according to the training dataset.24.67% were in the first class, 20.65% in the second class and 55.11% in the third class.

End of preview
Want to access all the pages? Upload your documents or become a member.
Related Documents
Titanic Survival Analyticslg...
|10
|2102
|471
Analysis of Titanic Datasetslg...
|15
|3119
|313