HSH746/HSH946 Biostatistics Assignment 2: Statistical Analysis Report
VerifiedAdded on 2022/12/26
|7
|1165
|46
Homework Assignment
AI Summary
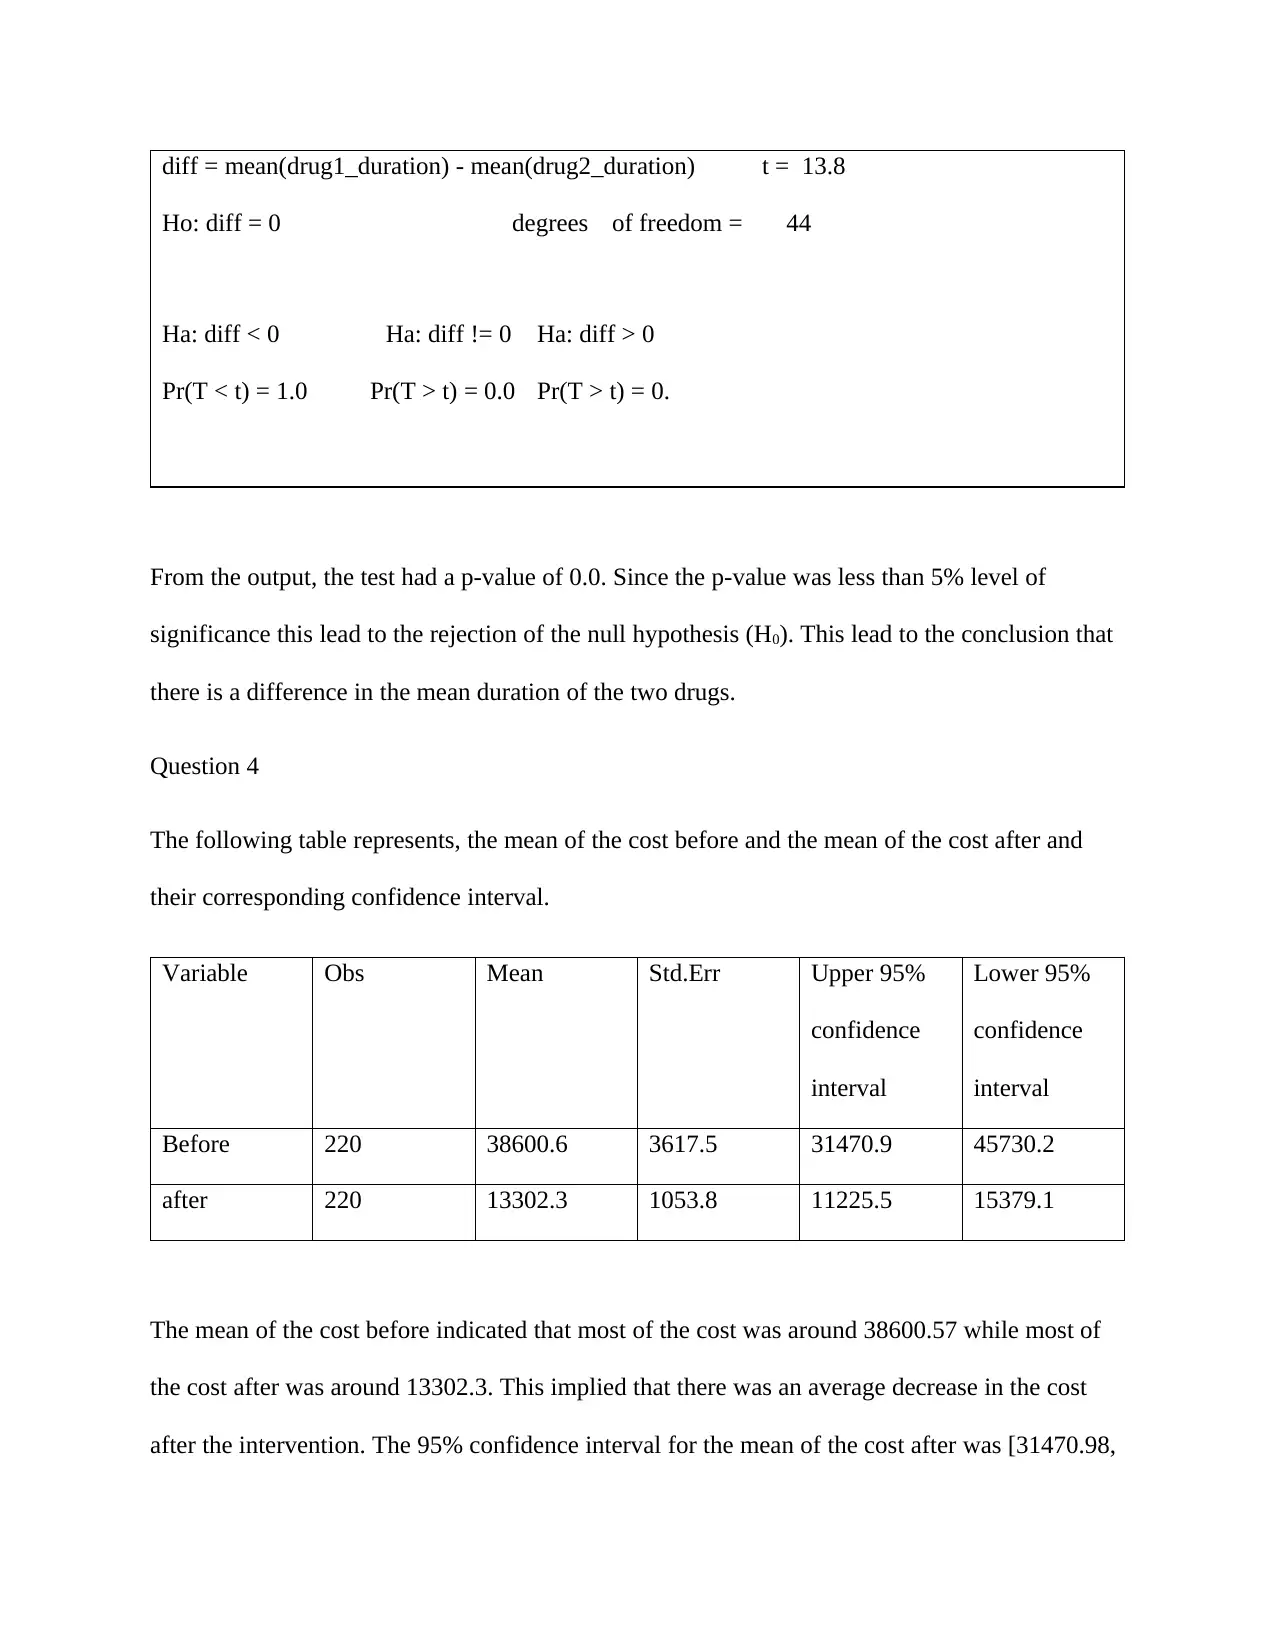
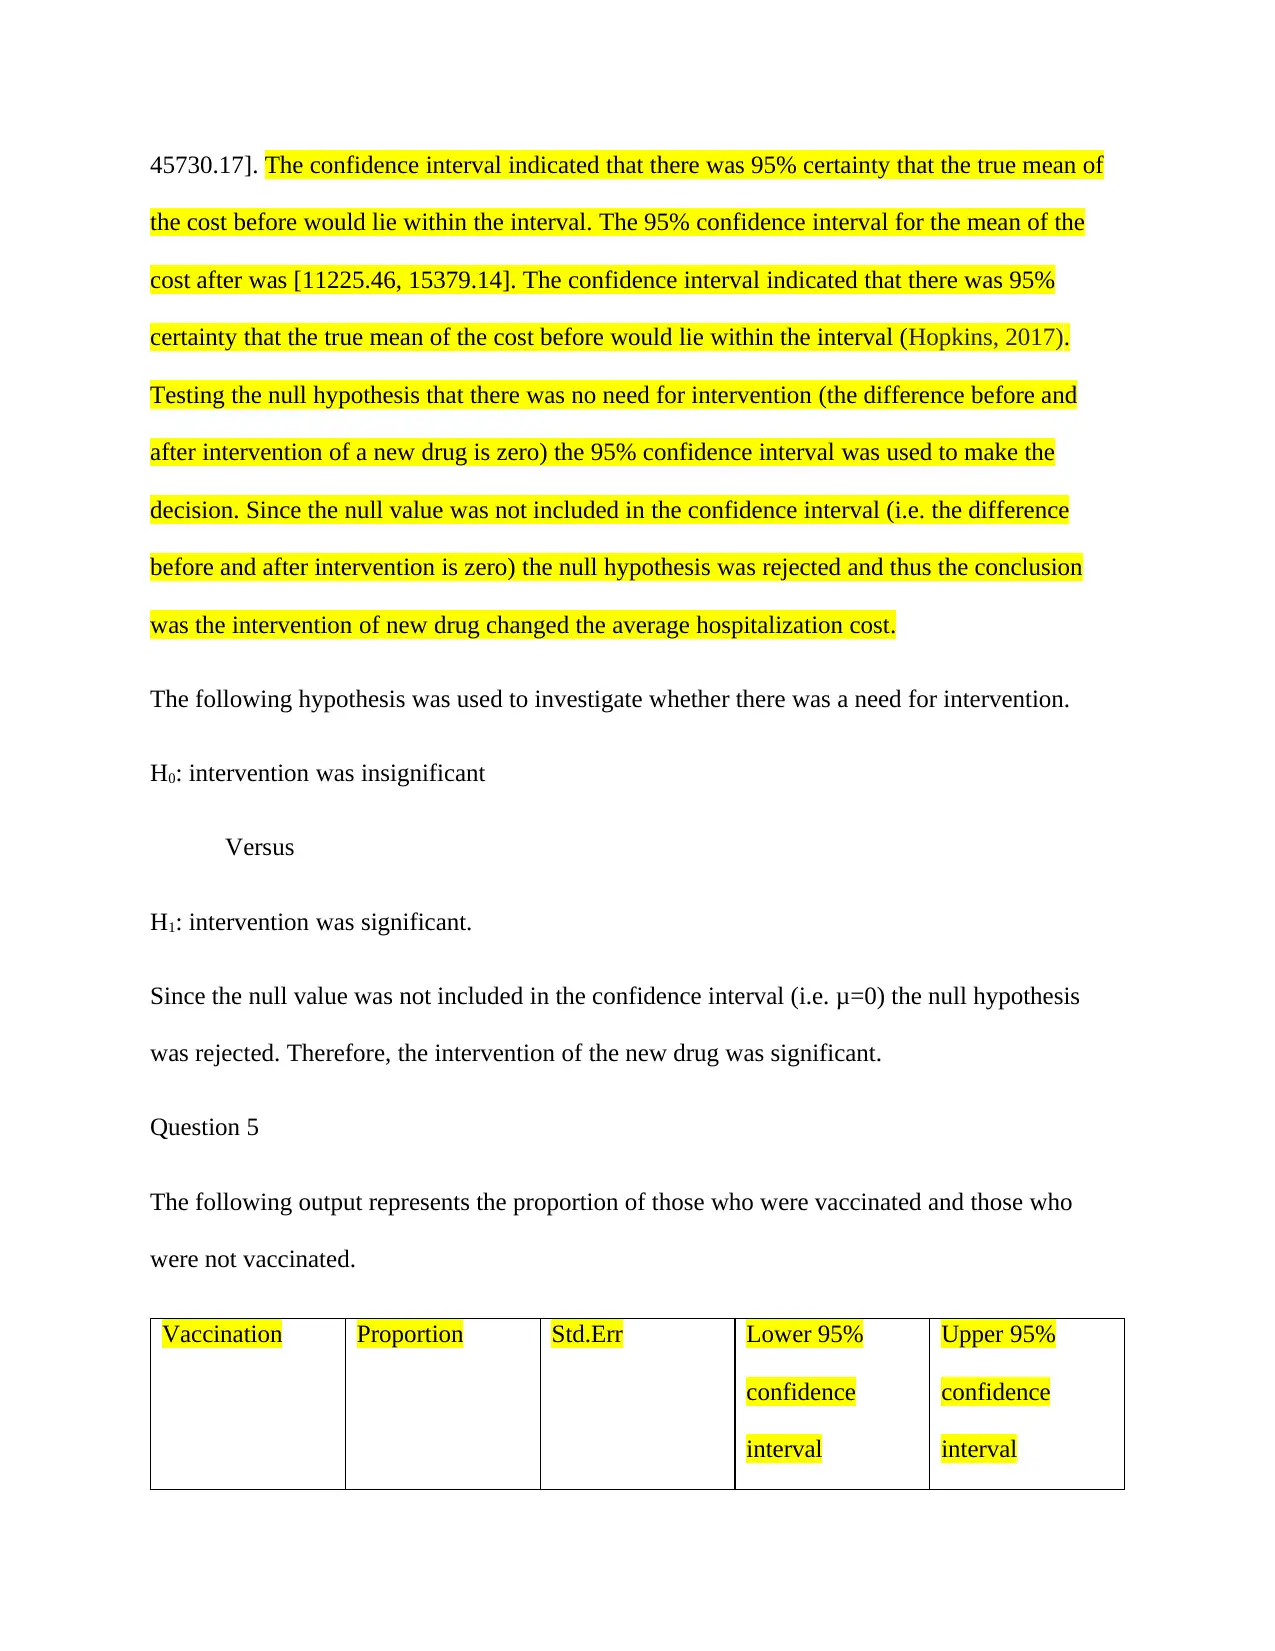
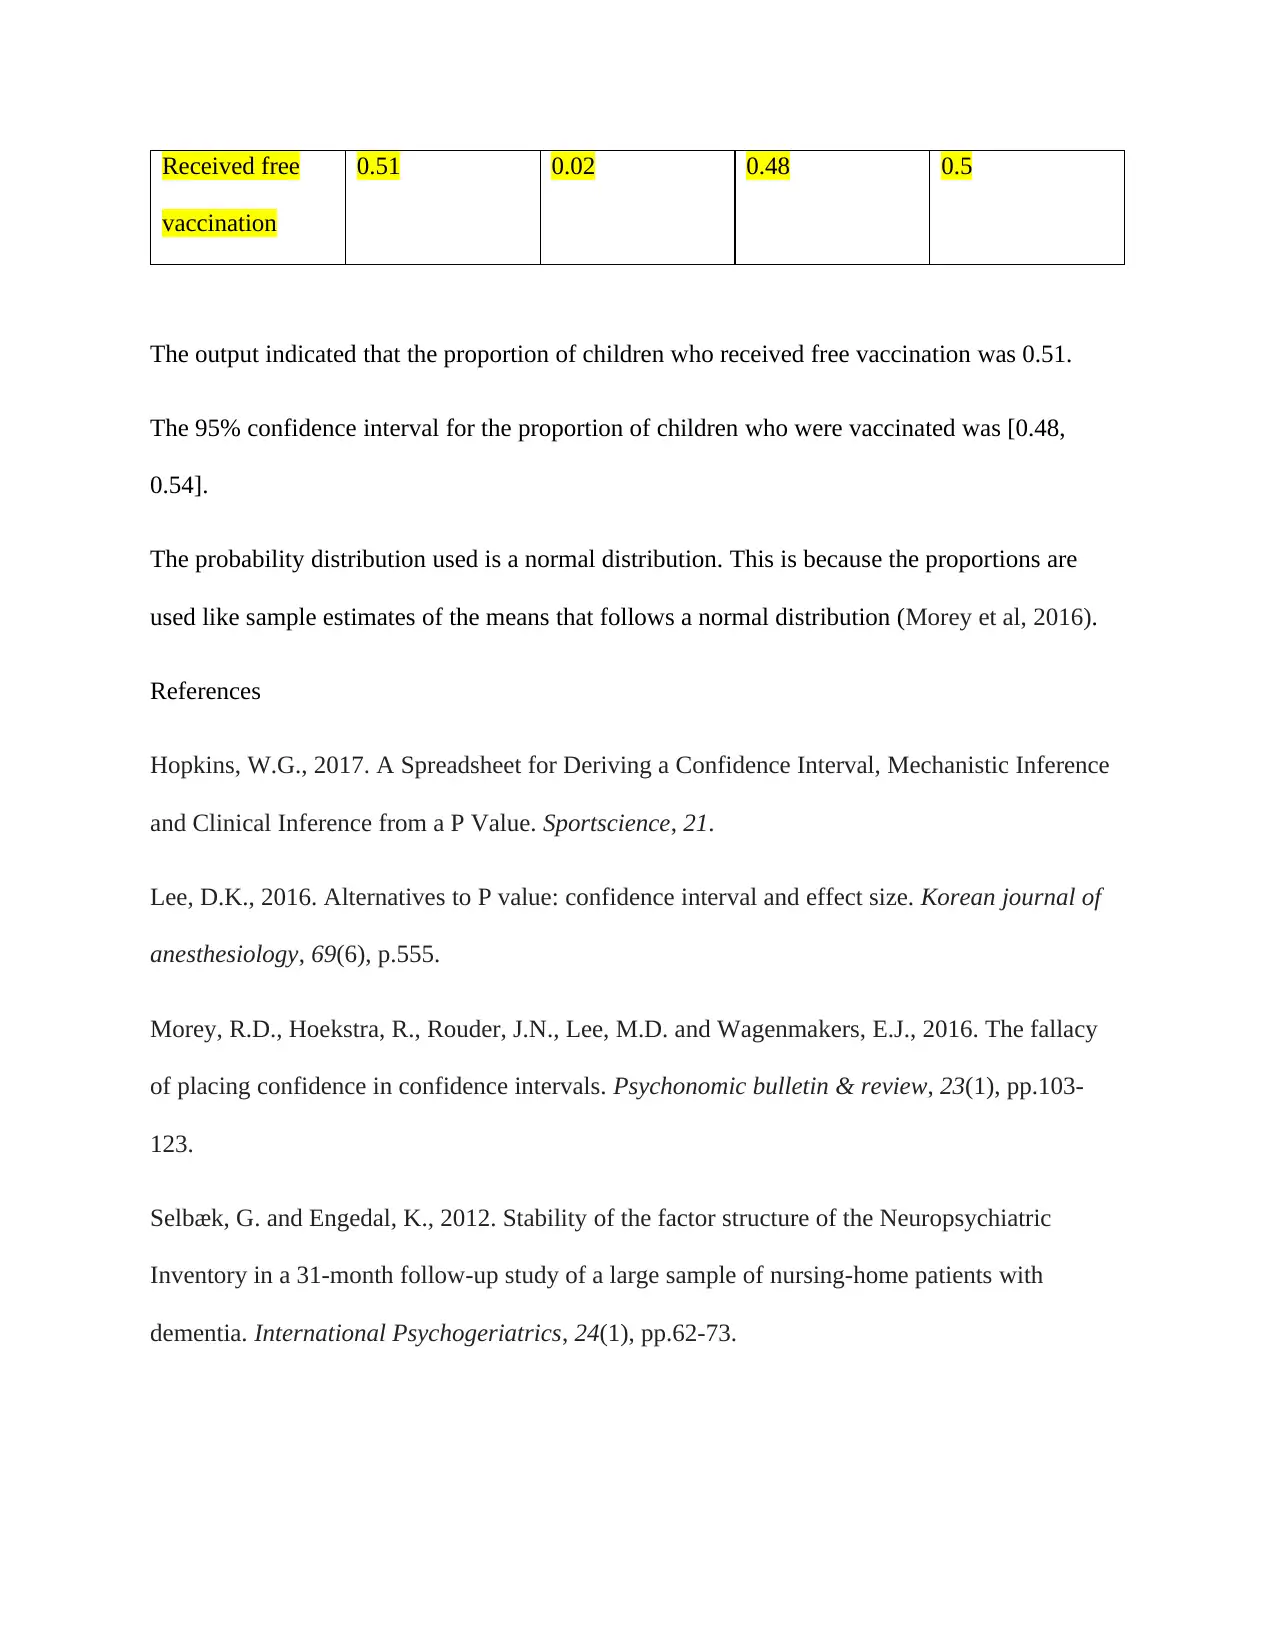
This biostatistics assignment analyzes the duration of malaria symptoms for patients under different drugs, determining if their distributions are normal and calculating confidence intervals for the mean duration. It employs independent sample t-tests to compare the mean duration of the drugs, formulating and testing hypotheses at a 5% significance level and interpreting the p-values. The assignment also examines the mean cost before and after a new drug intervention, utilizing confidence intervals to assess the intervention's significance and testing related hypotheses. Finally, it analyzes the proportion of vaccinated children, employing a normal distribution for proportion estimates and confidence intervals. The analysis includes Stata output, demonstrating the calculations and interpretations of the statistical tests and confidence intervals, providing a comprehensive overview of the data analysis process.
1 out of 7
Related Documents


Your All-in-One AI-Powered Toolkit for Academic Success.
+13062052269
info@desklib.com
Available 24*7 on WhatsApp / Email
![[object Object]](/_next/static/media/star-bottom.7253800d.svg)
Copyright © 2020–2025 A2Z Services. All Rights Reserved. Developed and managed by ZUCOL.