Data Analysis and Forecasting of Bank Expenses - Finance Report
VerifiedAdded on 2022/12/27
|11
|1679
|89
Report
AI Summary
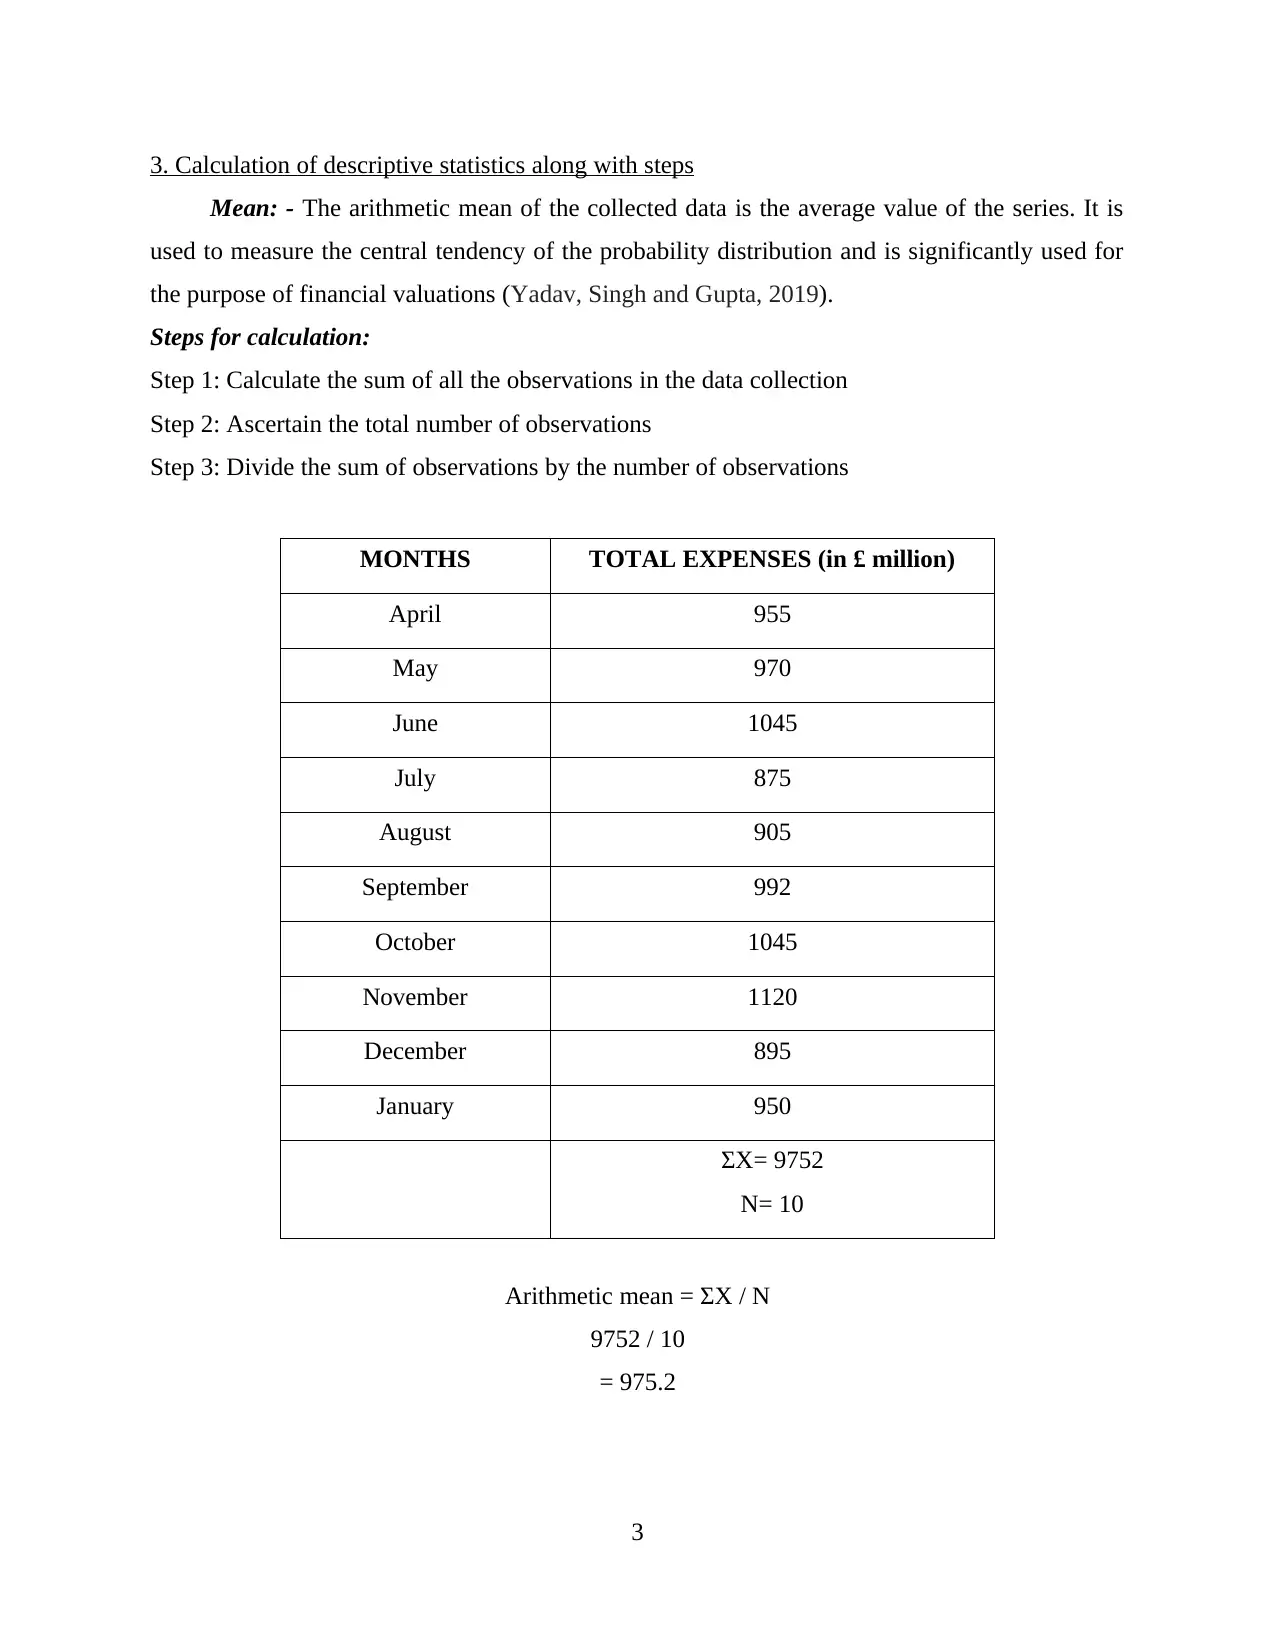
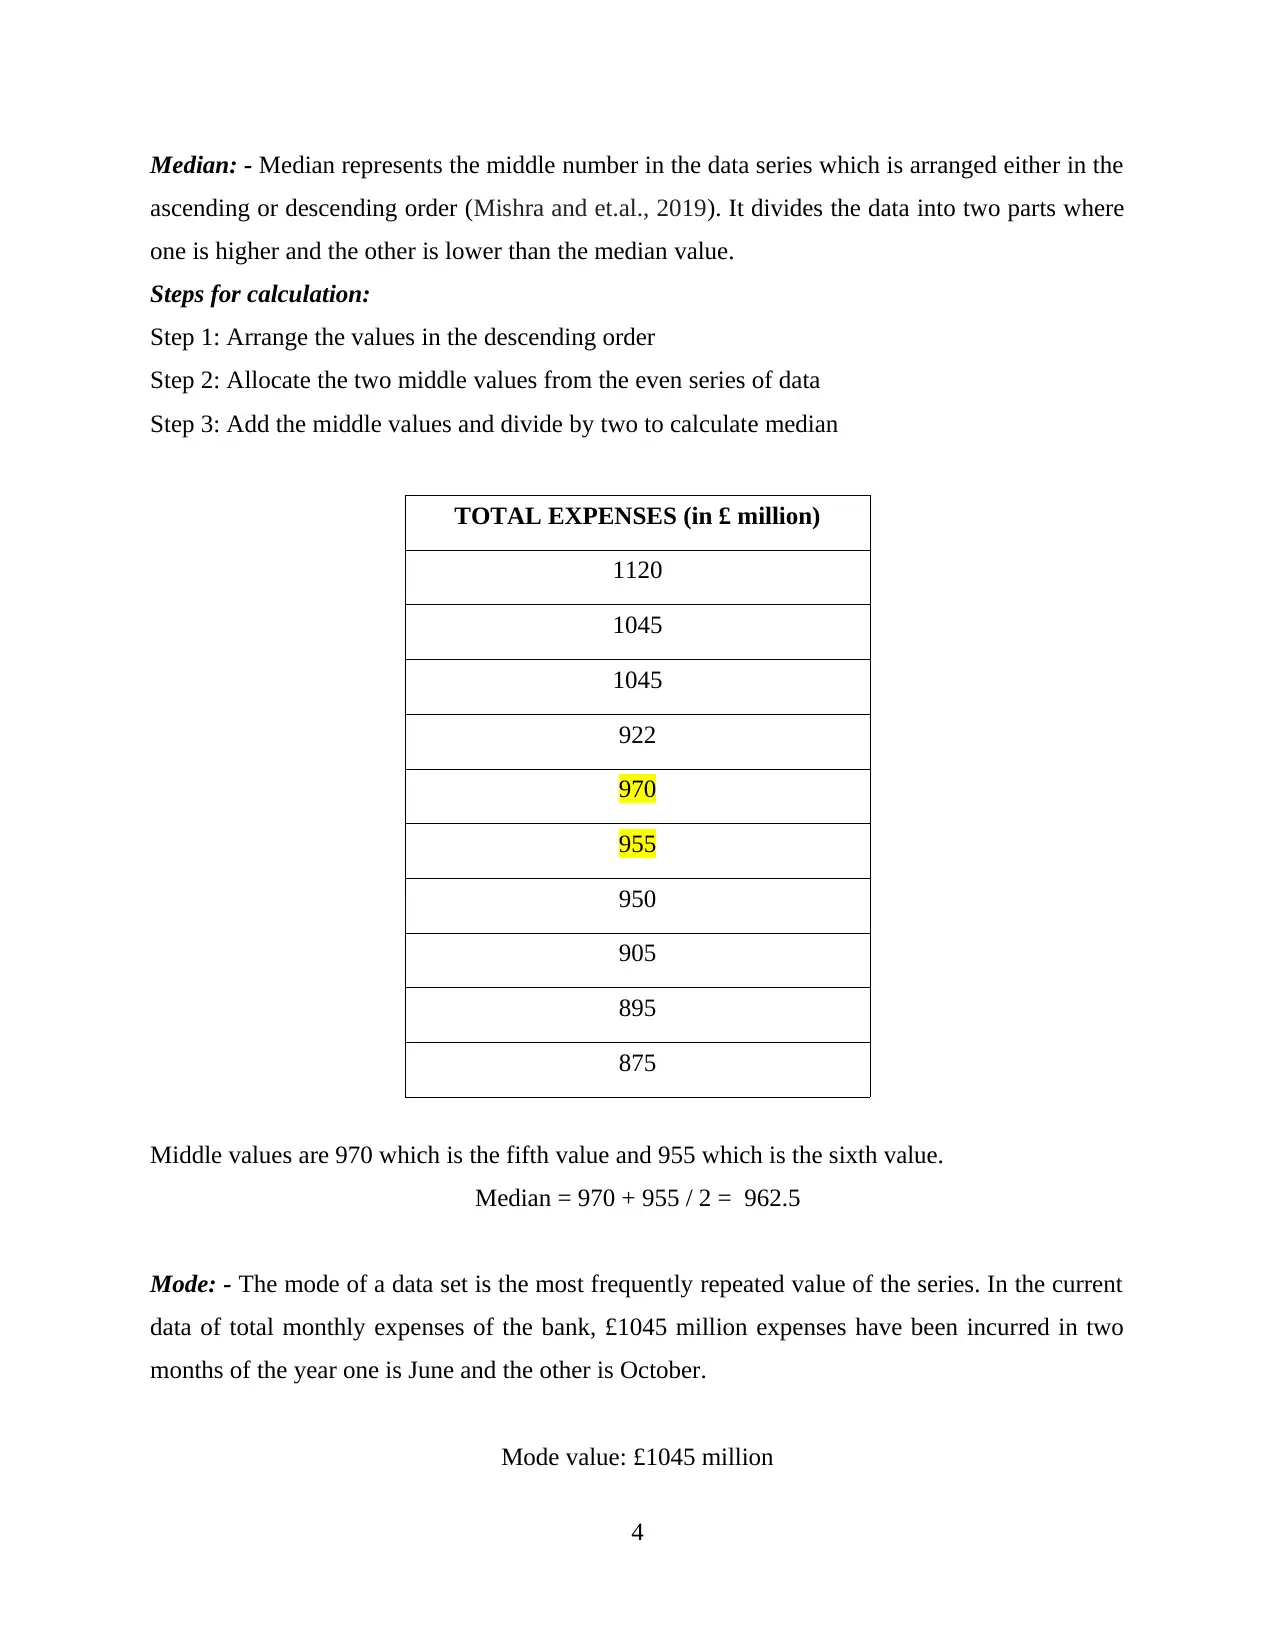
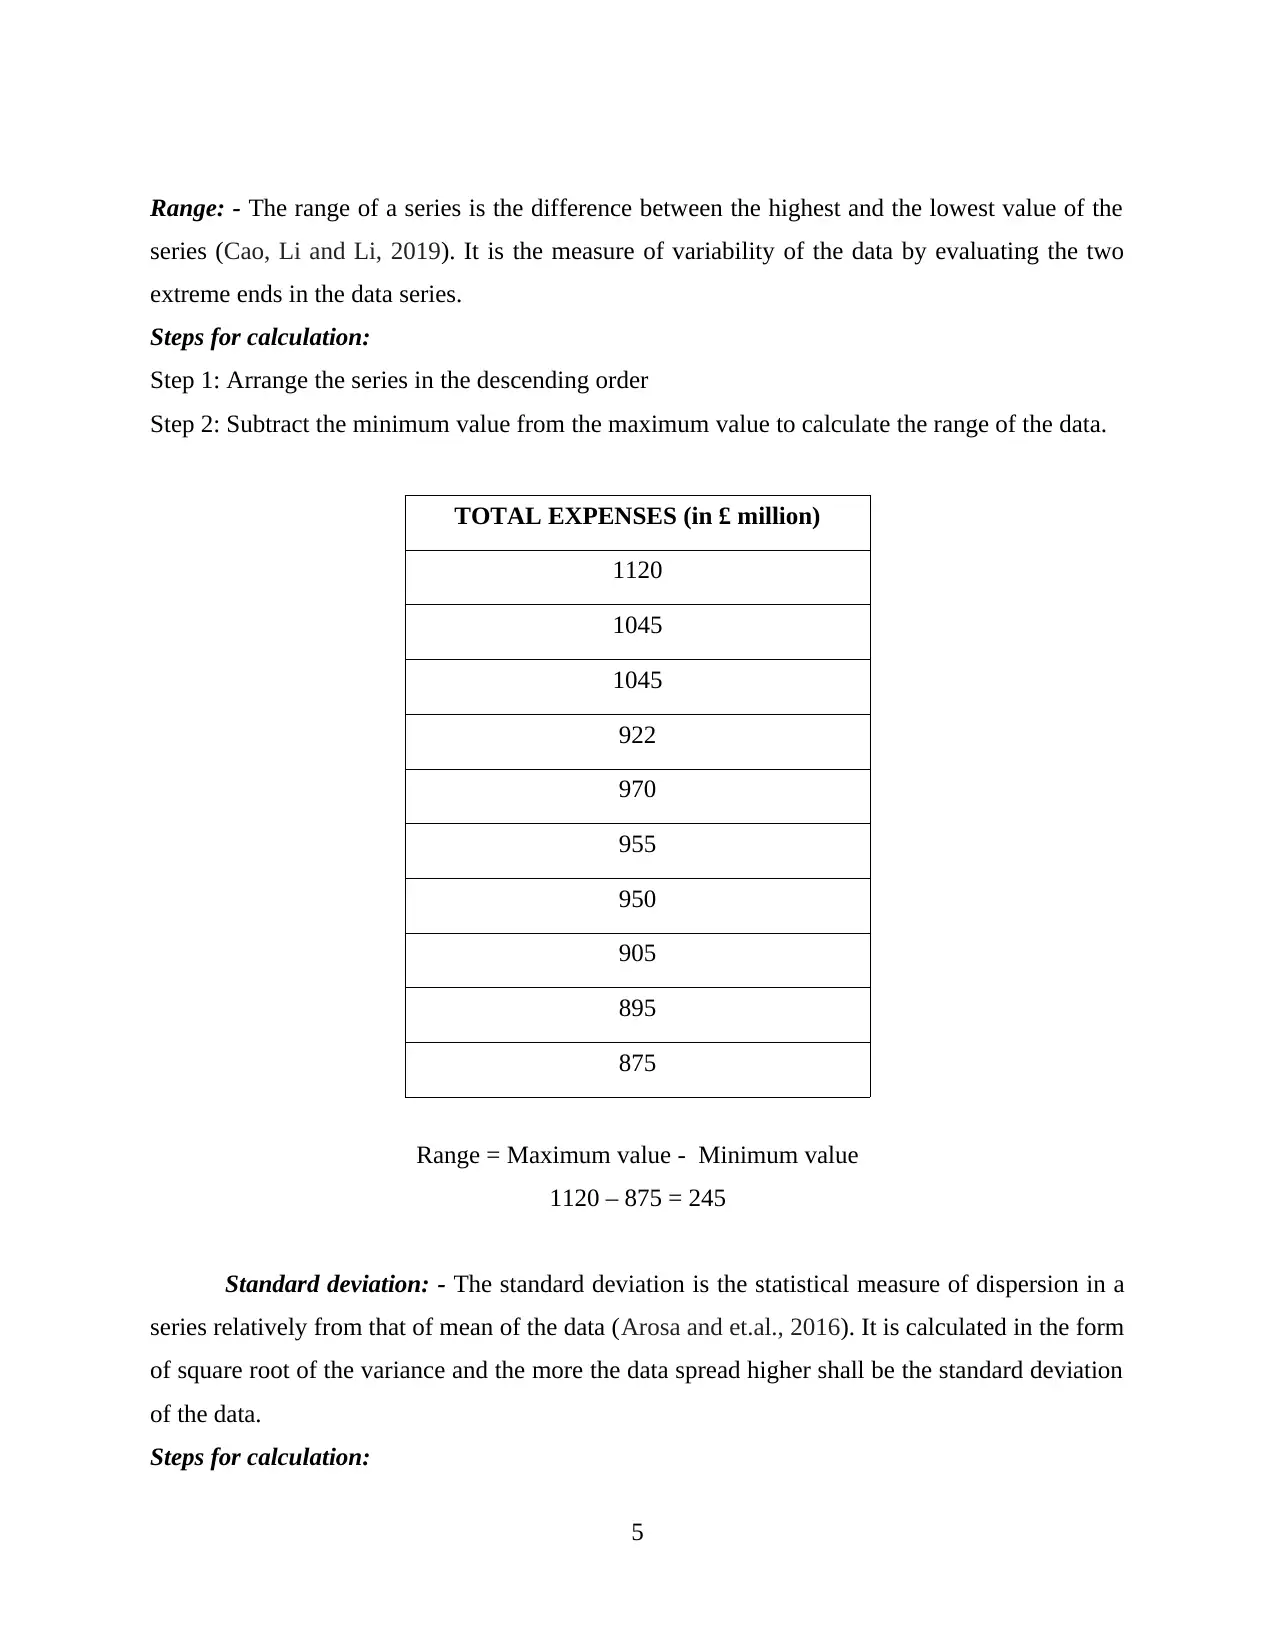
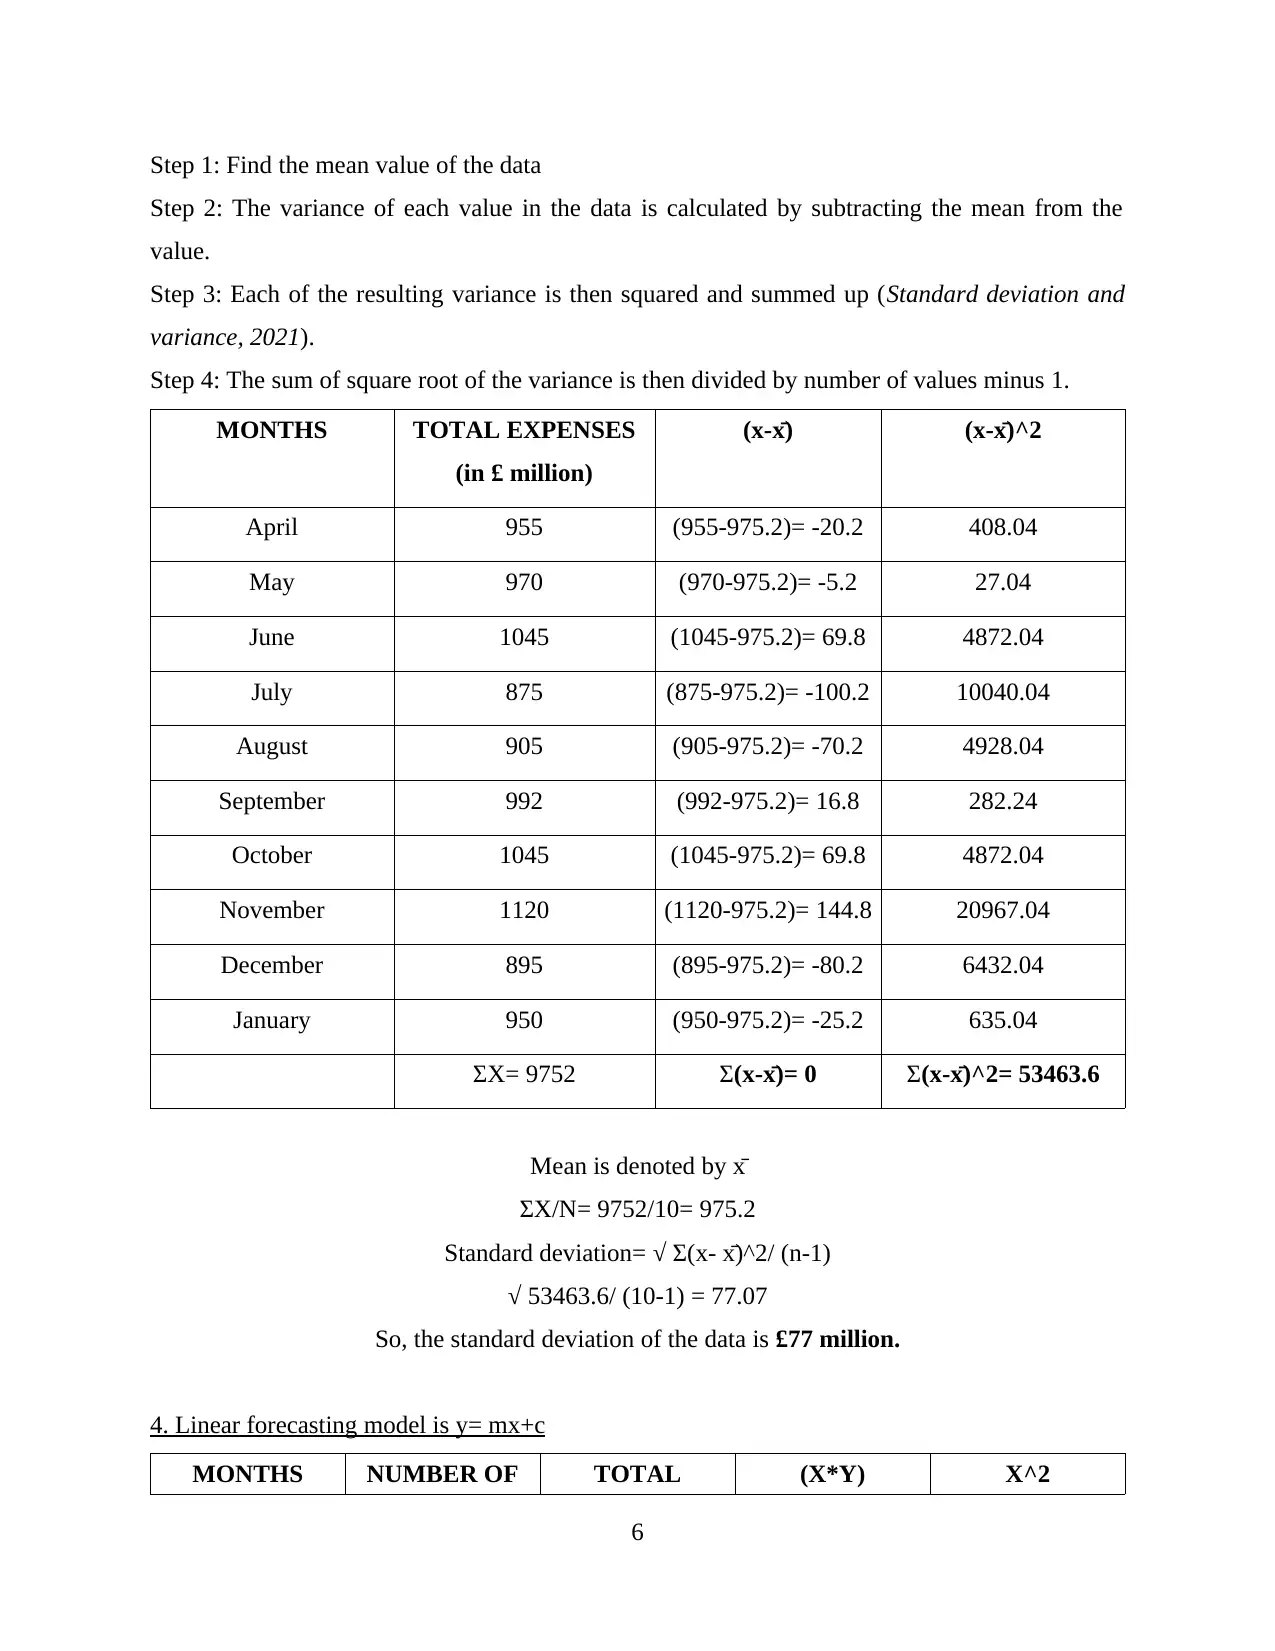
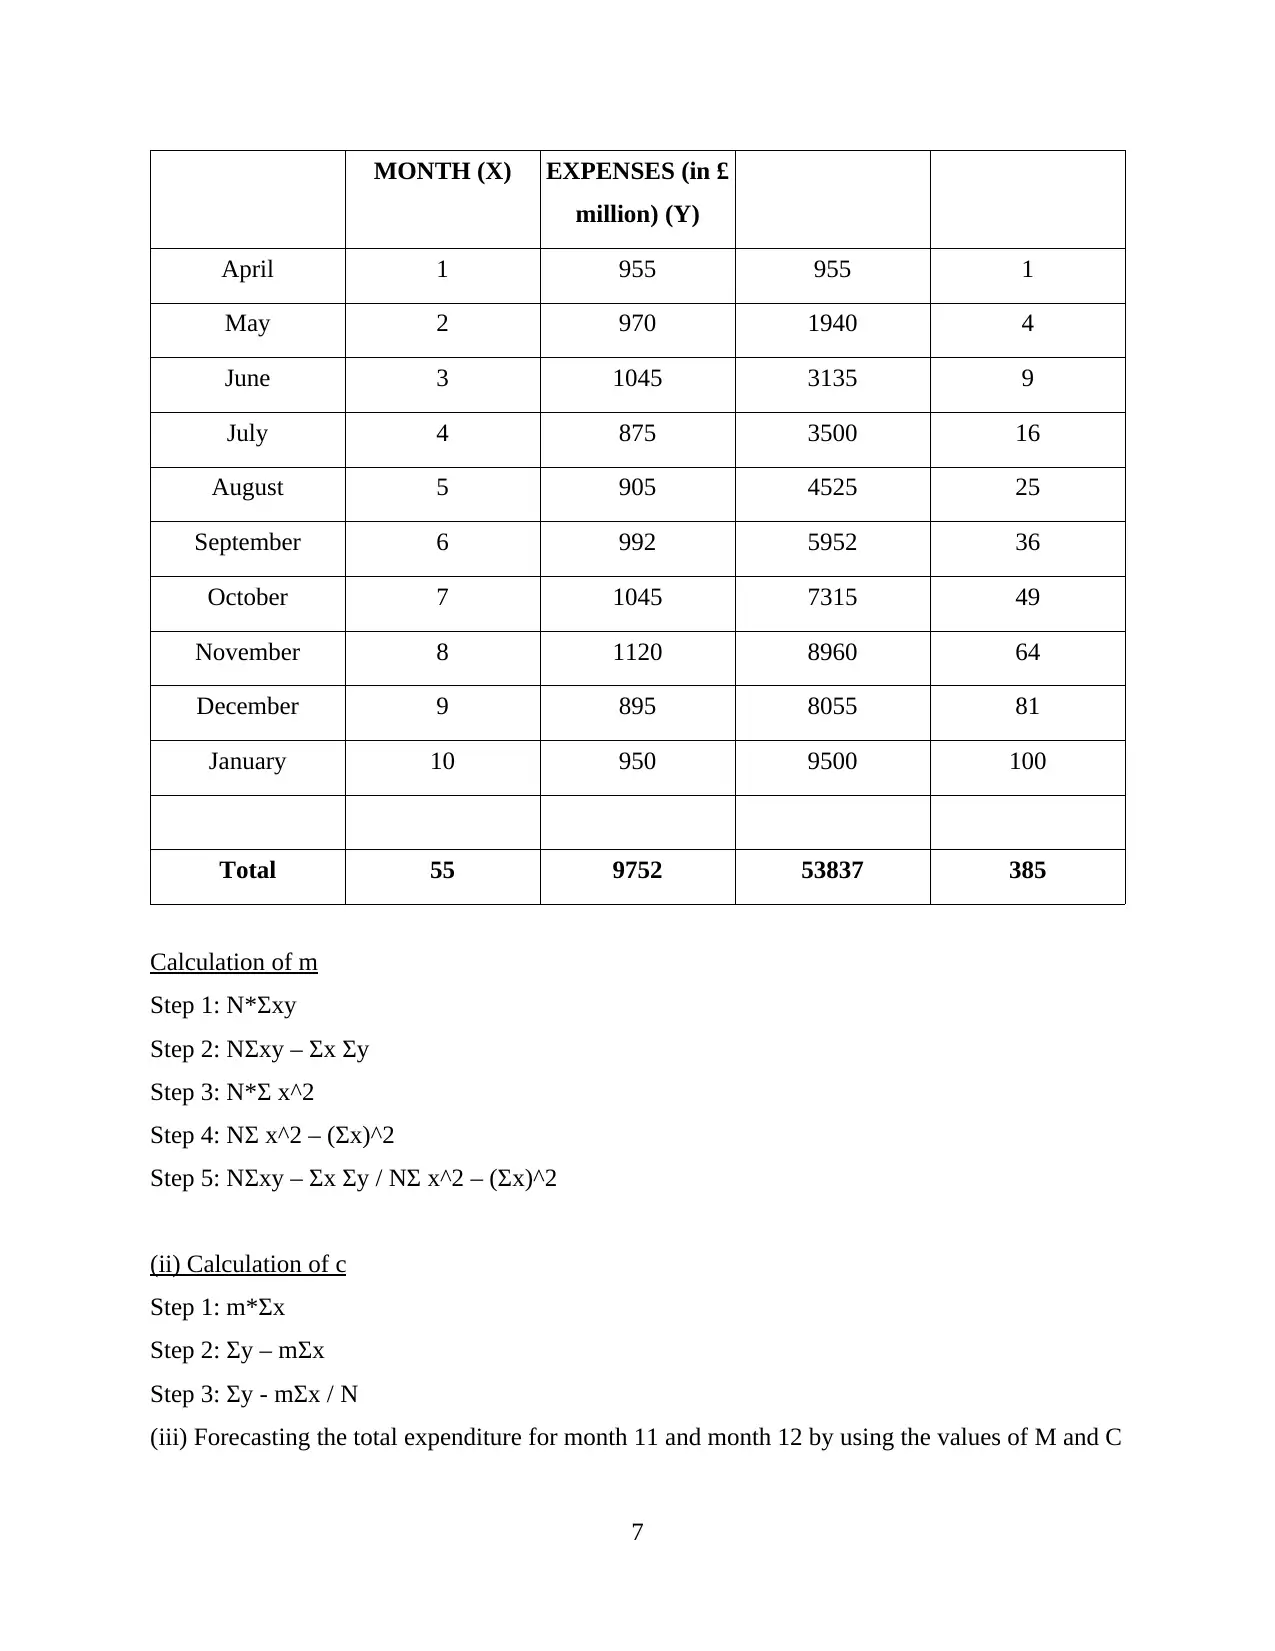
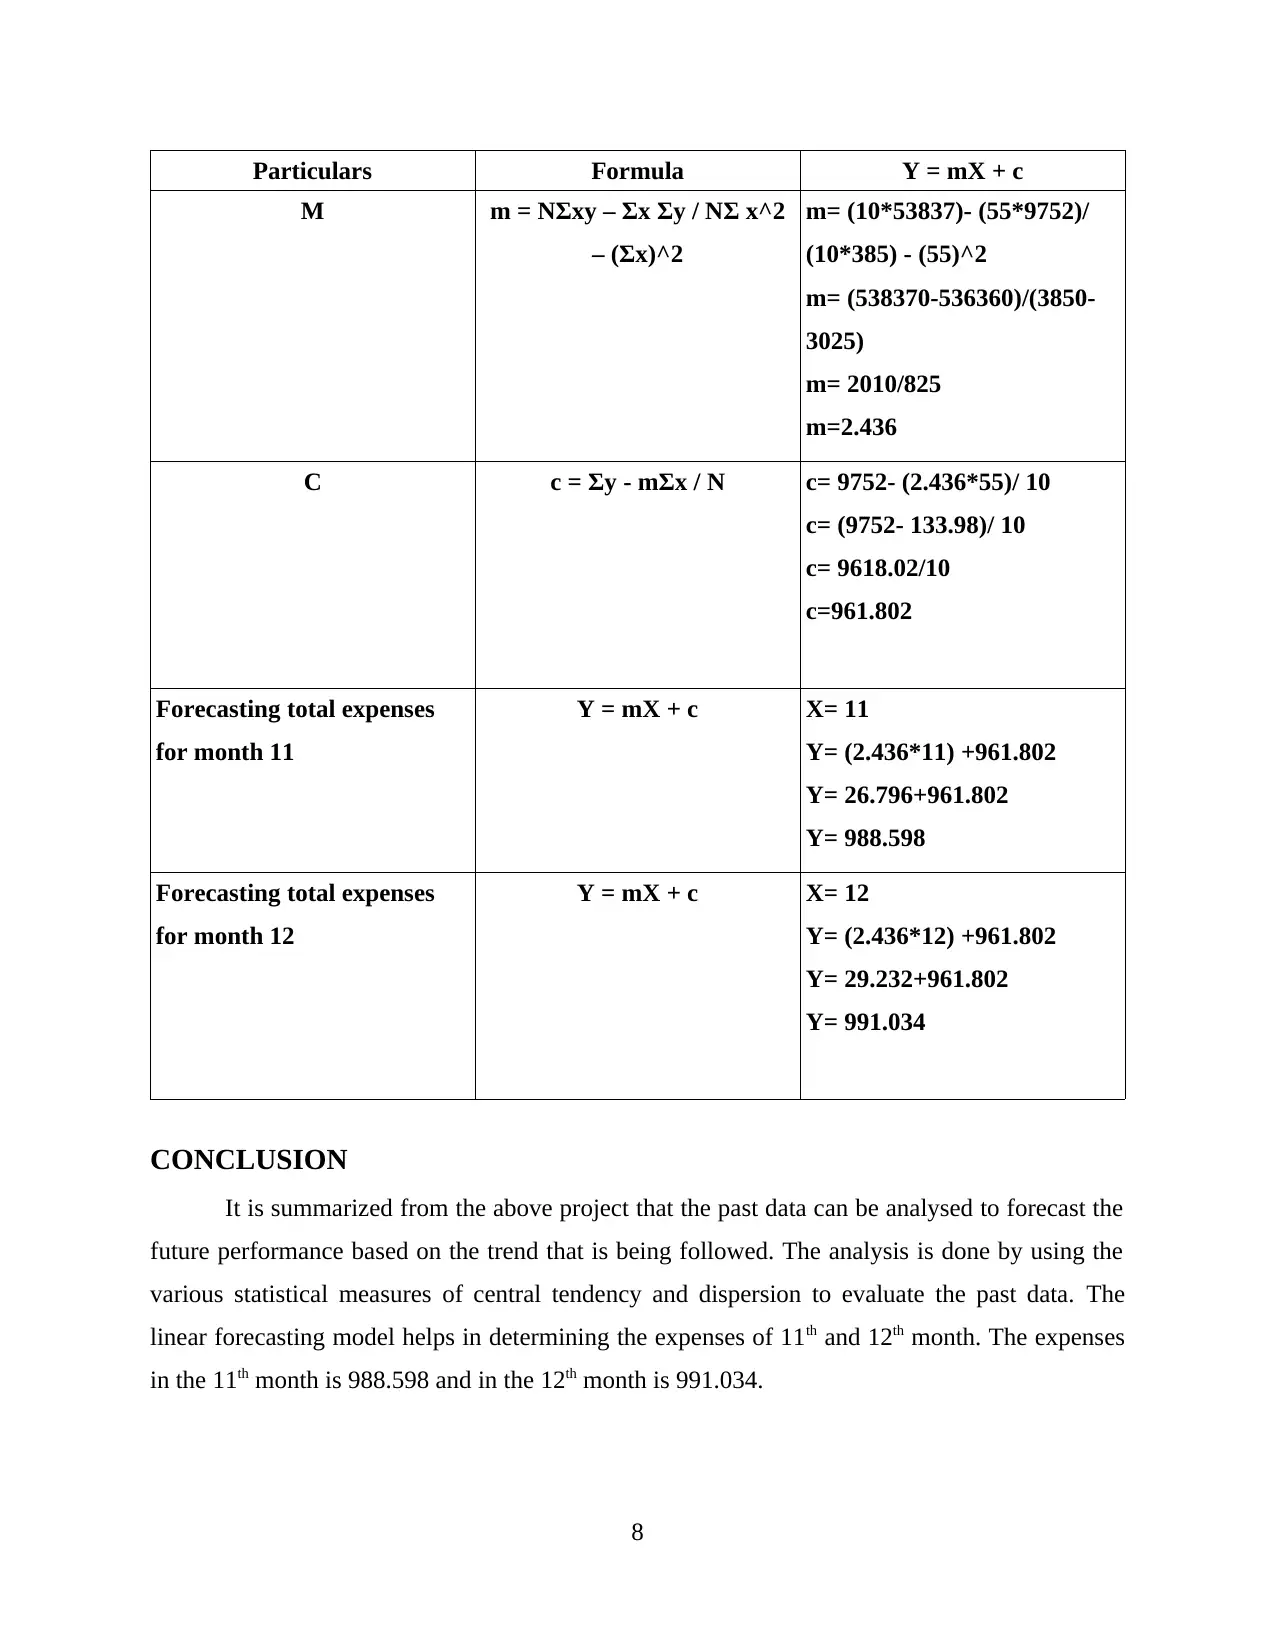
This report presents a comprehensive analysis of bank expenses over a ten-month period, employing various statistical techniques to forecast future financial performance. The analysis begins with presenting the data in a tabular format, followed by visual representations using column and line charts to illustrate trends. Descriptive statistics, including mean, median, mode, range, and standard deviation, are calculated and explained to provide a deeper understanding of the data's central tendency and dispersion. Furthermore, a linear forecasting model (y = mx + c) is applied to predict expenses for the subsequent two months, with detailed calculations of the slope (m) and y-intercept (c). The report concludes with a summary of the findings, highlighting the application of statistical tools in financial forecasting, with references to relevant books and journals.
1 out of 11
Related Documents


Your All-in-One AI-Powered Toolkit for Academic Success.
+13062052269
info@desklib.com
Available 24*7 on WhatsApp / Email
![[object Object]](/_next/static/media/star-bottom.7253800d.svg)
Copyright © 2020–2026 A2Z Services. All Rights Reserved. Developed and managed by ZUCOL.