Porosity Measurement Experiment 2
VerifiedAdded on 2023/03/17
|6
|1580
|47
AI Summary
This document discusses the porosity measurement experiment using helium gas compression method. It explains the different types of porosity and how to determine porosity using gas pycnometer. The document also provides a step-by-step procedure for conducting the experiment and includes results and discussions. References are provided for further reading.
Contribute Materials
Your contribution can guide someone’s learning journey. Share your
documents today.
Title: Porosity Measurement Experiment 2
Objective
To find porosity and other related parameters such as bulk volume, pore volume,
grain volume, weight of the sample and grain density of a core samples to introduce
helium gas into them.
Introduction
The term porosity refers to the measure empty (Void) spaces in a material. It is the
fraction of the overall volume of the spaces in a material over the total volume.
(Schön 2015). There are various porosity types. These include effective and absolute
porosities. Absolute porosity is the ratio of total pore volume (volume of isolated
pores+ volume of interconnected pores) over bulk volume. Whereas, effective
porosity is the ratio of the interconnected pores to bulk volume (Dullien
2012).Determination of porosity is only two out of the three volumes: bulk volume,
grain volume and pore volume. There are several methods for measuring porosity
such as crushing method, fluid displacement, mercury injection and gas
compression/expansion. Gas compression/expansion using Helium will be used in this
experiment to determine porosity.
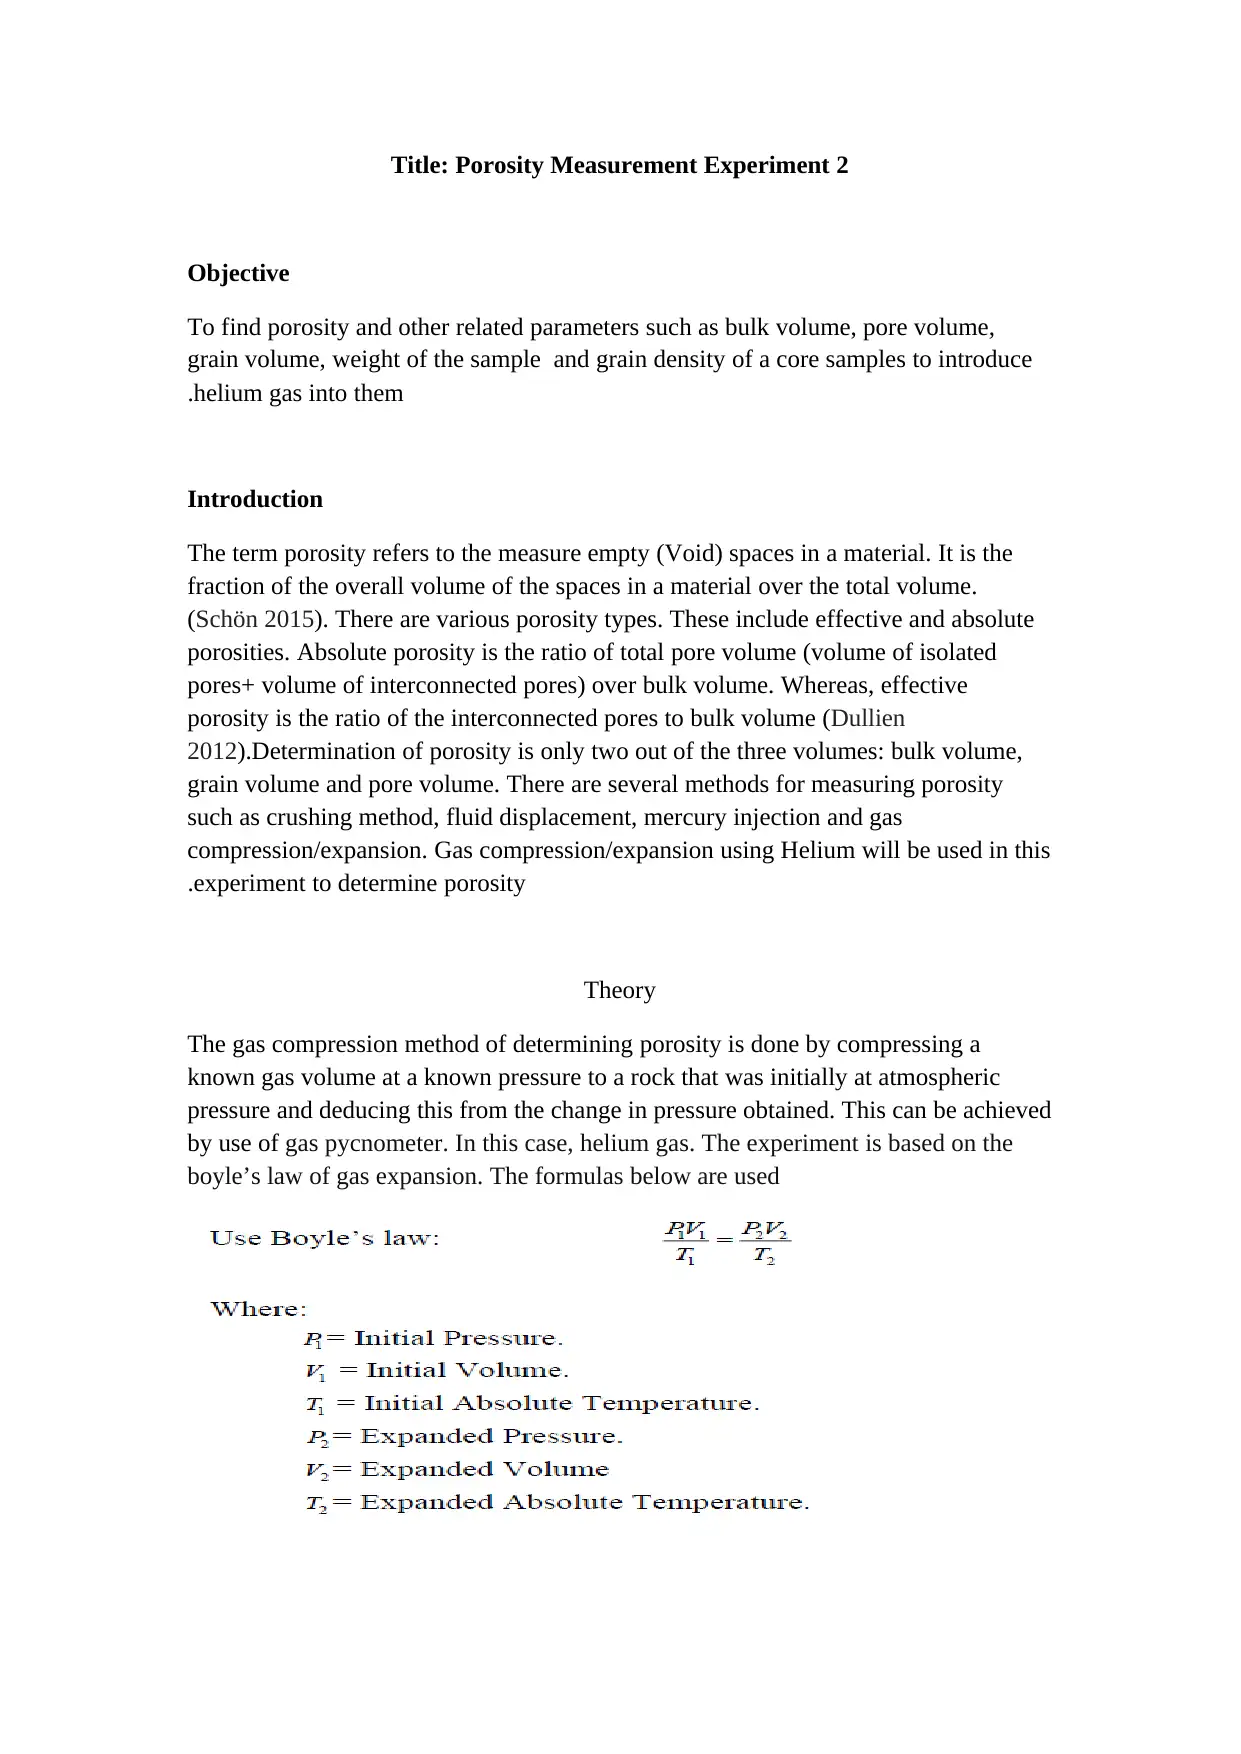
Theory
The gas compression method of determining porosity is done by compressing a
known gas volume at a known pressure to a rock that was initially at atmospheric
pressure and deducing this from the change in pressure obtained. This can be achieved
by use of gas pycnometer. In this case, helium gas. The experiment is based on the
boyle’s law of gas expansion. The formulas below are used
Objective
To find porosity and other related parameters such as bulk volume, pore volume,
grain volume, weight of the sample and grain density of a core samples to introduce
helium gas into them.
Introduction
The term porosity refers to the measure empty (Void) spaces in a material. It is the
fraction of the overall volume of the spaces in a material over the total volume.
(Schön 2015). There are various porosity types. These include effective and absolute
porosities. Absolute porosity is the ratio of total pore volume (volume of isolated
pores+ volume of interconnected pores) over bulk volume. Whereas, effective
porosity is the ratio of the interconnected pores to bulk volume (Dullien
2012).Determination of porosity is only two out of the three volumes: bulk volume,
grain volume and pore volume. There are several methods for measuring porosity
such as crushing method, fluid displacement, mercury injection and gas
compression/expansion. Gas compression/expansion using Helium will be used in this
experiment to determine porosity.
Theory
The gas compression method of determining porosity is done by compressing a
known gas volume at a known pressure to a rock that was initially at atmospheric
pressure and deducing this from the change in pressure obtained. This can be achieved
by use of gas pycnometer. In this case, helium gas. The experiment is based on the
boyle’s law of gas expansion. The formulas below are used
Secure Best Marks with AI Grader
Need help grading? Try our AI Grader for instant feedback on your assignments.
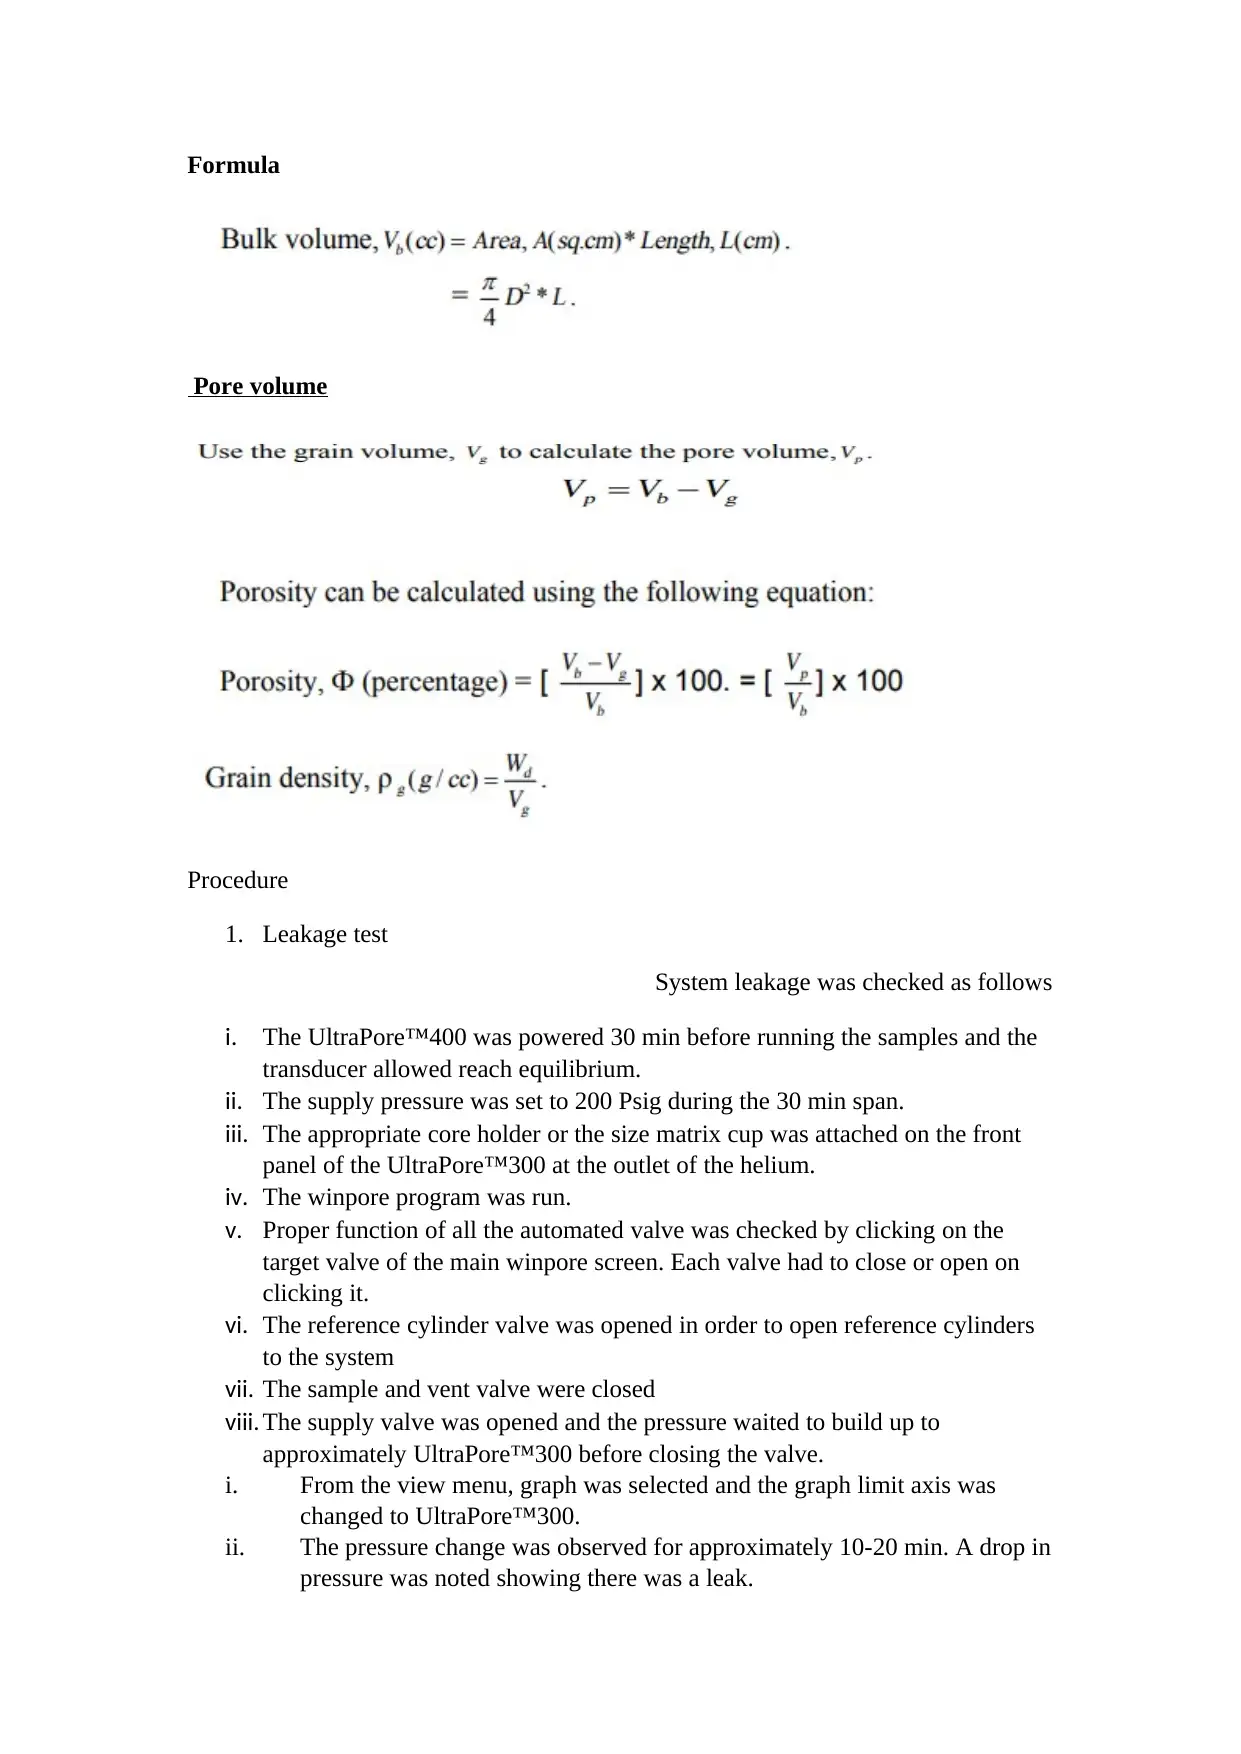
Formula
Pore volume
Procedure
1. Leakage test
System leakage was checked as follows
i. The UltraPore™400 was powered 30 min before running the samples and the
transducer allowed reach equilibrium.
ii. The supply pressure was set to 200 Psig during the 30 min span.
iii. The appropriate core holder or the size matrix cup was attached on the front
panel of the UltraPore™300 at the outlet of the helium.
iv. The winpore program was run.
v. Proper function of all the automated valve was checked by clicking on the
target valve of the main winpore screen. Each valve had to close or open on
clicking it.
vi. The reference cylinder valve was opened in order to open reference cylinders
to the system
vii. The sample and vent valve were closed
viii. The supply valve was opened and the pressure waited to build up to
approximately UltraPore™300 before closing the valve.
i. From the view menu, graph was selected and the graph limit axis was
changed to UltraPore™300.
ii. The pressure change was observed for approximately 10-20 min. A drop in
pressure was noted showing there was a leak.
iii. After leak detection, it was isolated by closing the reference valves one at
a time and observing the pressure change again until the leak location is
determined.
iv. The leak was fixed and the procedure repeated until there is no leak in the
system.
v. When the system is leak free, the graph was printed with QC records.
vi. The sample valve was opened.
vii. Pressure change was observed for 10-20 min and the pressure change
became direct proportional to change in time, meaning the system was
leak-proof. The graph and file with QC records were printed.
viii. The sample valve was closed and the vent valve opened.
2. System grain volume calibration
i. Appropriate matrix cup for the sample to be analyzed was connected to the
Helium Outlet on the front panel of the UltraPore ™300.
ii. The winpore software was ran and a new file opened.
iii. The file header under edit tab was selected and the appropriate type of core
selected.
iv. The desired reference values were opened.
v. Calibration was selected and system GV clicked.
vi. Six disks for calibration were chosen to ensure accuracy.
vii. The first disc was placed on the matrix cup and then closed.
viii. The first disc to be used was selected by clicking on the appropriate button in
the disc.
ix. This was repeated until all the calibration discs were ran. After this, the
program will displayed a square correlation factor within the range of 1.0000
+/- 0.0001.
3. Grain volume determinations.
i. The appropriate Matrix Cup for the sample to be analyzed was connected
to the Helium outlet port on the front panel of the UltraPore™300.
ii. The Matrix Cup cap a-ring was inspected for damage.
iii. The existing data file in winpore was opened and a new data file created.
iv. Under the Core Type in File Header, the appropriate core type was
selected by clicking on the Option boxes.
v. Leak and calibration tests were checked as described above
vi. The tab Sample ID cell in the Sample Details area of the window was
clicked and sample number entered.
vii. The Grain Volume was selected from the Measure menu.
viii. The Stability Test Criteria was entered.
ix. Calibration disks to be placed in the bottom of the Matrix Cup such that
the top of the sample approached but did not exceed the top of the Matrix
Cup was chosen.
x. Winpore analyzed the sample, determining pressure stabilization and
performing all necessary calculations.
xi. At the conclusion of the test, the system checked for the ratio of pressures
and displayed it in the Message Bar in the Sample Details section.
Results
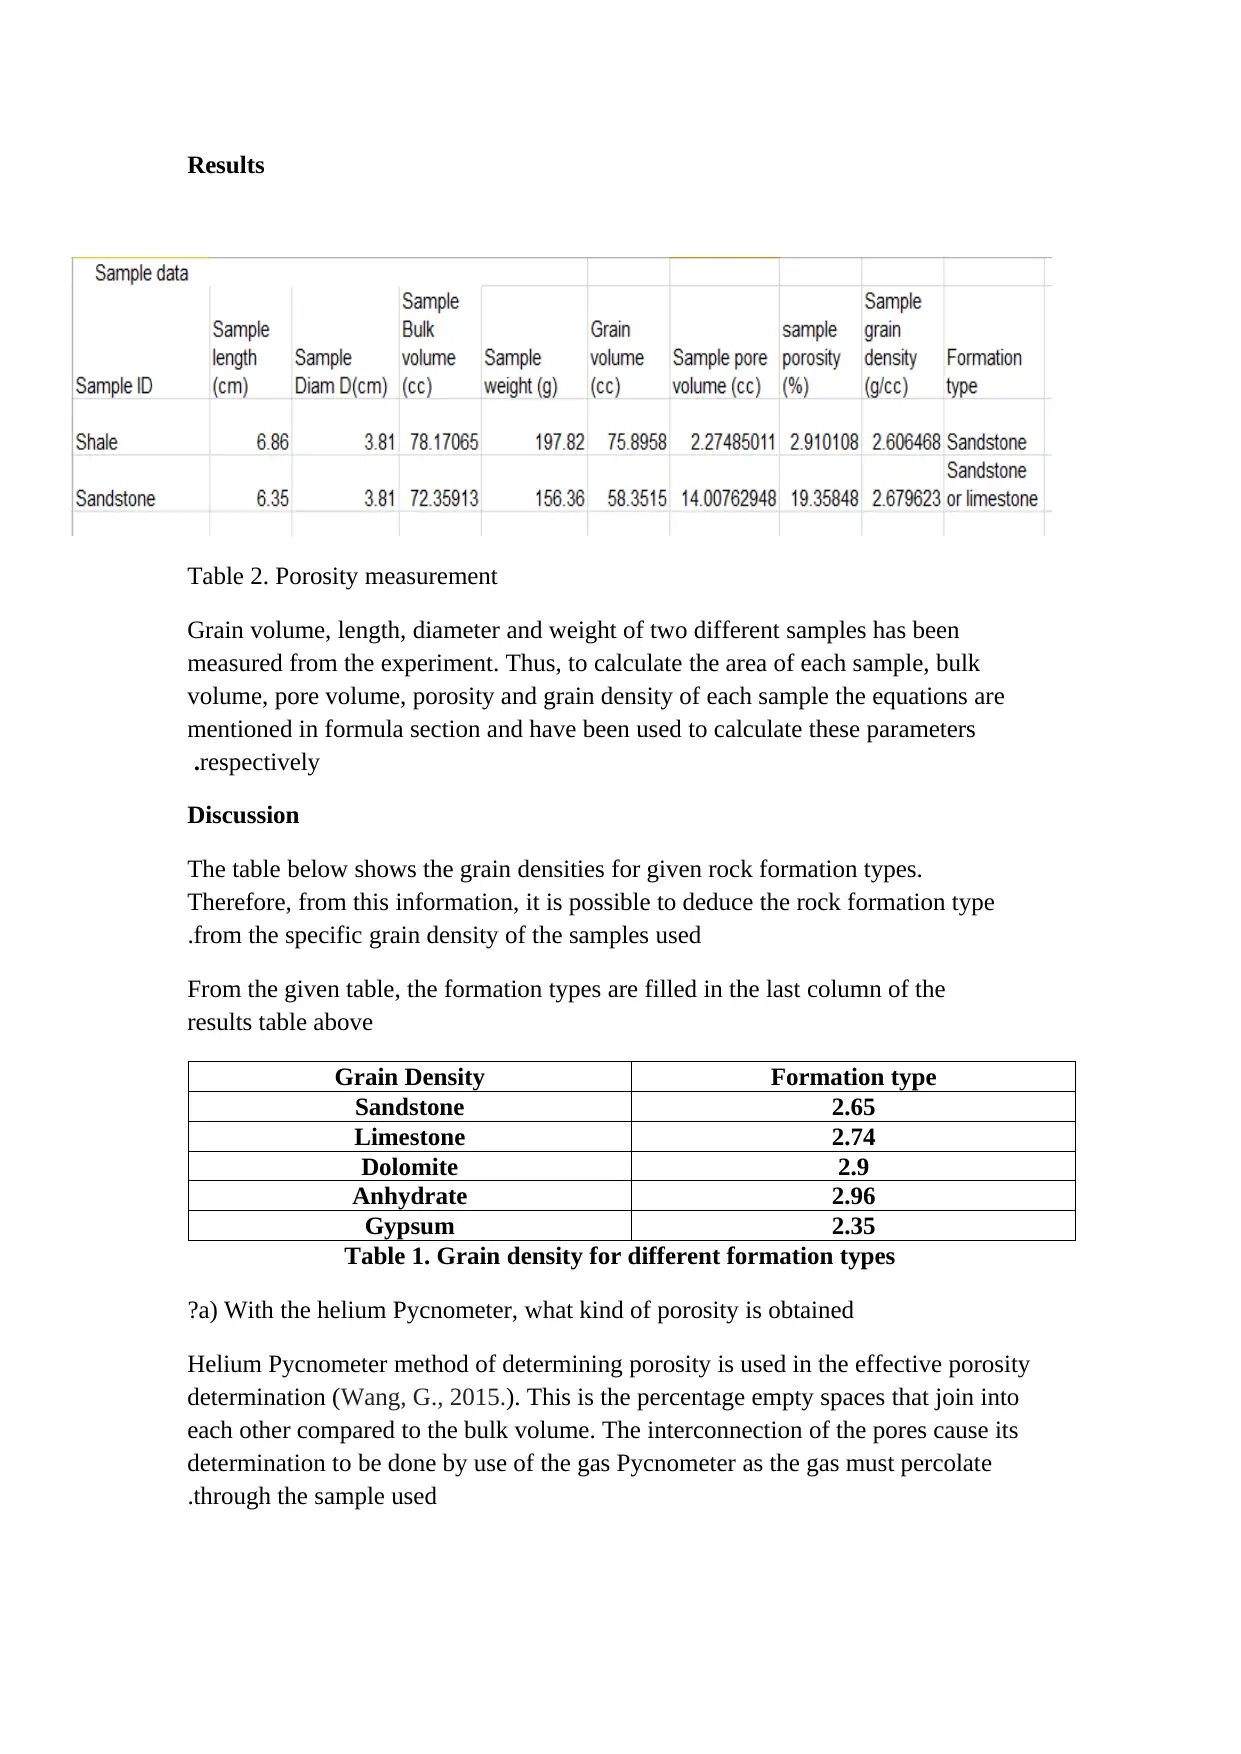
Table 2. Porosity measurement
Grain volume, length, diameter and weight of two different samples has been
measured from the experiment. Thus, to calculate the area of each sample, bulk
volume, pore volume, porosity and grain density of each sample the equations are
mentioned in formula section and have been used to calculate these parameters
respectively.
Discussion
The table below shows the grain densities for given rock formation types.
Therefore, from this information, it is possible to deduce the rock formation type
from the specific grain density of the samples used.
From the given table, the formation types are filled in the last column of the
results table above
Formation typeGrain Density
2.65Sandstone
2.74Limestone
2.9Dolomite
2.96Anhydrate
2.35Gypsum
Table 1. Grain density for different formation types
a) With the helium Pycnometer, what kind of porosity is obtained?
Helium Pycnometer method of determining porosity is used in the effective porosity
determination (Wang, G., 2015.). This is the percentage empty spaces that join into
each other compared to the bulk volume. The interconnection of the pores cause its
determination to be done by use of the gas Pycnometer as the gas must percolate
through the sample used.
Secure Best Marks with AI Grader
Need help grading? Try our AI Grader for instant feedback on your assignments.
b) What is the next preference gas, if helium is not available for Boyle's law
Pycnometer? State why?
In case helium gas is unavailable for use in the Pycnometer, nitrogen gas is the next
preference gas. This is because nitrogen gas is inert as helium gas and therefor it
eliminates the surface chemistry, or rather reaction, and therefore able to penetrate to
the finest pore. It has also small molecule and low atomic mass hence higher
penetration rate leading to high accuracy results.
c) What type of porosity you get by this method? Why?
Helium Pycnometer method of determining porosity is used in the effective porosity
determination (Wang, G., 2015.). This is the percentage empty spaces that join into
each other compared to the bulk volume. The interconnection of the pores cause its
determination to be done by use of the gas Pycnometer as the gas must percolate
through the sample used.
Conclusion
It was possible to deduce the porosity of different samples of rocks by use of the gas
Pycnometer method. This was made possible by application of the Boyle’s principle.
When a given a known amount was passed through the rock sample of known
dimensions at a known pressure, the pressure of the gas reduced. The reduction in
pressure is as a result of the air absorbed by the pores of the rock sample and hence
made it possible to deduce the porosity of the rock samples used (Bear 2013). The
table of values of different rock formation of a given grain density made it possible to
determine the rock formation type.

References
Bear, J., 2013. Dynamics of fluids in porous media. Courier Corporation
Dullien, F.A., 2012. Porous media: fluid transport and pore structure. Academic
press.
Schön, J.H., 2015. Physical properties of rocks: Fundamentals and principles of
petrophysics (Vol. 65). Elsevier.
Wang G, Pore structure characteristics of coal-bearing shale using fluid invasion
methods: A case study in the Huainan–Huaibei Coalfield in China. Marine and
Petroleum Geology, 62, pp.1-13.
1 out of 6
Your All-in-One AI-Powered Toolkit for Academic Success.
+13062052269
info@desklib.com
Available 24*7 on WhatsApp / Email
![[object Object]](/_next/static/media/star-bottom.7253800d.svg)
Unlock your academic potential
© 2024 | Zucol Services PVT LTD | All rights reserved.