TMA03 - Question 3
6 Pages1217 Words73 Views
Added on 2023-04-21
About This Document
This document provides the solution to Question 3 of TMA03, which involves calculating the mean, median, and standard deviation of spam email messages. It also includes hypothesis testing for the difference in median and the confidence interval for the number of spam email messages.
TMA03 - Question 3
Added on 2023-04-21
ShareRelated Documents
TMA03 - Question 3
3.
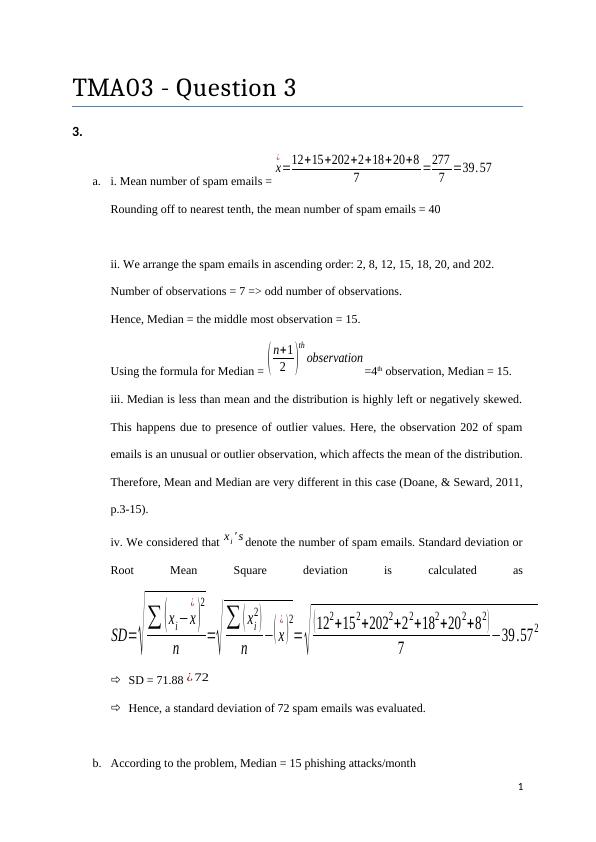
a. i. Mean number of spam emails =
x
¿
=12+15+202+2+18+ 20+8
7 =277
7 =39. 57
Rounding off to nearest tenth, the mean number of spam emails = 40
ii. We arrange the spam emails in ascending order: 2, 8, 12, 15, 18, 20, and 202.
Number of observations = 7 => odd number of observations.
Hence, Median = the middle most observation = 15.
Using the formula for Median = ( n+1
2 )
th
observation
=4th observation, Median = 15.
iii. Median is less than mean and the distribution is highly left or negatively skewed.
This happens due to presence of outlier values. Here, the observation 202 of spam
emails is an unusual or outlier observation, which affects the mean of the distribution.
Therefore, Mean and Median are very different in this case (Doane, & Seward, 2011,
p.3-15).
iv. We considered that xi ' s denote the number of spam emails. Standard deviation or
Root Mean Square deviation is calculated as
SD= √ ∑ ( xi−x
¿
)
2
n = √ ∑ ( xi
2 )
n −( x
¿
) 2
= √ ( 122+152+2022+22+182+202+82 )
7 −39 .572
SD = 71.88 ¿ 72
Hence, a standard deviation of 72 spam emails was evaluated.
b. According to the problem, Median = 15 phishing attacks/month
1
3.
a. i. Mean number of spam emails =
x
¿
=12+15+202+2+18+ 20+8
7 =277
7 =39. 57
Rounding off to nearest tenth, the mean number of spam emails = 40
ii. We arrange the spam emails in ascending order: 2, 8, 12, 15, 18, 20, and 202.
Number of observations = 7 => odd number of observations.
Hence, Median = the middle most observation = 15.
Using the formula for Median = ( n+1
2 )
th
observation
=4th observation, Median = 15.
iii. Median is less than mean and the distribution is highly left or negatively skewed.
This happens due to presence of outlier values. Here, the observation 202 of spam
emails is an unusual or outlier observation, which affects the mean of the distribution.
Therefore, Mean and Median are very different in this case (Doane, & Seward, 2011,
p.3-15).
iv. We considered that xi ' s denote the number of spam emails. Standard deviation or
Root Mean Square deviation is calculated as
SD= √ ∑ ( xi−x
¿
)
2
n = √ ∑ ( xi
2 )
n −( x
¿
) 2
= √ ( 122+152+2022+22+182+202+82 )
7 −39 .572
SD = 71.88 ¿ 72
Hence, a standard deviation of 72 spam emails was evaluated.
b. According to the problem, Median = 15 phishing attacks/month
1
Members whose email accounts were monitored = N = 20.
Recorded phishing attacks are recorded in ascending order as:
4 8 8 10 12 12 12 12 13 13 14 16
16 16 17 18 19 20 20 21
Approach A: Hypothesis testing for difference in Median
Let, M d be the difference between sample median and hypothesized median.
Null hypothesis: H0 : ( M d=0 )
Alternate hypothesis: H A : ( M d ≠0 )
The difference between population median and the sample medians was noted to
follow a symmetric binomial distribution (according to the problem). Now, using the
normal approximation to the binomially distributed deviations, the Z-test is used for
assessing the hypotheses.
The population distribution for deviation from the median has been used to calculate
the mean and the standard deviation (population). Mean for deviation from median
M d= ∑ xf
∑ f =0 and the standard deviation has been calculated as
σ = √ ∑ x2 f
∑ f −Md
2= √ 4 . 94
0. 996 =2. 23
Arranging the observations in ascending order, the median of the sample is evaluated
as 13.5.
2
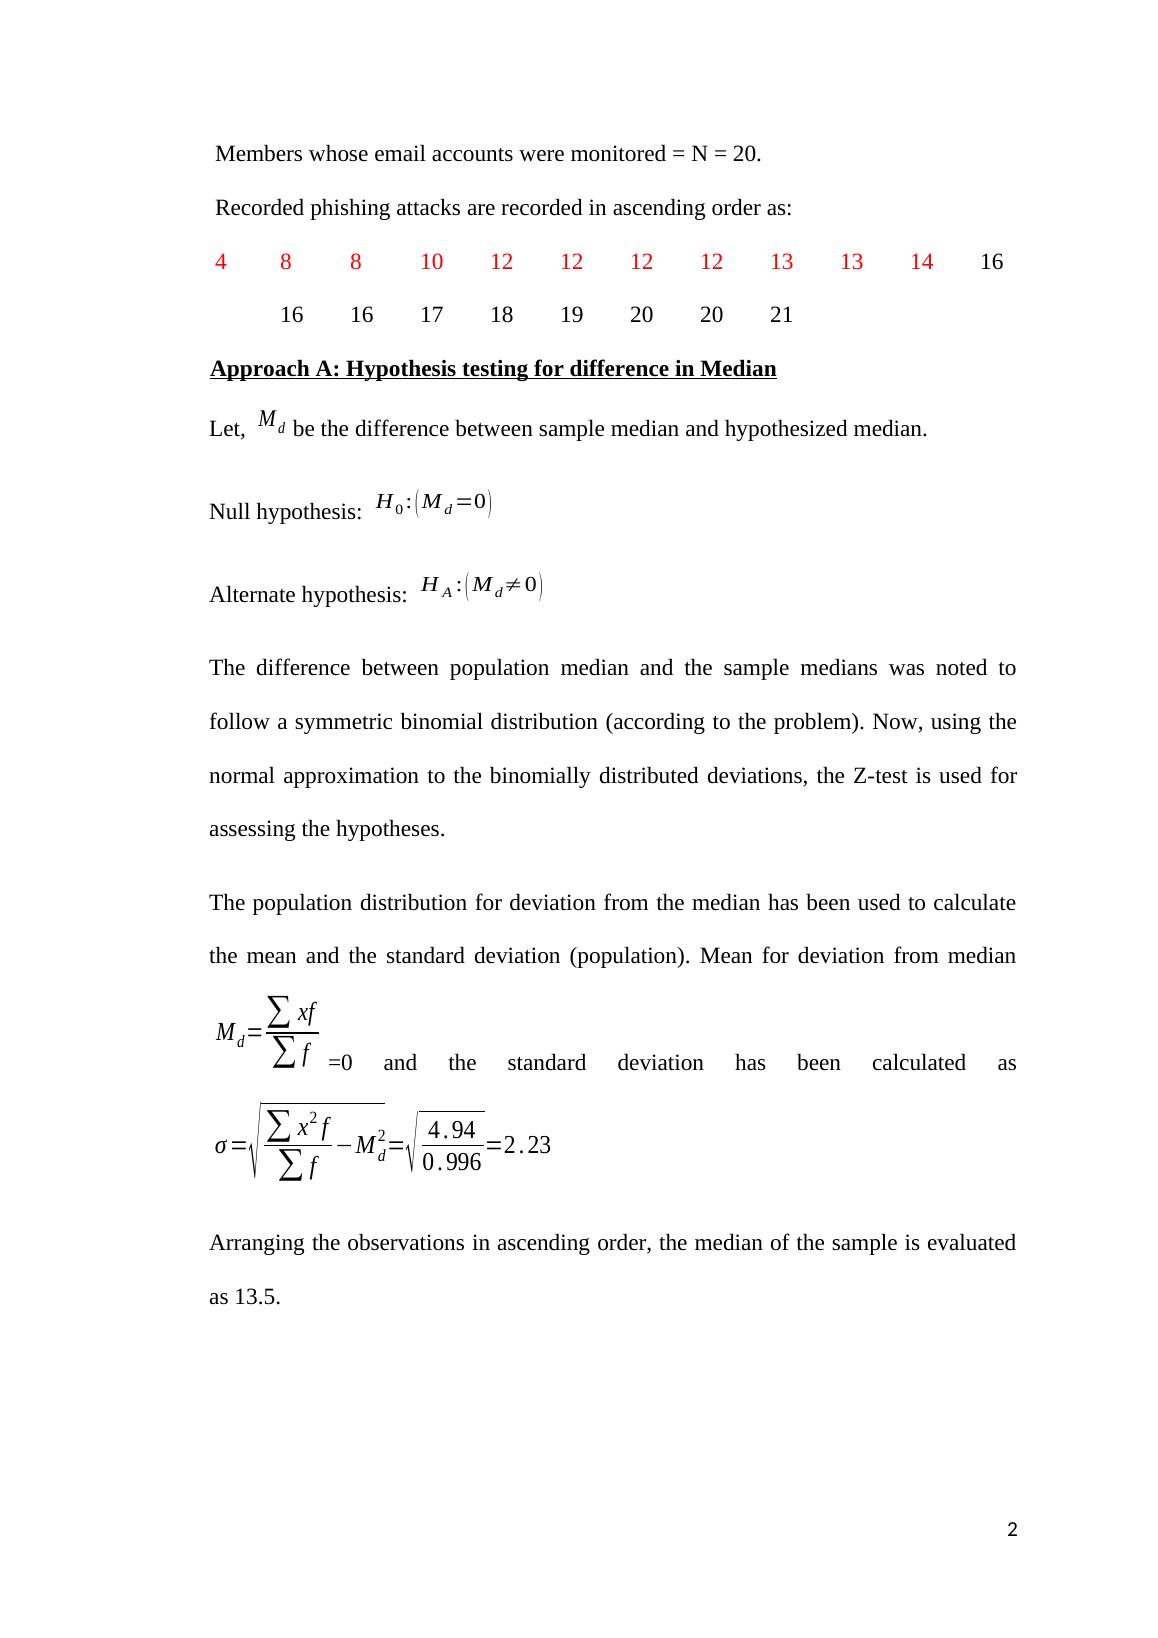
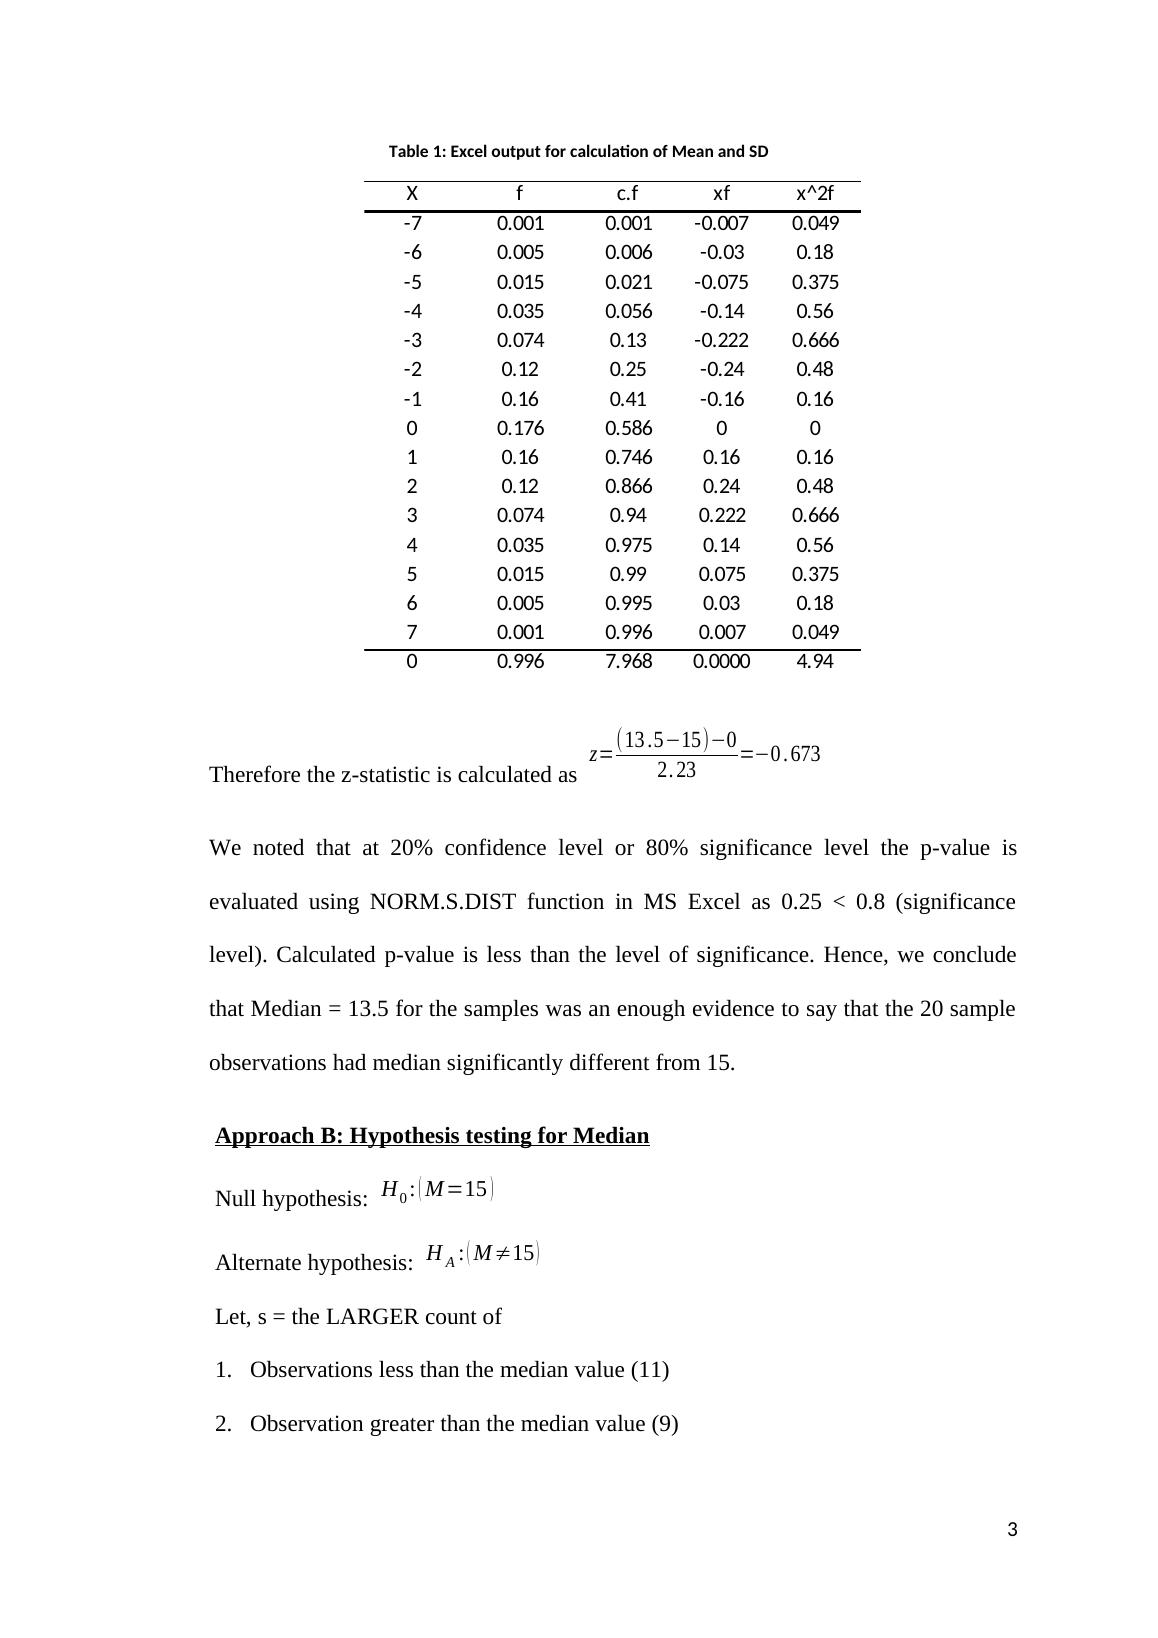
Table 1: Excel output for calculation of Mean and SD
X f c.f xf x^2f
-7 0.001 0.001 -0.007 0.049
-6 0.005 0.006 -0.03 0.18
-5 0.015 0.021 -0.075 0.375
-4 0.035 0.056 -0.14 0.56
-3 0.074 0.13 -0.222 0.666
-2 0.12 0.25 -0.24 0.48
-1 0.16 0.41 -0.16 0.16
0 0.176 0.586 0 0
1 0.16 0.746 0.16 0.16
2 0.12 0.866 0.24 0.48
3 0.074 0.94 0.222 0.666
4 0.035 0.975 0.14 0.56
5 0.015 0.99 0.075 0.375
6 0.005 0.995 0.03 0.18
7 0.001 0.996 0.007 0.049
0 0.996 7.968 0.0000 4.94
Therefore the z-statistic is calculated as z=(13 .5−15 )−0
2. 23 =−0. 673
We noted that at 20% confidence level or 80% significance level the p-value is
evaluated using NORM.S.DIST function in MS Excel as 0.25 < 0.8 (significance
level). Calculated p-value is less than the level of significance. Hence, we conclude
that Median = 13.5 for the samples was an enough evidence to say that the 20 sample
observations had median significantly different from 15.
Approach B: Hypothesis testing for Median
Null hypothesis: H0 : ( M =15 )
Alternate hypothesis: H A : ( M ≠15 )
Let, s = the LARGER count of
1. Observations less than the median value (11)
2. Observation greater than the median value (9)
3
End of preview
Want to access all the pages? Upload your documents or become a member.