Comparing Total Nitrogen, Inorganic Nitrogen, and Total Organic Carbon in Wastewater: A Fact Sheet
VerifiedAdded on 2023/04/25
|10
|2208
|300
AI Summary
In this analysis we will discuss about nitrogen & Inorganic nitrogen in wastewater and below are the summaries point:-
Total nitrogen in wastewater includes various nitrogen compounds, measured through combustion and analysis.
Inorganic nitrogen in wastewater comprises ammonium, ammonia, nitrites, and nitrates, determined by summing individual concentrations.
Total organic carbon (TOC) analysis quantifies organic compounds in water, with reported values in effluent from WWTPs.
Contribute Materials
Your contribution can guide someone’s learning journey. Share your
documents today.
Compare fact sheet
Student name
Student name
Secure Best Marks with AI Grader
Need help grading? Try our AI Grader for instant feedback on your assignments.
Table of Contents
Compare fact sheet................................................................................................................................2
Total nitrogen and Inorganic nitrogen in wastewater.........................................................................2
Total organic carbon (TOC)..............................................................................................................2
Chemical oxygen demand (COD)......................................................................................................2
Total phosphorus...............................................................................................................................3
Absorbable halogens..........................................................................................................................3
Chromium..........................................................................................................................................3
Copper...............................................................................................................................................4
Nickel................................................................................................................................................4
Zinc...................................................................................................................................................4
Mercury.............................................................................................................................................5
Oxides of sulfur in flue gases............................................................................................................5
Oxides of nitrogen.............................................................................................................................6
Phosphorus........................................................................................................................................6
References.............................................................................................................................................7
Compare fact sheet
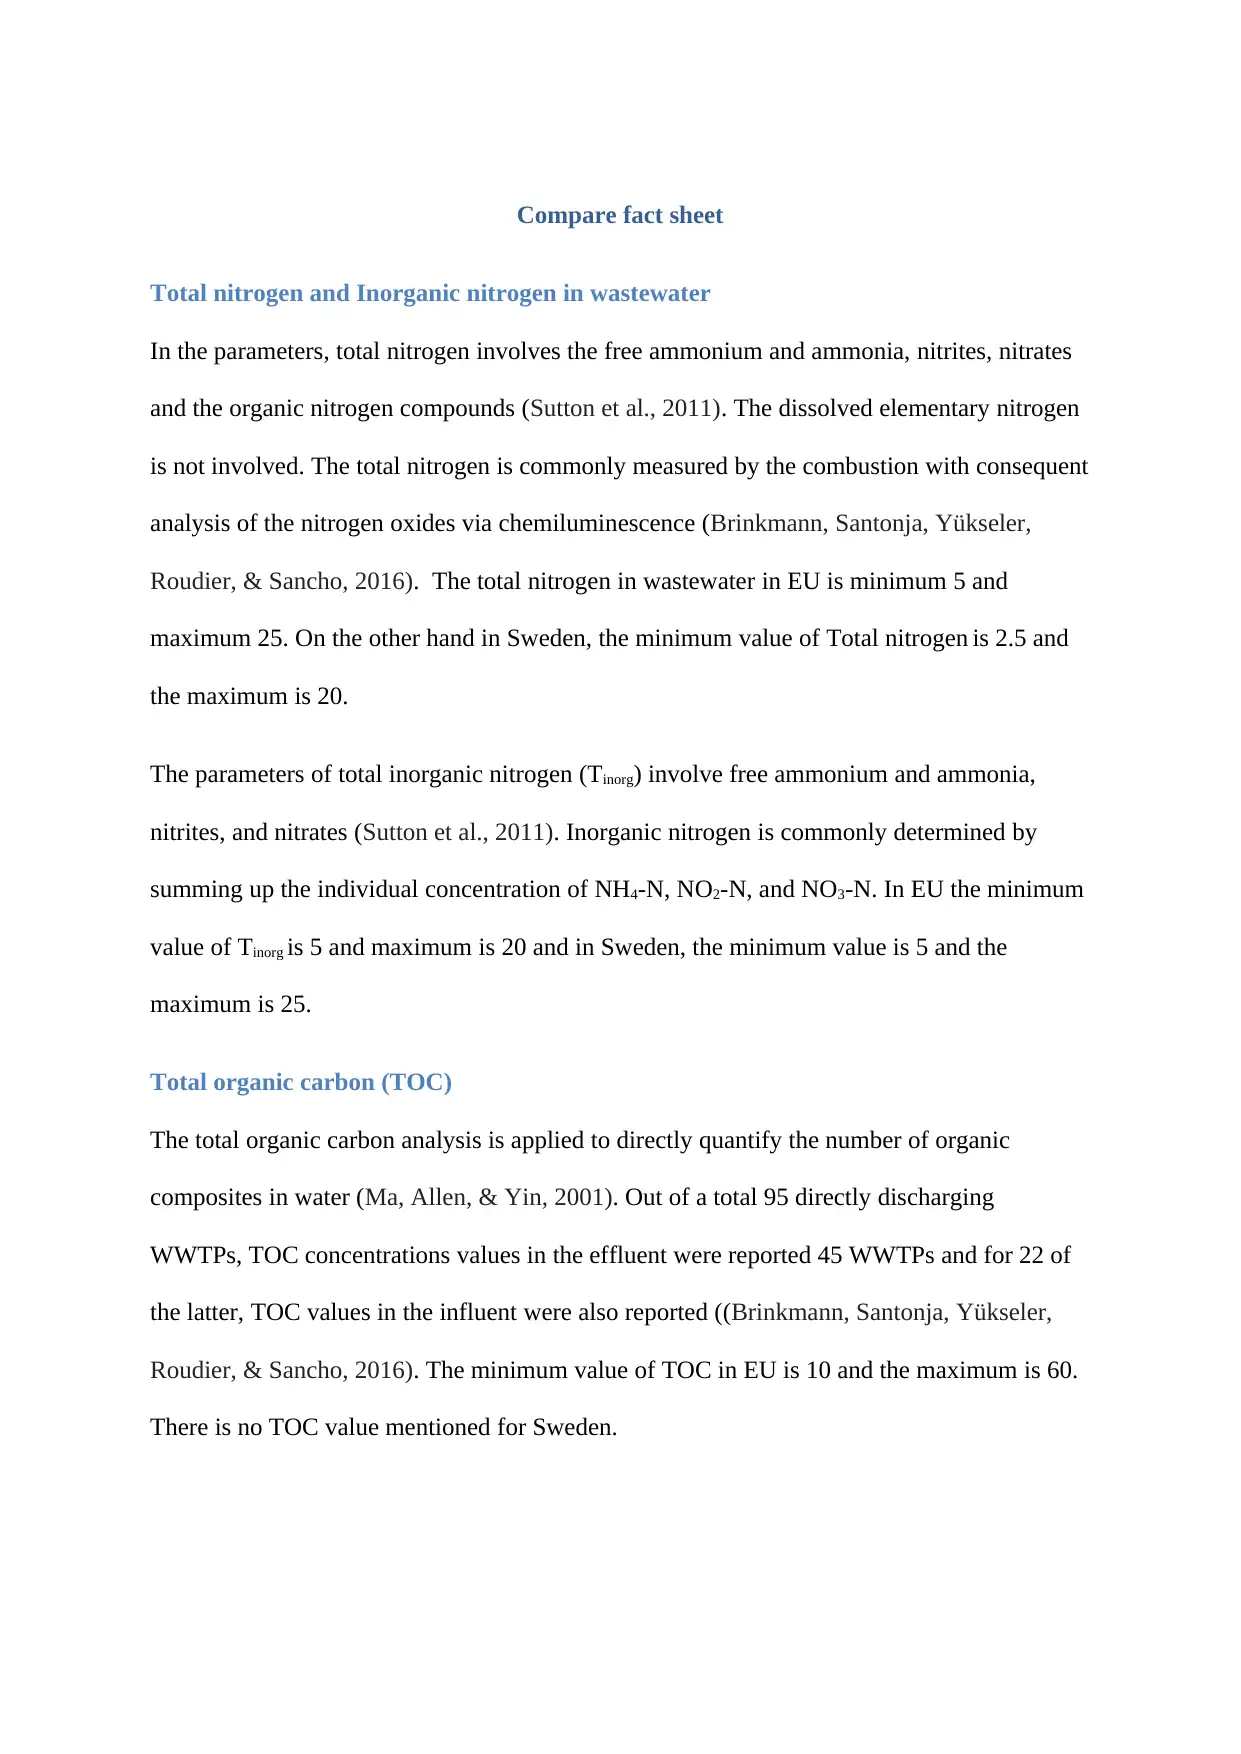
Total nitrogen and Inorganic nitrogen in wastewater
In the parameters, total nitrogen involves the free ammonium and ammonia, nitrites, nitrates
and the organic nitrogen compounds (Sutton et al., 2011). The dissolved elementary nitrogen
is not involved. The total nitrogen is commonly measured by the combustion with consequent
analysis of the nitrogen oxides via chemiluminescence (Brinkmann, Santonja, Yükseler,
Roudier, & Sancho, 2016). The total nitrogen in wastewater in EU is minimum 5 and
maximum 25. On the other hand in Sweden, the minimum value of Total nitrogen is 2.5 and
the maximum is 20.
The parameters of total inorganic nitrogen (Tinorg) involve free ammonium and ammonia,
nitrites, and nitrates (Sutton et al., 2011). Inorganic nitrogen is commonly determined by
summing up the individual concentration of NH4-N, NO2-N, and NO3-N. In EU the minimum
value of Tinorg is 5 and maximum is 20 and in Sweden, the minimum value is 5 and the
maximum is 25.
Total organic carbon (TOC)
The total organic carbon analysis is applied to directly quantify the number of organic
composites in water (Ma, Allen, & Yin, 2001). Out of a total 95 directly discharging
WWTPs, TOC concentrations values in the effluent were reported 45 WWTPs and for 22 of
the latter, TOC values in the influent were also reported ((Brinkmann, Santonja, Yükseler,
Roudier, & Sancho, 2016). The minimum value of TOC in EU is 10 and the maximum is 60.
There is no TOC value mentioned for Sweden.
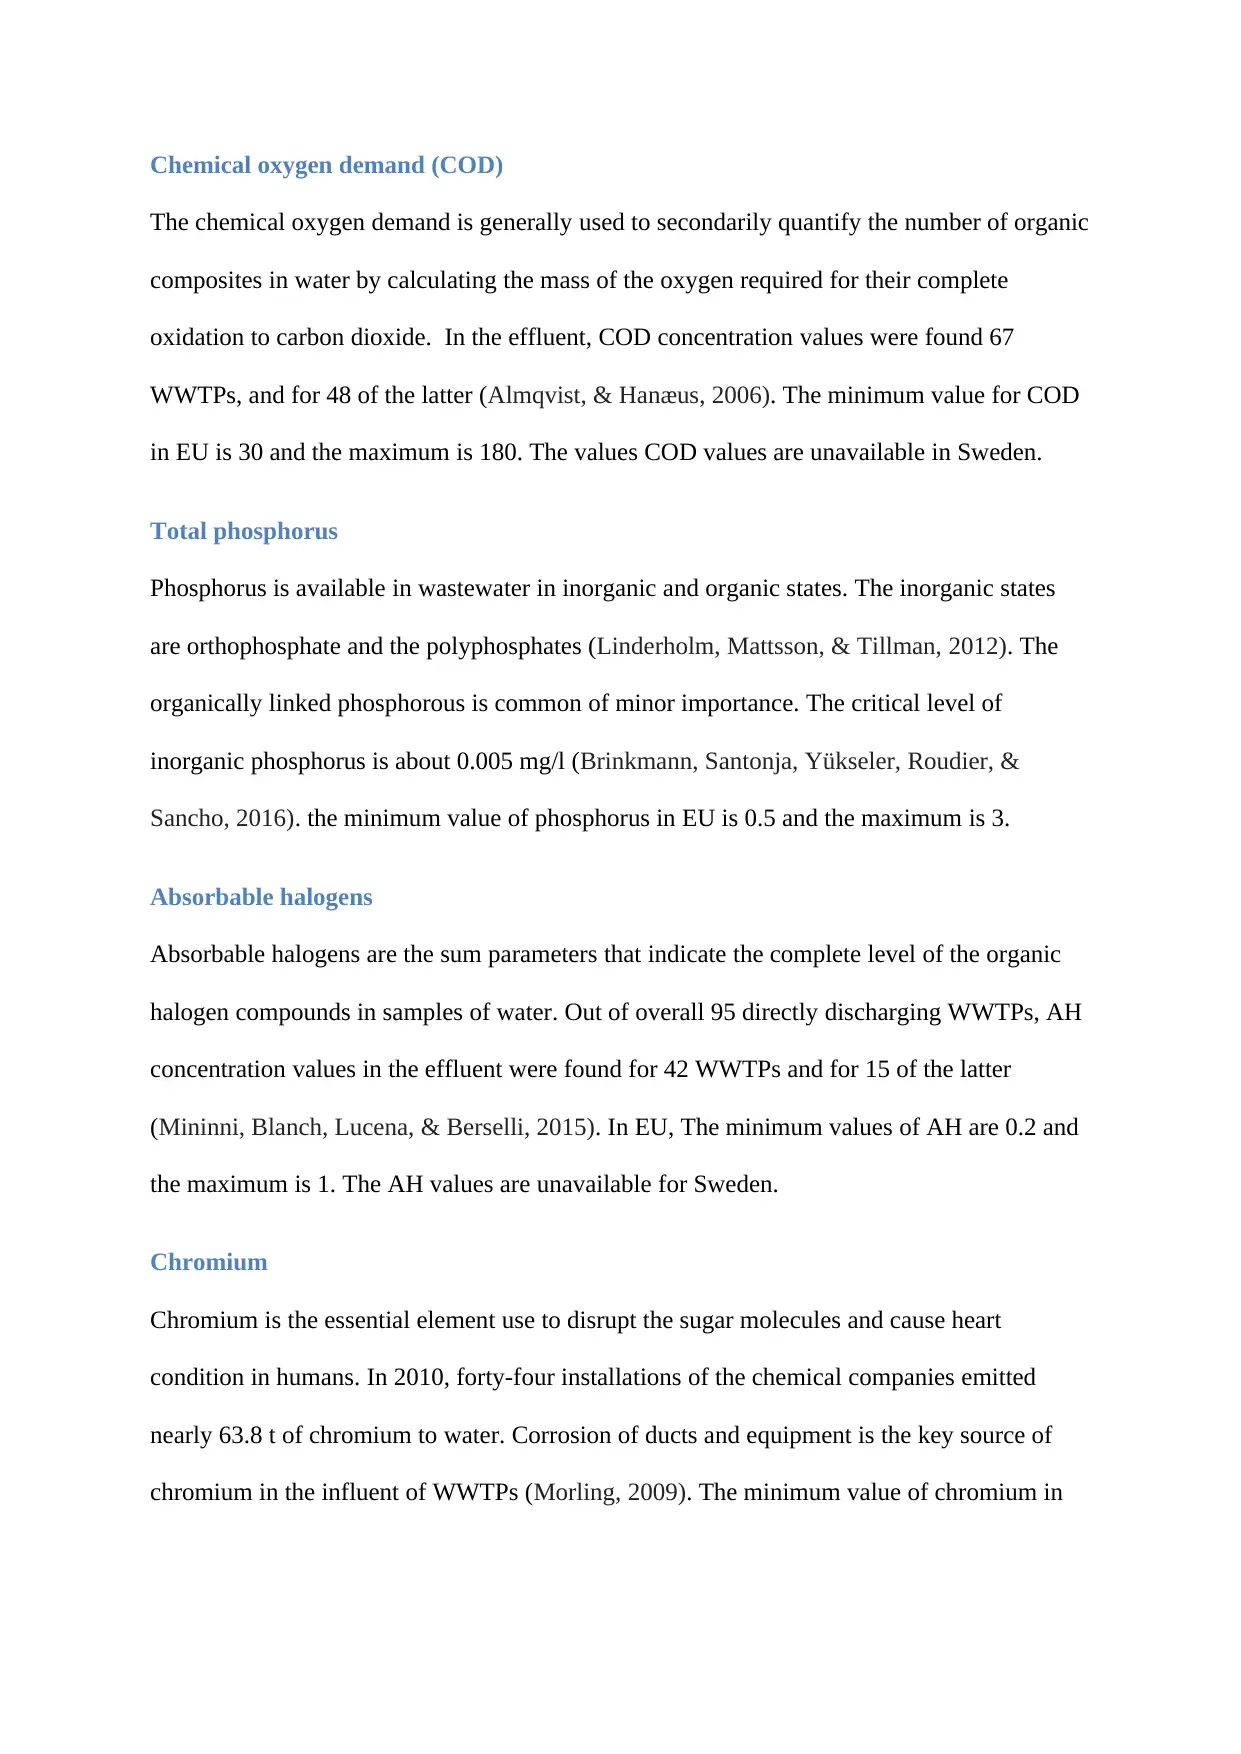
Chemical oxygen demand (COD)
The chemical oxygen demand is generally used to secondarily quantify the number of organic
composites in water by calculating the mass of the oxygen required for their complete
oxidation to carbon dioxide. In the effluent, COD concentration values were found 67
WWTPs, and for 48 of the latter (Almqvist, & Hanæus, 2006). The minimum value for COD
in EU is 30 and the maximum is 180. The values COD values are unavailable in Sweden.
Total phosphorus
Phosphorus is available in wastewater in inorganic and organic states. The inorganic states
are orthophosphate and the polyphosphates (Linderholm, Mattsson, & Tillman, 2012). The
organically linked phosphorous is common of minor importance. The critical level of
inorganic phosphorus is about 0.005 mg/l (Brinkmann, Santonja, Yükseler, Roudier, &
Sancho, 2016). the minimum value of phosphorus in EU is 0.5 and the maximum is 3.
Absorbable halogens
Absorbable halogens are the sum parameters that indicate the complete level of the organic
halogen compounds in samples of water. Out of overall 95 directly discharging WWTPs, AH
concentration values in the effluent were found for 42 WWTPs and for 15 of the latter
(Mininni, Blanch, Lucena, & Berselli, 2015). In EU, The minimum values of AH are 0.2 and
the maximum is 1. The AH values are unavailable for Sweden.
Chromium
Chromium is the essential element use to disrupt the sugar molecules and cause heart
condition in humans. In 2010, forty-four installations of the chemical companies emitted
nearly 63.8 t of chromium to water. Corrosion of ducts and equipment is the key source of
chromium in the influent of WWTPs (Morling, 2009). The minimum value of chromium in
Secure Best Marks with AI Grader
Need help grading? Try our AI Grader for instant feedback on your assignments.
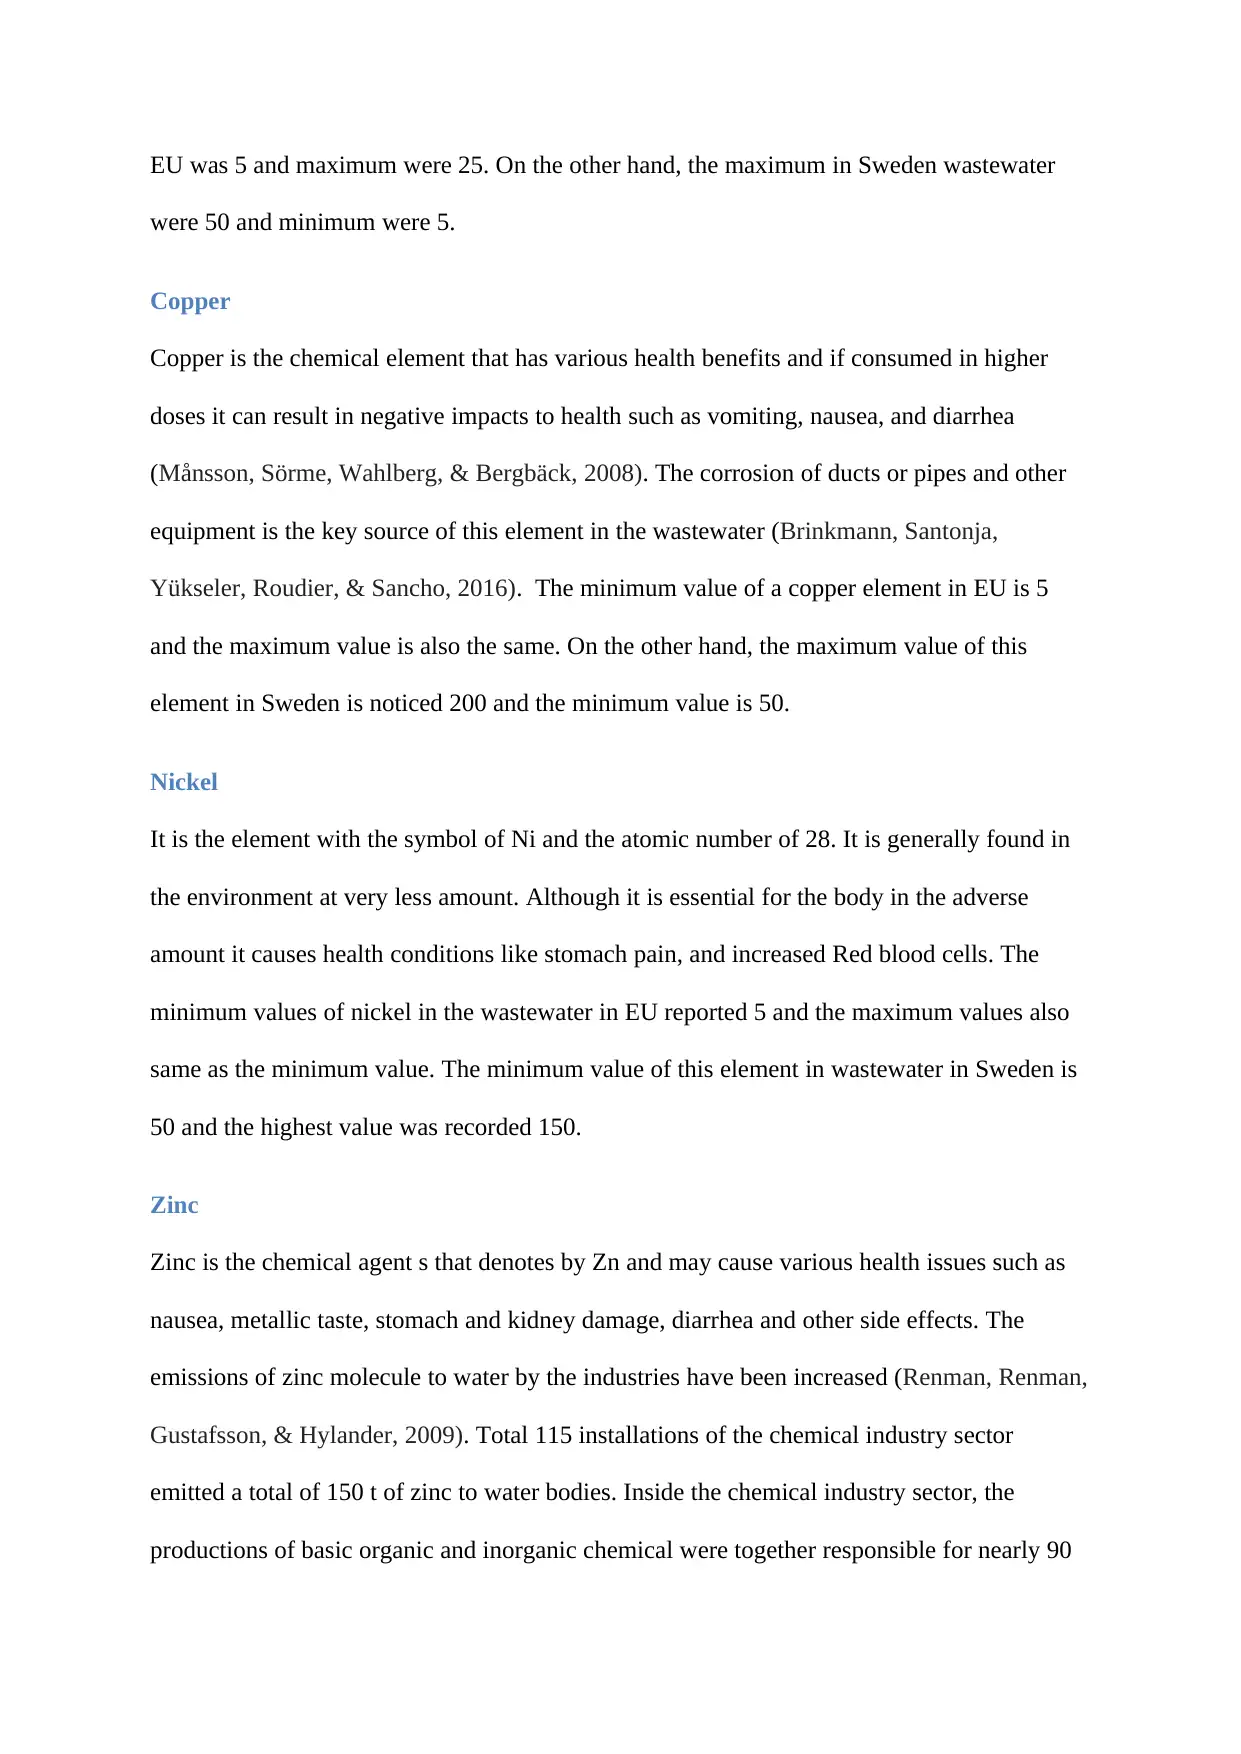
EU was 5 and maximum were 25. On the other hand, the maximum in Sweden wastewater
were 50 and minimum were 5.
Copper
Copper is the chemical element that has various health benefits and if consumed in higher
doses it can result in negative impacts to health such as vomiting, nausea, and diarrhea
(Månsson, Sörme, Wahlberg, & Bergbäck, 2008). The corrosion of ducts or pipes and other
equipment is the key source of this element in the wastewater (Brinkmann, Santonja,
Yükseler, Roudier, & Sancho, 2016). The minimum value of a copper element in EU is 5
and the maximum value is also the same. On the other hand, the maximum value of this
element in Sweden is noticed 200 and the minimum value is 50.
Nickel
It is the element with the symbol of Ni and the atomic number of 28. It is generally found in
the environment at very less amount. Although it is essential for the body in the adverse
amount it causes health conditions like stomach pain, and increased Red blood cells. The
minimum values of nickel in the wastewater in EU reported 5 and the maximum values also
same as the minimum value. The minimum value of this element in wastewater in Sweden is
50 and the highest value was recorded 150.
Zinc
Zinc is the chemical agent s that denotes by Zn and may cause various health issues such as
nausea, metallic taste, stomach and kidney damage, diarrhea and other side effects. The
emissions of zinc molecule to water by the industries have been increased (Renman, Renman,
Gustafsson, & Hylander, 2009). Total 115 installations of the chemical industry sector
emitted a total of 150 t of zinc to water bodies. Inside the chemical industry sector, the
productions of basic organic and inorganic chemical were together responsible for nearly 90
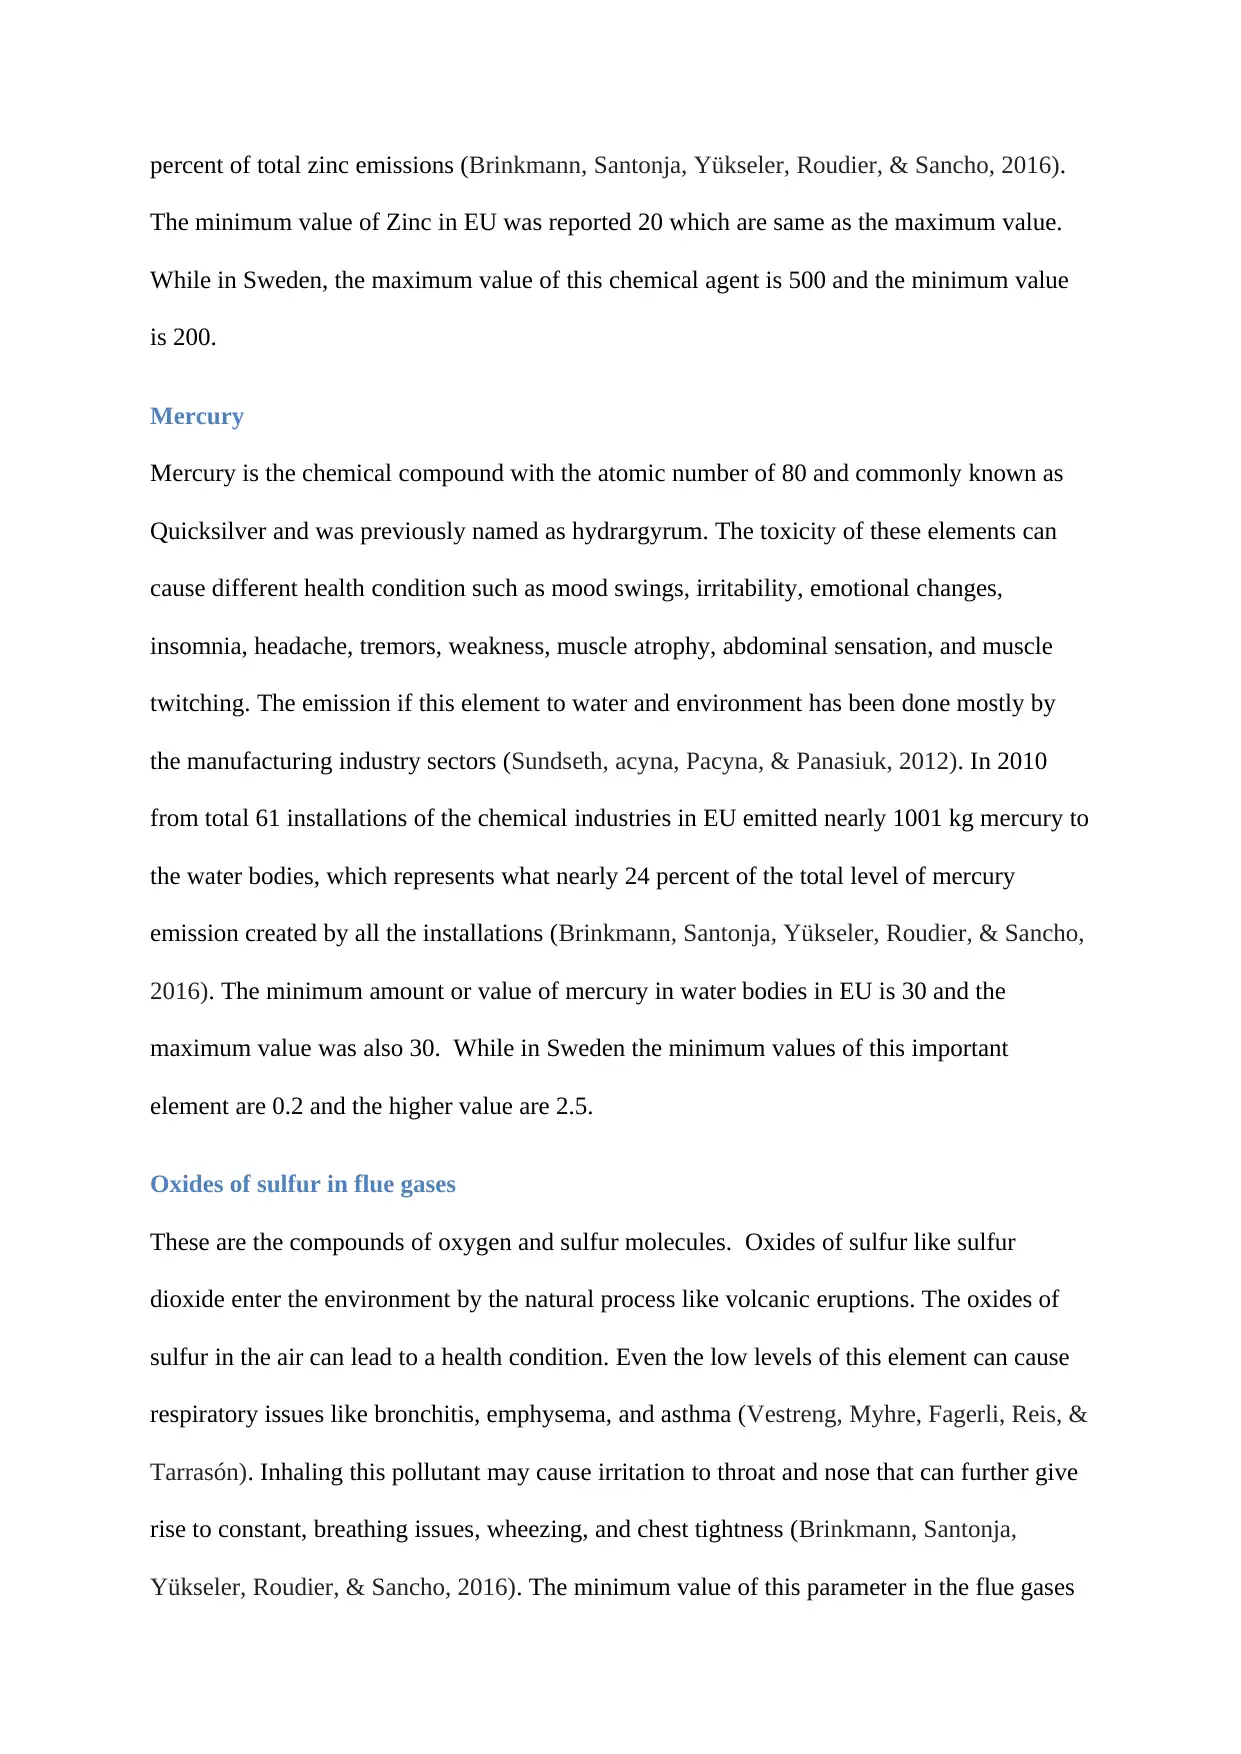
percent of total zinc emissions (Brinkmann, Santonja, Yükseler, Roudier, & Sancho, 2016).
The minimum value of Zinc in EU was reported 20 which are same as the maximum value.
While in Sweden, the maximum value of this chemical agent is 500 and the minimum value
is 200.
Mercury
Mercury is the chemical compound with the atomic number of 80 and commonly known as
Quicksilver and was previously named as hydrargyrum. The toxicity of these elements can
cause different health condition such as mood swings, irritability, emotional changes,
insomnia, headache, tremors, weakness, muscle atrophy, abdominal sensation, and muscle
twitching. The emission if this element to water and environment has been done mostly by
the manufacturing industry sectors (Sundseth, acyna, Pacyna, & Panasiuk, 2012). In 2010
from total 61 installations of the chemical industries in EU emitted nearly 1001 kg mercury to
the water bodies, which represents what nearly 24 percent of the total level of mercury
emission created by all the installations (Brinkmann, Santonja, Yükseler, Roudier, & Sancho,
2016). The minimum amount or value of mercury in water bodies in EU is 30 and the
maximum value was also 30. While in Sweden the minimum values of this important
element are 0.2 and the higher value are 2.5.
Oxides of sulfur in flue gases
These are the compounds of oxygen and sulfur molecules. Oxides of sulfur like sulfur
dioxide enter the environment by the natural process like volcanic eruptions. The oxides of
sulfur in the air can lead to a health condition. Even the low levels of this element can cause
respiratory issues like bronchitis, emphysema, and asthma (Vestreng, Myhre, Fagerli, Reis, &
Tarrasón). Inhaling this pollutant may cause irritation to throat and nose that can further give
rise to constant, breathing issues, wheezing, and chest tightness (Brinkmann, Santonja,
Yükseler, Roudier, & Sancho, 2016). The minimum value of this parameter in the flue gases
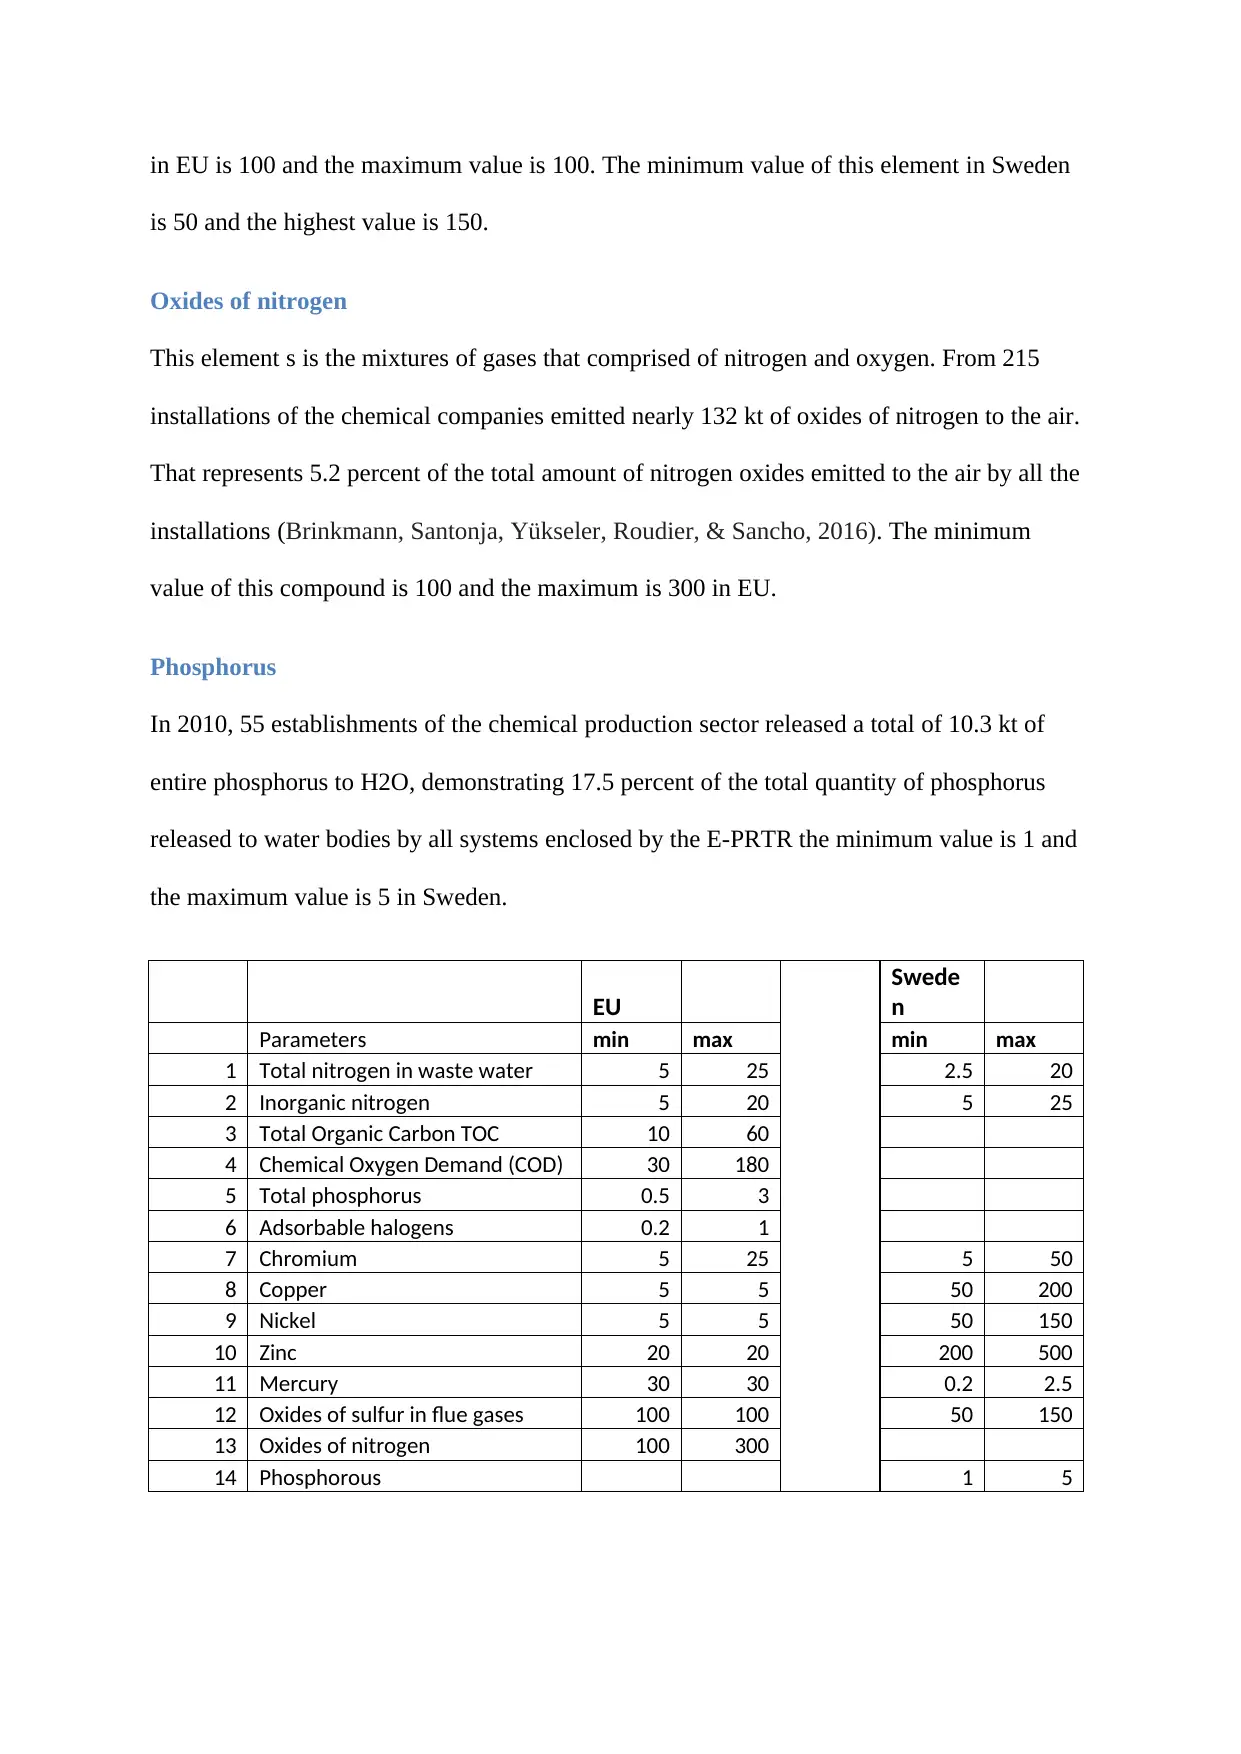
in EU is 100 and the maximum value is 100. The minimum value of this element in Sweden
is 50 and the highest value is 150.
Oxides of nitrogen
This element s is the mixtures of gases that comprised of nitrogen and oxygen. From 215
installations of the chemical companies emitted nearly 132 kt of oxides of nitrogen to the air.
That represents 5.2 percent of the total amount of nitrogen oxides emitted to the air by all the
installations (Brinkmann, Santonja, Yükseler, Roudier, & Sancho, 2016). The minimum
value of this compound is 100 and the maximum is 300 in EU.
Phosphorus
In 2010, 55 establishments of the chemical production sector released a total of 10.3 kt of
entire phosphorus to H2O, demonstrating 17.5 percent of the total quantity of phosphorus
released to water bodies by all systems enclosed by the E-PRTR the minimum value is 1 and
the maximum value is 5 in Sweden.
EU
Swede
n
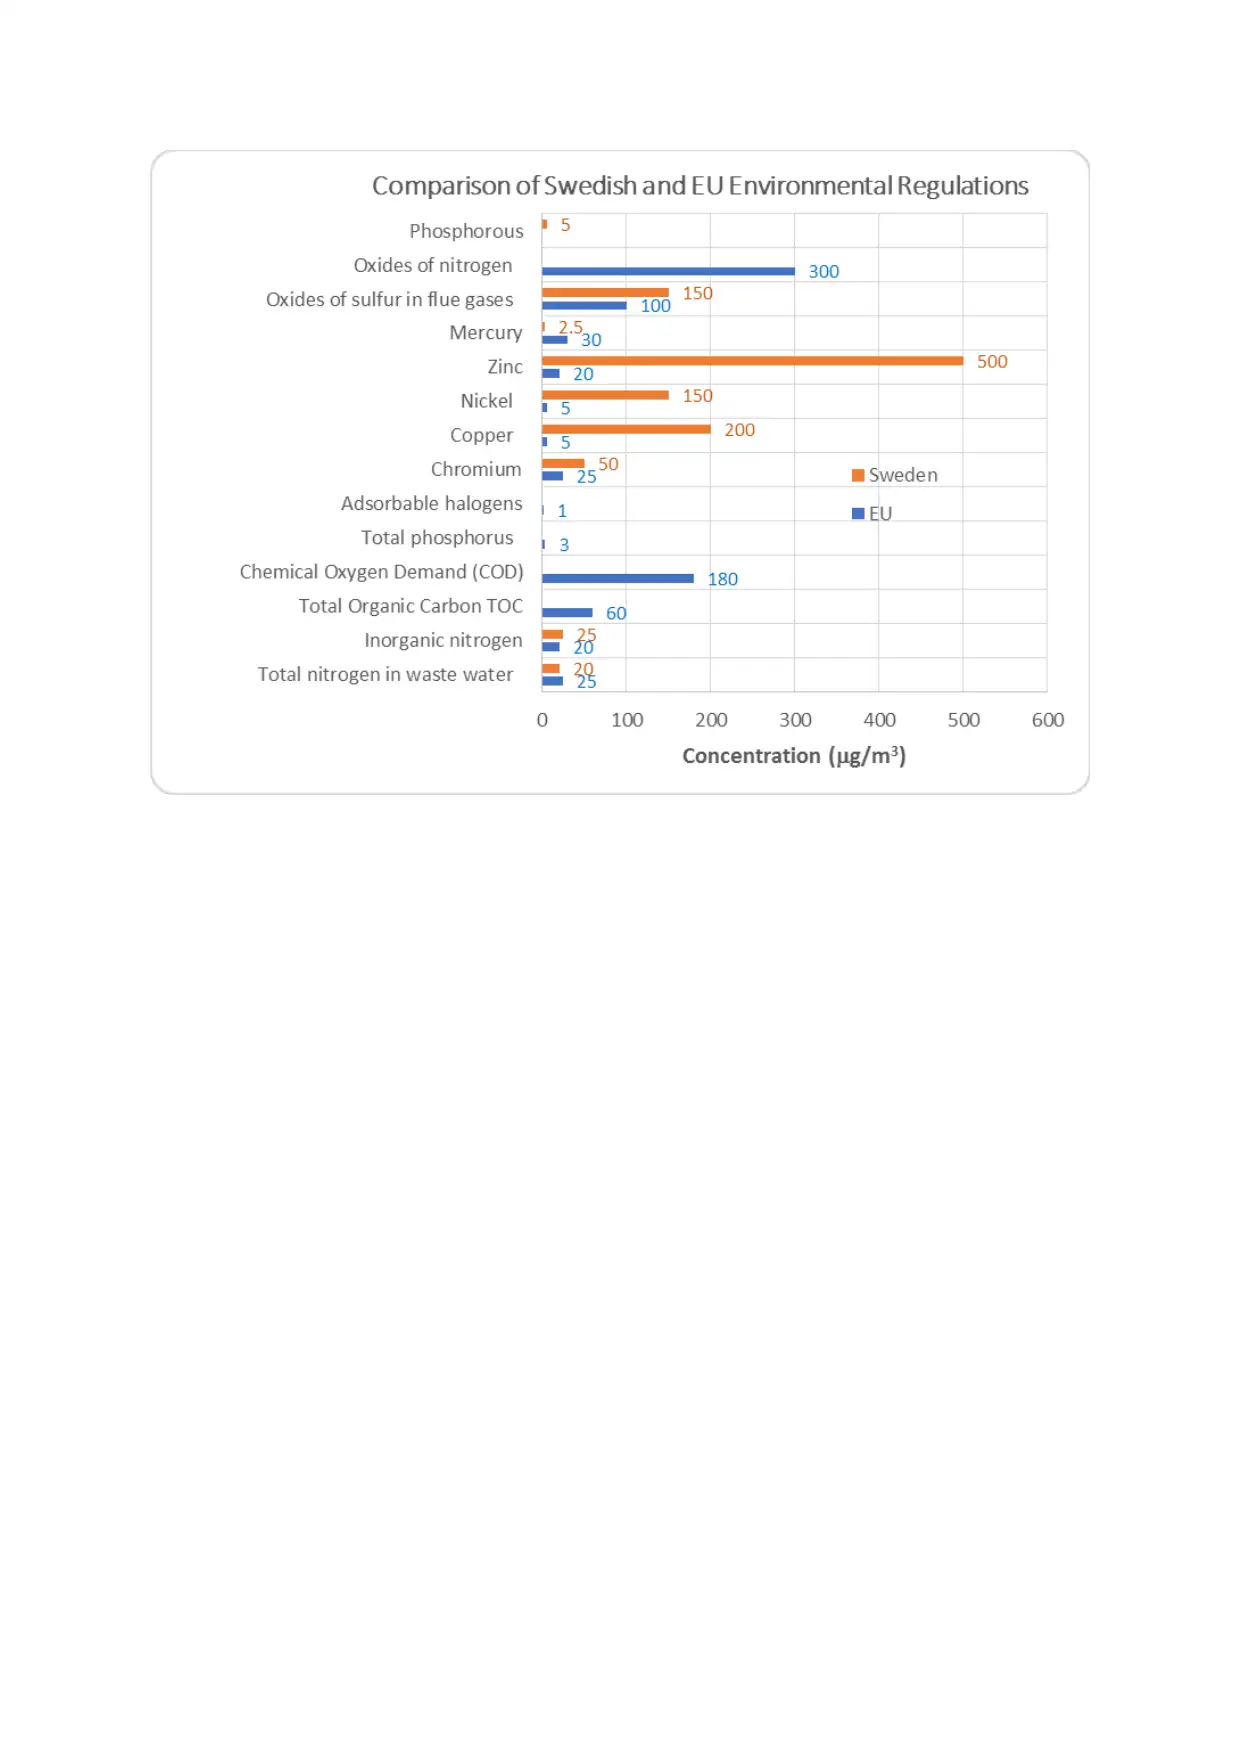
Parameters min max min max
1 Total nitrogen in waste water 5 25 2.5 20
2 Inorganic nitrogen 5 20 5 25
3 Total Organic Carbon TOC 10 60
4 Chemical Oxygen Demand (COD) 30 180
5 Total phosphorus 0.5 3
6 Adsorbable halogens 0.2 1
7 Chromium 5 25 5 50
8 Copper 5 5 50 200
9 Nickel 5 5 50 150
10 Zinc 20 20 200 500
11 Mercury 30 30 0.2 2.5
12 Oxides of sulfur in flue gases 100 100 50 150
13 Oxides of nitrogen 100 300
14 Phosphorous 1 5
is 50 and the highest value is 150.
Oxides of nitrogen
This element s is the mixtures of gases that comprised of nitrogen and oxygen. From 215
installations of the chemical companies emitted nearly 132 kt of oxides of nitrogen to the air.
That represents 5.2 percent of the total amount of nitrogen oxides emitted to the air by all the
installations (Brinkmann, Santonja, Yükseler, Roudier, & Sancho, 2016). The minimum
value of this compound is 100 and the maximum is 300 in EU.
Phosphorus
In 2010, 55 establishments of the chemical production sector released a total of 10.3 kt of
entire phosphorus to H2O, demonstrating 17.5 percent of the total quantity of phosphorus
released to water bodies by all systems enclosed by the E-PRTR the minimum value is 1 and
the maximum value is 5 in Sweden.
EU
Swede
n
Parameters min max min max
1 Total nitrogen in waste water 5 25 2.5 20
2 Inorganic nitrogen 5 20 5 25
3 Total Organic Carbon TOC 10 60
4 Chemical Oxygen Demand (COD) 30 180
5 Total phosphorus 0.5 3
6 Adsorbable halogens 0.2 1
7 Chromium 5 25 5 50
8 Copper 5 5 50 200
9 Nickel 5 5 50 150
10 Zinc 20 20 200 500
11 Mercury 30 30 0.2 2.5
12 Oxides of sulfur in flue gases 100 100 50 150
13 Oxides of nitrogen 100 300
14 Phosphorous 1 5
Paraphrase This Document
Need a fresh take? Get an instant paraphrase of this document with our AI Paraphraser
References
Almqvist, H., & Hanæus, J. (2006). Organic hazardous substances in greywater from
Swedish households. Journal of Environmental Engineering, 132(8), 901-908.
Brinkmann, T., Santonja, G. G., Yükseler, H., Roudier, S., & Sancho, L. D. (2016). Best
available techniques (BAT) reference document for common waste water and waste
gas treatment/management systems in the chemical sector. Publications Office of the
European Union.
Linderholm, K., Mattsson, J. E., & Tillman, A. M. (2012). Phosphorus flows to and from
Swedish agriculture and food chain. Ambio, 41(8), 883-893.
Ma, H., Allen, H. E., & Yin, Y. (2001). Characterization of isolated fractions of dissolved
organic matter from natural waters and wastewater effluent. Water Research, 35(4),
985-996.
Månsson, N., Sörme, L., Wahlberg, C., & Bergbäck, B. (2008). Sources of alkylphenols and
alkylphenol ethoxylates in wastewater—a substance flow analysis in Stockholm,
Sweden. Water, Air, & Soil Pollution: Focus, 8(5-6), 445-456.
Mininni, G., Blanch, A. R., Lucena, F., & Berselli, S. (2015). EU policy on sewage sludge
utilization and perspectives on new approaches of sludge management. Environmental
Science and Pollution Research, 22(10), 7361-7374.
Morling, S. (2009). Plant performance of an Sequencing Batch Reactor in Poland, operated
with high Chromium load, reaching advanced nutrient removal. Water Practice and
Technology, 4(1), wpt2009012.
Renman, A., Renman, G., Gustafsson, J. P., & Hylander, L. (2009). Metal removal by bed
filter materials used in domestic wastewater treatment. Journal of Hazardous
materials, 166(2-3), 734-739.
Sundseth, K., Pacyna, J. M., Pacyna, E. G., & Panasiuk, D. (2012). Substance flow analysis
of mercury affecting water quality in the European Union. Water, Air, & Soil
Pollution, 223(1), 429-442.
Sutton, M. A., Howard, C. M., Erisman, J. W., Billen, G., Bleeker, A., Grennfelt, P., ... &
Grizzetti, B. (Eds.). (2011). The European nitrogen assessment: sources, effects and
policy perspectives. Cambridge University Press.
Vestreng, V., Myhre, G., Fagerli, H., Reis, S., & Tarrasón, L. (2007). Twenty-five years of
continuous sulfur dioxide emission reduction in Europe. Atmospheric chemistry and
physics, 7(13), 3663-3681.
1 out of 10
Your All-in-One AI-Powered Toolkit for Academic Success.
+13062052269
info@desklib.com
Available 24*7 on WhatsApp / Email
![[object Object]](/_next/static/media/star-bottom.7253800d.svg)
Unlock your academic potential
© 2024 | Zucol Services PVT LTD | All rights reserved.