Total Protein & Albumin/Globulin (A/G) Relationship: Lab Report
VerifiedAdded on 2023/05/30
|13
|2881
|83
Report
AI Summary
This report details an experiment focused on quantifying albumin, total protein, and bilirubin levels in a patient's blood to understand the relationship between total protein concentration and albumin. The experiment involved serum protein electrophoresis and various tests using methods like Bromcresol Green Binding, Jendrassik-Grof, and Biuret. Results from control standards and patient samples were analyzed using calibration curves to determine concentrations. The discussion highlights the correlation between albumin and total protein, supported by the experimental data, while also acknowledging a statistical error. The report emphasizes the physiological importance of albumin and factors affecting its production, ultimately aiming to validate the theoretical relationship between albumin and serum protein concentrations through empirical analysis.
TOTAL PROTEIN AND ALBUMIN/GLOBULIN (A/G) RELATIONSHIP
Secure Best Marks with AI Grader
Need help grading? Try our AI Grader for instant feedback on your assignments.
AIMS
To instigate various concepts related with clinical quantification.
OBJECTIVES
1) To determine the amounts of Albumin, Total protein and Bilirubin in patient’s blood.
2) To identify the relationship between the concentration results of Albumin and Total
Protein.
3) To establish a conclusion based on the empirical analysis obtained.
ABSTRACT
Vast proteins are solubilized in the extracellular fluid. By quantifying the absorption
amounts of these plasma proteins, information concerning an ailment condition in various organ
structures can be obtained. The quantification of plasma protein is conducted on the blood fluid
which prevail after blood plasma clumping, the serum, thus eliminating vast clumping factors
and fibrinogen. Total protein amounts impart essential information pertaining a patient's
common condition. The general serum total protein amount is 6 to 8 g/dl. Albumin constitute
from 3.5 to 5.0 g/dl, and the residual include the total globulins. These amounts may differ
respective to the experimental laboratory practices . This experiment was based on a patient’s
blood sample where the above concepts for measuring the total protein, albumin and bilirubin
concentration was employed for the determination of the theoretical facet for the relationship
betwixt total protein concentration and albumin was to be affirmed. This relationship was
confirmed with a statistical insignificant error of 35% determined by the 0.05 confidence level.
INTRODUCTION
Albumin comprises of approximately 60 of the entire 100% serum protein in standard,
healthy persons. Dissimilar to vast of the various serum proteins, albumin functions several
servings that include movement of massive non-soluble organic anions (such as bilirubin),
cohere hazardous heavy metal charged atoms, moving excess amounts of almost insoluble
endocrines ( such as thyroxine), sustaining the osmotic pressure of the serum, and also,
dispensing a save accumulation for protein. Albumin statistics are utilized in the identification
and therapy of various ailments principally exhibiting the liver and kidneys.
Total bilirubin is normally accompanied by the diazonium salt, 2,5-
dichlorophenyldiazonium tetrafluoroborate (DPD) in a deeply hydrogenated medium with the
potential hydrogen 1 to 2 where the shade of the color of the synthesized substance
(azobilirubin), is directly correlating to the entire bilirubin amount and might be analyzed using
photometric instrumentation.
Serum proteins enhance various diverse essence in human body. Additionally to
exhibiting principal structural constitute of cells, they are necessitated in movement, catalysis of
enzymes, styptic management, hormonal adjustment, gore clotting, innate immunity,
development and rejuvenation. Total protein statistics are utilized in the identification and
therapy of several ailments including the kidney, liver, and skeletal marrow, in additional to
various metabolic and nutriment disarrays.
MATERIALS AND METHODS
1. Instrumentation;
(a) Hitachi 9 series analyzer; that include a tungsten-halogen radiation source, distant
computer place-station, and a printer.
(b) Sealpette Changeable-volume micro-pipets: 20, 200, and 1000 microlitre in
capacity (Cole Scientific, Moorpark, California).
(c) Pipet-support (Scientific Corporation, Drummond).
(d) Fisher hematology blender (Fisher Scientific).
2. Reagents Preparation;
A. Albumin
(a) working solution, R1: C6H8O7 buffer: 95 mmoL/L, pH 4.1; protective
(b) working solution, R2: C6H8O7 buffer: 95 mmoL/L, pH 4.1; bromcresol green: 0.66
mmoL/L;
Method of analysis utilized; Bromocresol Green Binding method was utilized upon which the
prepared samples and standards were exposed to Spectrophotometric methods (Sabnis,
2008).
B. Total Bilirubin
(a) working solution, R1: sodium acetate buffer: 85 mmoL/L; sulfamic acid: 110
mmoL/L; surfactant; solubilizer R2
(b) working solution, R2: hydrochloric acid: 100 mmoL/L; diazonium ion: 3 mmoL/L
Method of analysis utilized; Jendrassik--Grof method of analysis for total and direct
bilirubin in serum was utilized upon which the prepared samples and standards were
exposed to Spectrophotometric method, Photometry (Rolinski, Küster, Ugele, Gruber,
& Horn, 2010).
C. Total Protein
(a) working solution, R1: NaOH: 400 mmoL/L; KNaC4H4O6•4H2O: 89 mmoL/L
(b) working solution, R2: NaOH: 400 mmoL/L; KNaC4H4O6•4H2O: 89 mmoL/L; KI:
61 mmoL/L; CuSO4: 24.3 mmoL/L.
Method of analysis utilized; Biuret method of analysis for total protein in serum was
utilized upon which the prepared samples and standards were exposed to
Spectrophotometric method (Ninfa, Ballou, & Benore, 2009).
PROCEDURE
1) Preparation of Patient’s Serum Protein Electrophoresis;
A note of the patient’s blood identity, lot initial and cessation date was made. The reservoir
was prepared by placing C8H12N2O3 buffer in the two tanks. Dual wicks were then prepared
employing a Whatman standard filtration paper for the buffer from respective tanks to the
viaduct. Using a pair of forceps, the cellulose acetate garb that had been doused in C8H12N2O3
buffer were withdrawn and specked between paper cloth to detach the surplus buffer. Employing
a notable applicator, twain the patient samples and control standards were smeared to the
cellulose acetate garb roughly 0.03m from the cathode side (distinguished by a pencil). The
cellulose acetate garb was then immersed into the reservoir across the viaduct and the wicks
immersed between the buffer and the cellulose acetate garb. The flow of charge was modified to
display 2.0mA per garb with the power set made on sustained current. The strip was left to run
for 75 minutes after which the power supply was turned off. The garbs were then withdrawn
from the electrophoresis reservoir utilizing the pair of forceps and were pigmented for 7.5
minutes in Ponceau S dye made solution. The surplus dye was then separated by staining in 5%
glacial acetic. The garb was then permitted to parch between paper cloths and an account of the
markings of strands was recorded.
2) Test for Total Protein using Biuret Method;
The patient and quality control samples were run in duplicate where set up reactions was
done in tubes by mixing thoroughly the blood samples. The color was allowed to grow for 30
minutes upon which the absorbance measurement at 550nm was made. A NaCl blank was
employed to modify the spectrophotometer to the 0 mark. The calibration curve results for total
protein were then measured and recorded using 4 prepared standards.
3) Test for Albumin by Bromcresol Green Binding;
The patient and quality control solutions were run in duplicate where set up reactions was
done in tubes by mixing thoroughly the blood samples and incubated for 10 minutes after which
the absorbance measurement at 628nm was made. A saline blank was used to adjust the
spectrophotometer to 0. The calibration curve values for total protein were then measured and
recorded using 4 prepared standards.
4) Test for Bilirubin by Jendrassik & Grof method;
The patient and quality control solutions were run in duplicate where the set chemical
reactions was done in tubes by mixing thoroughly the blood samples as shown while tallying the
reagents in the order illustrated next on page;
Secure Best Marks with AI Grader
Need help grading? Try our AI Grader for instant feedback on your assignments.
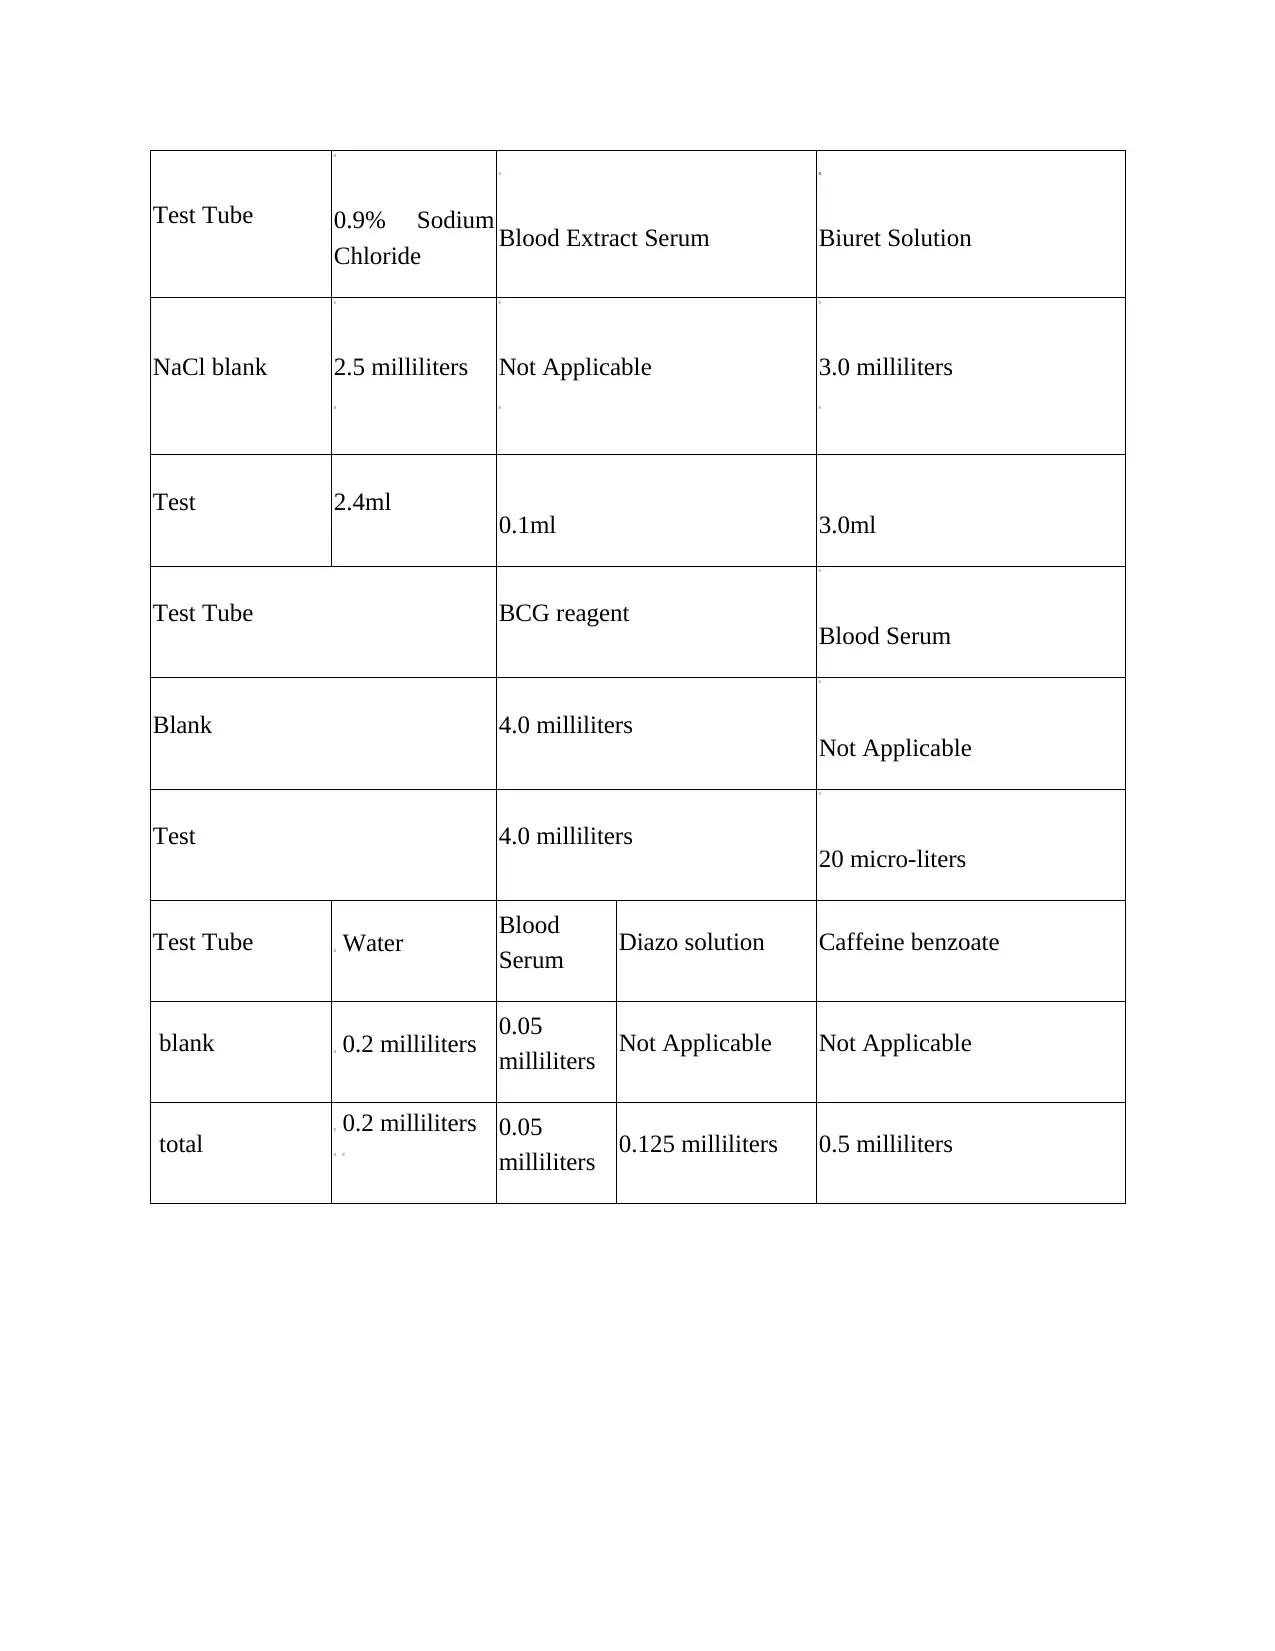
Test Tube 0.9% Sodium
Chloride Blood Extract Serum Biuret Solution
NaCl blank 2.5 milliliters Not Applicable 3.0 milliliters
Test 2.4ml 0.1ml 3.0ml
Test Tube BCG reagent Blood Serum
Blank 4.0 milliliters Not Applicable
Test 4.0 milliliters 20 micro-liters
Test Tube Water Blood
Serum Diazo solution Caffeine benzoate
blank 0.2 milliliters 0.05
milliliters Not Applicable Not Applicable
total 0.2 milliliters 0.05
milliliters 0.125 milliliters 0.5 milliliters
RESULTS
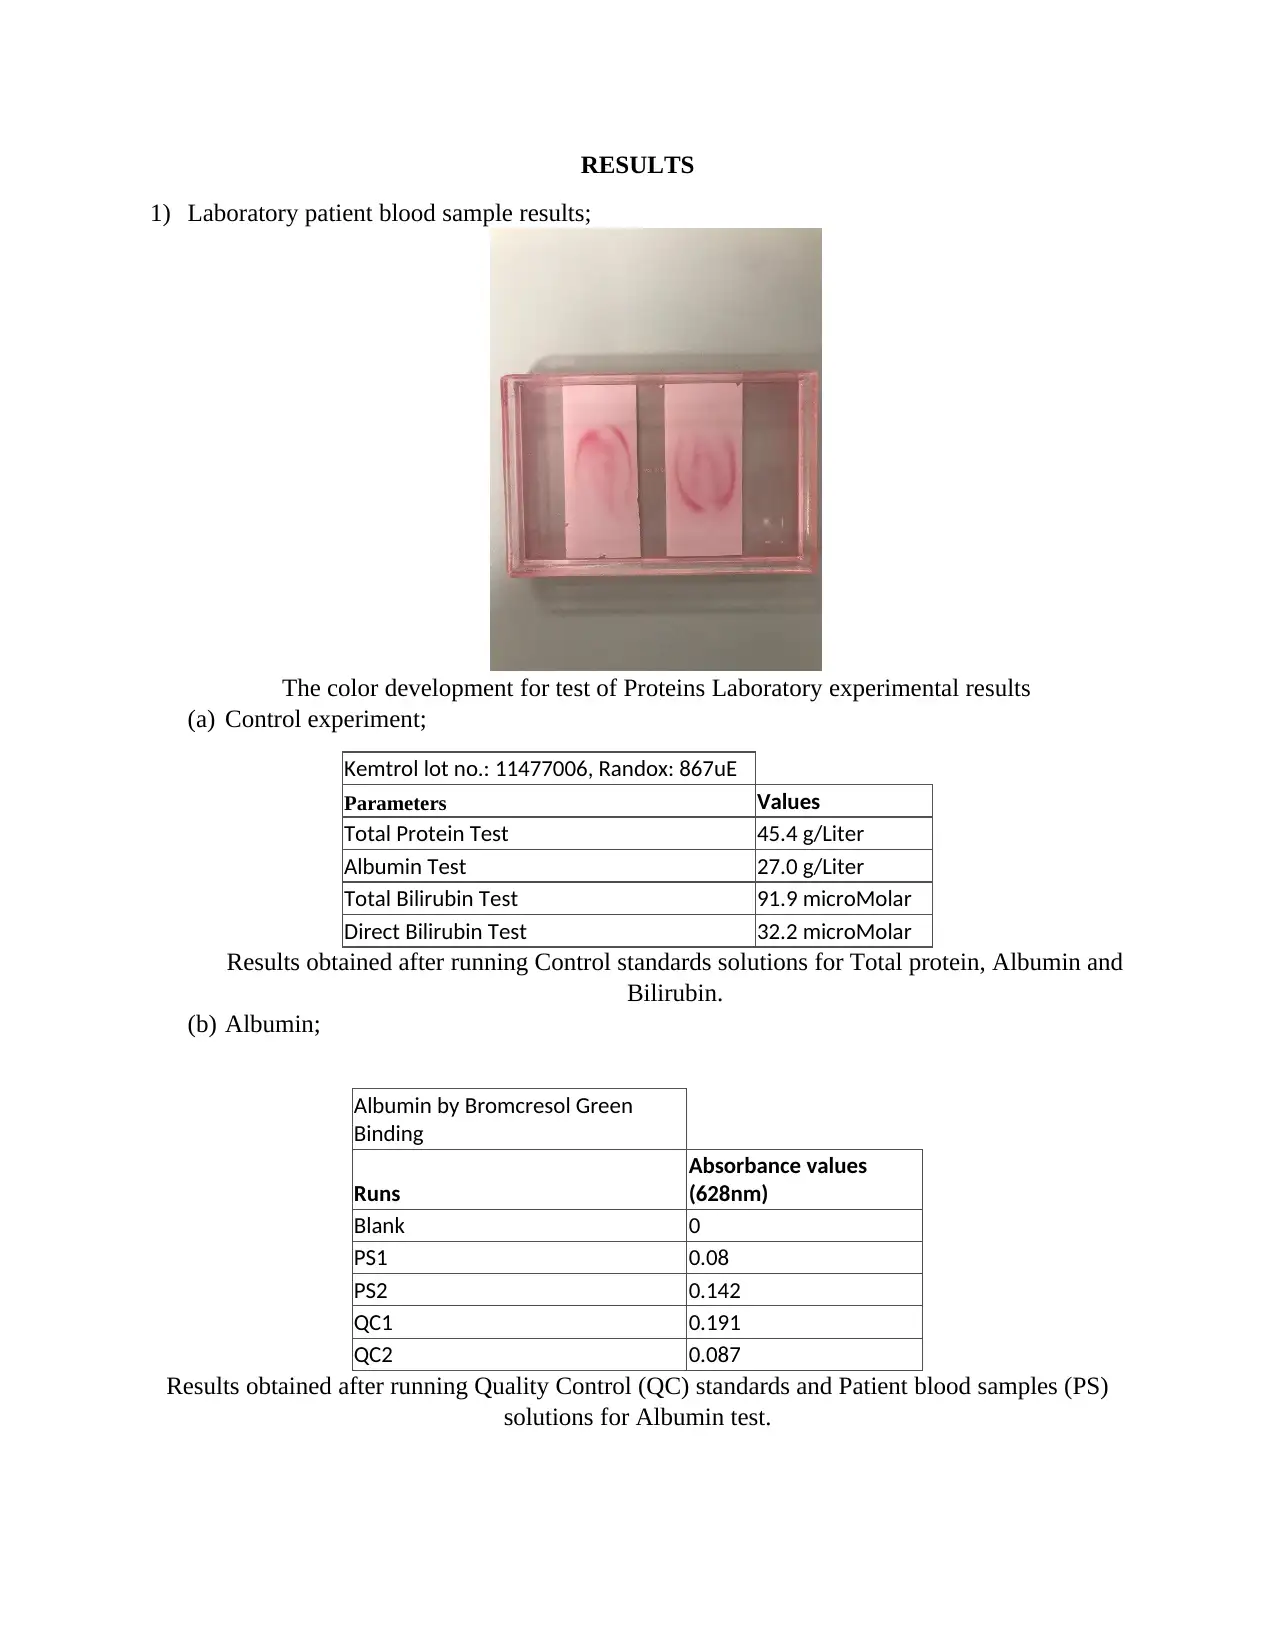
1) Laboratory patient blood sample results;
The color development for test of Proteins Laboratory experimental results
(a) Control experiment;
Kemtrol lot no.: 11477006, Randox: 867uE
Parameters Values
Total Protein Test 45.4 g/Liter
Albumin Test 27.0 g/Liter
Total Bilirubin Test 91.9 microMolar
Direct Bilirubin Test 32.2 microMolar
Results obtained after running Control standards solutions for Total protein, Albumin and
Bilirubin.
(b) Albumin;
Albumin by Bromcresol Green
Binding
Runs
Absorbance values
(628nm)
Blank 0
PS1 0.08
PS2 0.142
QC1 0.191
QC2 0.087
Results obtained after running Quality Control (QC) standards and Patient blood samples (PS)
solutions for Albumin test.
(c) For Bilirubin;
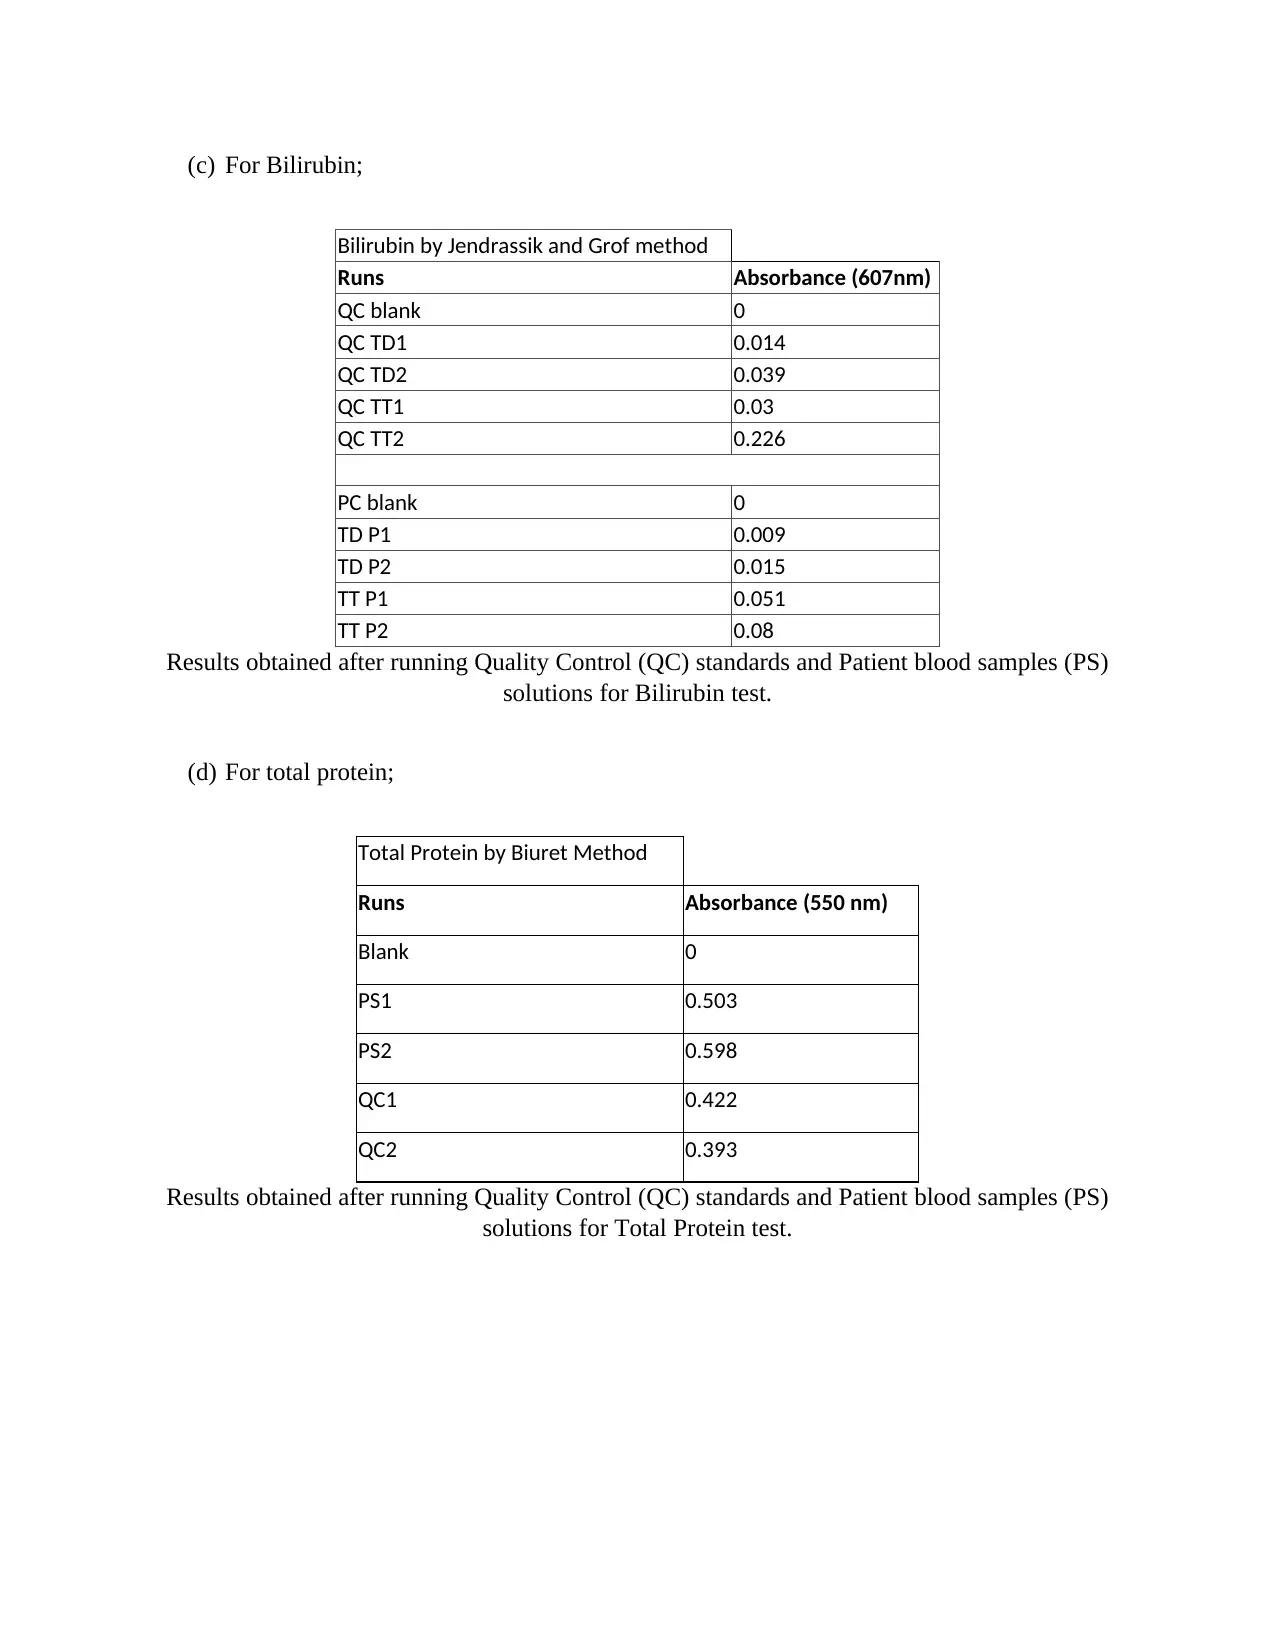
Bilirubin by Jendrassik and Grof method
Runs Absorbance (607nm)
QC blank 0
QC TD1 0.014
QC TD2 0.039
QC TT1 0.03
QC TT2 0.226
PC blank 0
TD P1 0.009
TD P2 0.015
TT P1 0.051
TT P2 0.08
Results obtained after running Quality Control (QC) standards and Patient blood samples (PS)
solutions for Bilirubin test.
(d) For total protein;
Total Protein by Biuret Method
Runs Absorbance (550 nm)
Blank 0
PS1 0.503
PS2 0.598
QC1 0.422
QC2 0.393
Results obtained after running Quality Control (QC) standards and Patient blood samples (PS)
solutions for Total Protein test.
Paraphrase This Document
Need a fresh take? Get an instant paraphrase of this document with our AI Paraphraser
2) Calibration curve results;
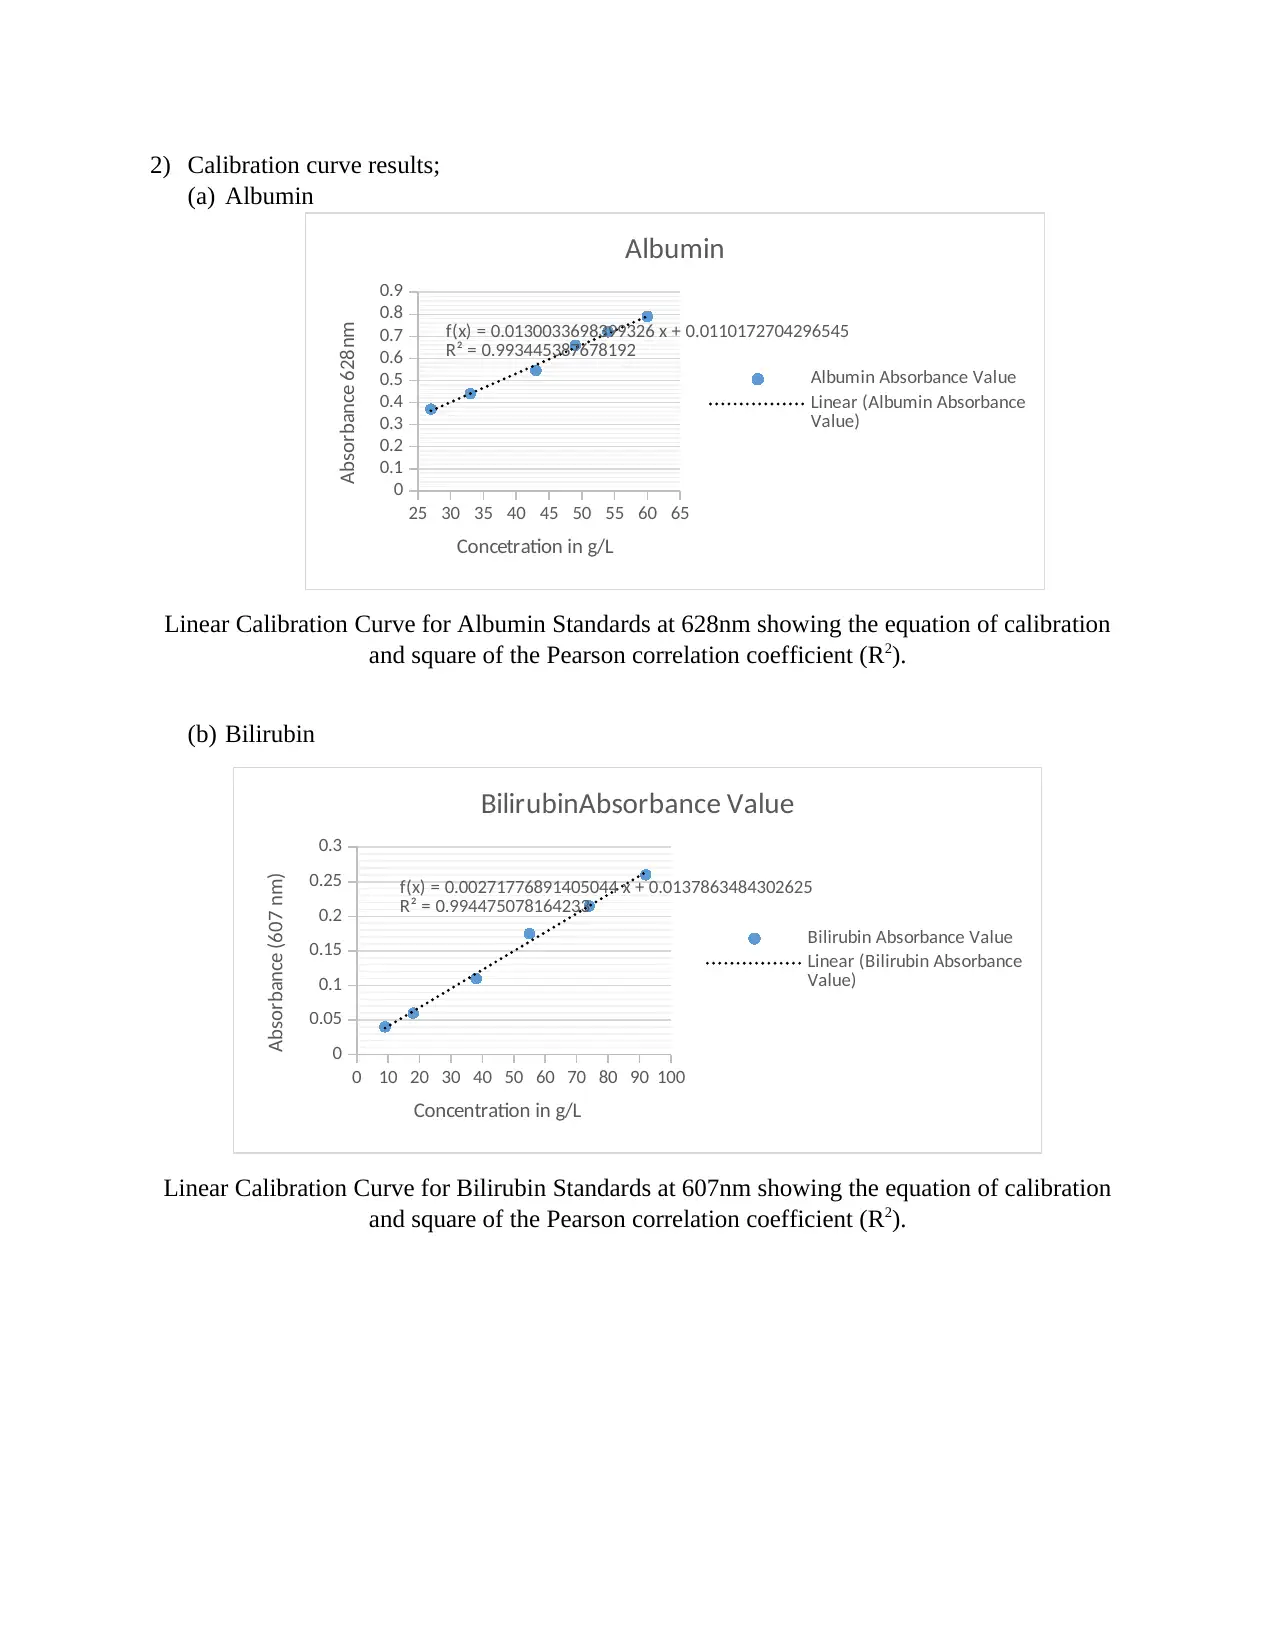
(a) Albumin
25 30 35 40 45 50 55 60 65
0
0.1
0.2
0.3
0.4
0.5
0.6
0.7
0.8
0.9
f(x) = 0.0130033698399326 x + 0.0110172704296545
R² = 0.993445387678192
Albumin
Albumin Absorbance Value
Linear (Albumin Absorbance
Value)
Concetration in g/L
Absorbance 628nm
Linear Calibration Curve for Albumin Standards at 628nm showing the equation of calibration
and square of the Pearson correlation coefficient (R2).
(b) Bilirubin
0 10 20 30 40 50 60 70 80 90 100
0
0.05
0.1
0.15
0.2
0.25
0.3
f(x) = 0.00271776891405044 x + 0.0137863484302625
R² = 0.994475078164233
BilirubinAbsorbance Value
Bilirubin Absorbance Value
Linear (Bilirubin Absorbance
Value)
Concentration in g/L
Absorbance (607 nm)
Linear Calibration Curve for Bilirubin Standards at 607nm showing the equation of calibration
and square of the Pearson correlation coefficient (R2).
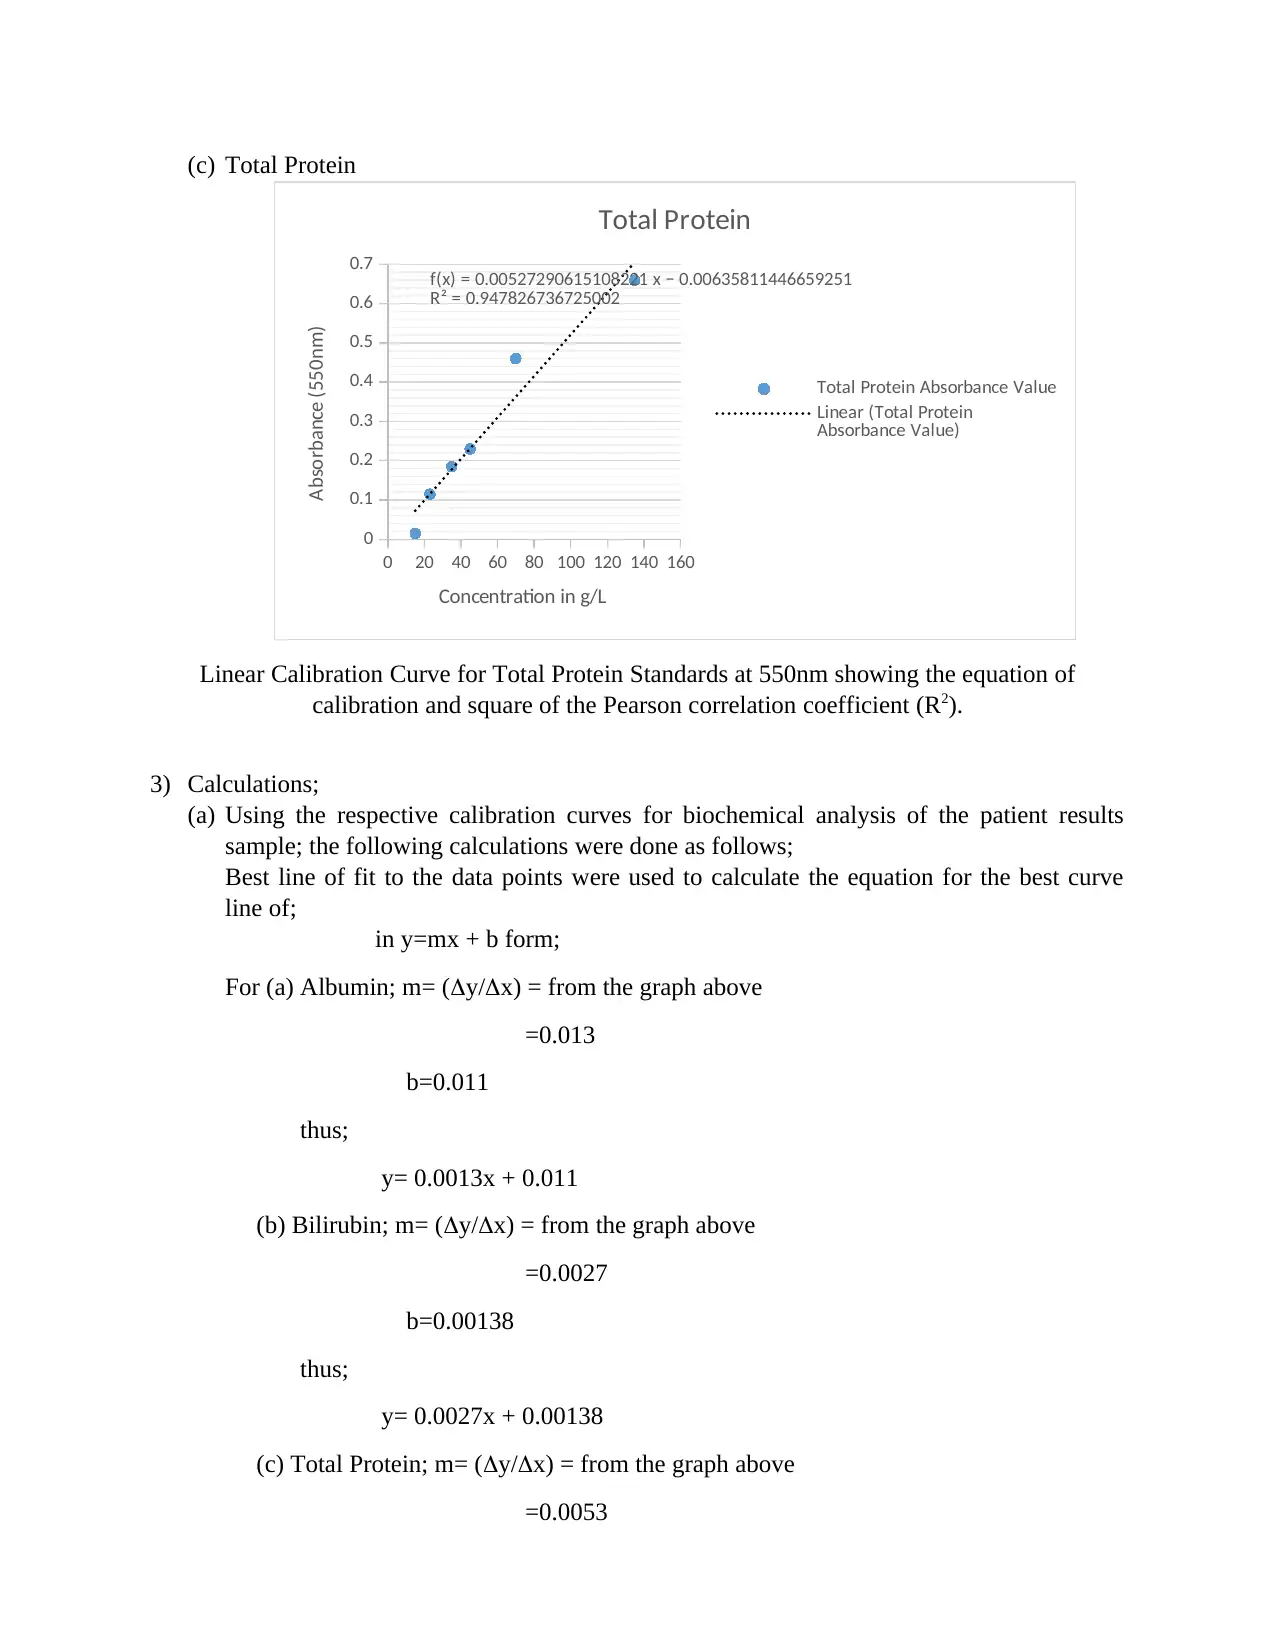
(c) Total Protein
0 20 40 60 80 100 120 140 160
0
0.1
0.2
0.3
0.4
0.5
0.6
0.7 f(x) = 0.00527290615108221 x − 0.00635811446659251
R² = 0.947826736725002
Total Protein
Total Protein Absorbance Value
Linear (Total Protein
Absorbance Value)
Concentration in g/L
Absorbance (550nm)
Linear Calibration Curve for Total Protein Standards at 550nm showing the equation of
calibration and square of the Pearson correlation coefficient (R2).
3) Calculations;
(a) Using the respective calibration curves for biochemical analysis of the patient results
sample; the following calculations were done as follows;
Best line of fit to the data points were used to calculate the equation for the best curve
line of;
in y=mx + b form;
For (a) Albumin; m= (y/x) = from the graph above
=0.013
b=0.011
thus;
y= 0.0013x + 0.011
(b) Bilirubin; m= (y/x) = from the graph above
=0.0027
b=0.00138
thus;
y= 0.0027x + 0.00138
(c) Total Protein; m= (y/x) = from the graph above
=0.0053
b=0.0064
thus;
y= 0.0053x + 0.0064
By subtracting the y-intercept from the absorbance and dividing by the slope,
concentration of your sample is thus determined by;
(a) For albumin; mean of patient sample; (0.080+0.192)/2= 0.136=y
y=0.136
m=0.013
b=0.011
x=(0.136-0.011)/0.013
= 9.62 g/L
(b) For Bilirubin; mean of patient sample; (0.009+0.015)/2= 0.012=y
(0.051+0.082)/2=0.0665=y
y=0.012 (T.D), 0.067 (T.T)
m=0.0027
b=0.00138
x=(0.012-0.00138)/0.0027 =(0.067-0.00138)/0.0027
= 3.93 g/L =24.30g/L
(c) For total protein; mean of patient sample; (0.503+0.598)/2= 0.551=y
y=0.551
m=0.0053
b=0.0064
x=(0.551-0.0064)/0.0053
= 10.27 g/L
DISCUSSION
The calibration lines of fit curves of the bromcresol green test and Biuret test methods for
Albumin and protein correspondingly, in liberate state illustrates the contrast betwixt the curves
is maximal at 628 and 540 nm. Analysis based on the calculations done in the results section for
total protein-containing patient sample proves with at least 99% the theoretical concept of
albumin-serum protein relationship of 60%, where 0.0012 is 60% of the experimental total
protein whereas the amount got in Albumin was at an error of 35% (0.00162 g/L) (Chan M,
Secure Best Marks with AI Grader
Need help grading? Try our AI Grader for instant feedback on your assignments.
2012). It was noticed that the molar absorbance values for albumin at 628 nm were decreasing
within a given range (0.192-0.080). Indicating the diminishing absorbance of a bromcresol green
solution method resulted from amalgamation with human albumin cannot exceed about 33% of
the total.
Albumin exhibit essential physiologic functions. It enhances COP, incorporates in drug
metabolism, and is essential for therapeutic purposes (Farrugia, 2010). Toxic substances in the
human anatomy may be detoxified or immobilized via albumin binding. Modestly, 30% to 40%
of entire human anatomy albumin is condensed in the Serum while the remaining 60% to 70% is
in the humor and liminal rooms of the muscle and spleen. This albumin is constantly sent back to
structural circulation into the vena cava (Aparicio M, 2012). Sufficient dissemination of
nutriment and nitrogen are important to enable albumin production. Insufficient inlet of amino
acids derivable for protein production and/or insufficient nutriment absorption by the
gastroenteric lumen as a consequence of an ailment can reduce the liver's efficiency to produce
albumin. Consequently, the human anatomy sustains serum albumin extents at the cost of thew
protein (Ascenzi, Leboffe, Toti, Polticelli, & Trezza, 2018). Most patients get these low
concentrations of Albumin due to of this concept. The subordinate hyperparathyroidism
prompted by the reduced protein meal is associated with a decrease in intestinal calcium intake
(as analyzed by twine steady calcium isotopes). The prolonged-term effects of this reduced
protein–prompted alterations in calcium metabolism are in singularity, but they could be harmful
to human health. Various apparent epidemiological researches explain decreased skeletal density
and elevated rates of skeletal diminish in persons habitually ingesting reduced protein meals
(Davey NE, 2012). Thus, more research is essential to the determination of whether reduced
protein ingestion immediately effects rates of skeletal resorption, skeletal development or both so
as to accurately attribute the cause-relation with the albumin-total protein association.
CONCLUSION
From the above discussion and analysis of the laboratory results, it is with confidence that I
report the theoretical concept of albumin-total protein relationship was affirmed and thus reflects
the status of patients low concentrations of albumin due to inadequate nutriment absorption in
the intestinal lumen. This proves that the albumin-total protein relationship/ratio can be used in
the diagnosis of liver failure since it is attributed to the function of albumin production/synthesis.
REFERENCES
Aparicio M, B. V. (2012). Keto Acid Therapy in Predialysis Chronic Kidney Disease Patients. Final
Consensus, 1-21.
Ascenzi, P., Leboffe, L., Toti, D., Polticelli, F., & Trezza, V. (2018). Fipronil recognition by the FA1 site of
human serum albumin. Journal of Molecular Recognition volume 2, 4-15.
Chan M, K. J. (2012). Malnutrition (Subjective Global Assessment) Scores and Serum Albumin Levels, but
not Body Mass Index Values, at Initiation of Dialysis are Independent Predictors of Mortality:. A
10-Year Clinical Cohort Study. , 547-557.
Davey NE, V. R. (2012). Attributes of short linear motifs. Molecular BioSystems, 323-335.
Farrugia, A. (2010). Albumin Usage in Clinical Medicine: Tradition or Therapeutic. Transfusion Medicine
Reviews volume 2, 53-63.
Ninfa, A., Ballou, D., & Benore, M. (2009). Fundamental Laboratory Approaches for Biochemistry and
Biotechnology. New Jersey: Wiley. p.
Rolinski, B., Küster, H., Ugele, B., Gruber, R., & Horn, K. (2010). Total Bilirubin Measurement by
Photometry on a Blood Gas Analyzer: Potential for Use in Neonatal Testing at the Point of Care.
Clinical Chemistry, volume 11845-9.
Sabnis, R. W. (2008). Handbook of Acid-Base Indicators. Boca Raton, Florida: CRC Press.
1 out of 13
Your All-in-One AI-Powered Toolkit for Academic Success.
+13062052269
info@desklib.com
Available 24*7 on WhatsApp / Email
![[object Object]](/_next/static/media/star-bottom.7253800d.svg)
Unlock your academic potential
© 2024 | Zucol Services PVT LTD | All rights reserved.