Critical Analysis: Toyota's Data Collection and Evaluation Tools
VerifiedAdded on 2023/06/12
|14
|4030
|186
Essay
AI Summary
This essay delves into Toyota's data collection and evaluation tools, highlighting their significance in the company's marketing strategies. It addresses Toyota's challenges, including the "Toyota catastrophe," and emphasizes the importance of data gathering and evaluation in overcoming such issues. The paper examines various data collection techniques and tools, particularly the Initial Quality Study (IQS), and their role in assessing customer opinions and improving vehicle quality. It also discusses how data changes can impact process flowcharts and the necessity of standardized data collection before implementing alterations. Furthermore, the essay explores Toyota's marketing strategies, including the use of questionnaires and interviews to understand customer preferences and brand recognition. The analysis includes a problem statement addressing cost reduction measures and their potential impact on vehicle production and employee morale. Ultimately, the essay provides a comprehensive overview of Toyota's approach to data collection and evaluation and its implications for marketing effectiveness and customer satisfaction.
Toyota Collection Of Data And Evaluation Tools 1
TOYOTA COLLECTION OF DATA AND EVALUATION TOOLS
Student's Name
Course
Professor's Name
Institution
Location of Institution
Date
TOYOTA COLLECTION OF DATA AND EVALUATION TOOLS
Student's Name
Course
Professor's Name
Institution
Location of Institution
Date
Paraphrase This Document
Need a fresh take? Get an instant paraphrase of this document with our AI Paraphraser
Toyota Collection Of Data And Evaluation Tools 2
Abstract
According to Bhandari (2007) Suggests that data gathering and evaluation is
significant in Toyota business. Toyota firm has met problems called Toyota” catastrophe”.
The study highlights data gathering and evaluation. The problem of value standards proposals
difficulties will be stated in the paper. The paperwork will outline the results and the firm’s
approval and also return that is experienced.
Introduction
Toyota firm has tried to produce best vehicles for many people all over the world.
The value of the vehicles means the production of cars with many preferences and flawless
quality to many customers. This is the belief of the Toyota firm. Toyota was a worldwide
leader in the vehicle industry while at similar time problems hit firms like torn of blinks
(Crouch and Pearce 2013).
Data collection techniques and tools.
Data methods and gathering tools plays a crucial role in the course of plan
advancement. It’s important to gather essential information and asses key points. It is
essential to recognise the value and measurable length of how Toyota Company will have to
improve their communication an on how to improve proper relationship with its dealers in
order to have the appropriate market of its product. One must find a quantifiable to get the
outcomes because it depends on value and quantity change over a given time. The common
tool that is used in vehicle industry and is an amount evaluation . IQS tool is used many
times to regulate quantifiable annals as well as track the operator opinions. This tool thus can
be used as well in Toyota Company (Ellis, 2006, pp.171-212).
Data improve, sustenance or flowchart change
When any firm is using data for a process flowchart the data may change which later
impacts the flowchart course which means flowchart changes. The vital thing is to get
standard data before making any deviation and ensure worth control test measures have been
implemented. Because Toyota is meant to select a process to improve their duty that's why
there is a need to collect standard data before making any alteration in the group. By use of
IQS study, the results got can provide control and also or those who make decisions can give
the information that can help to improve the worthiness and safety concerns for customers.
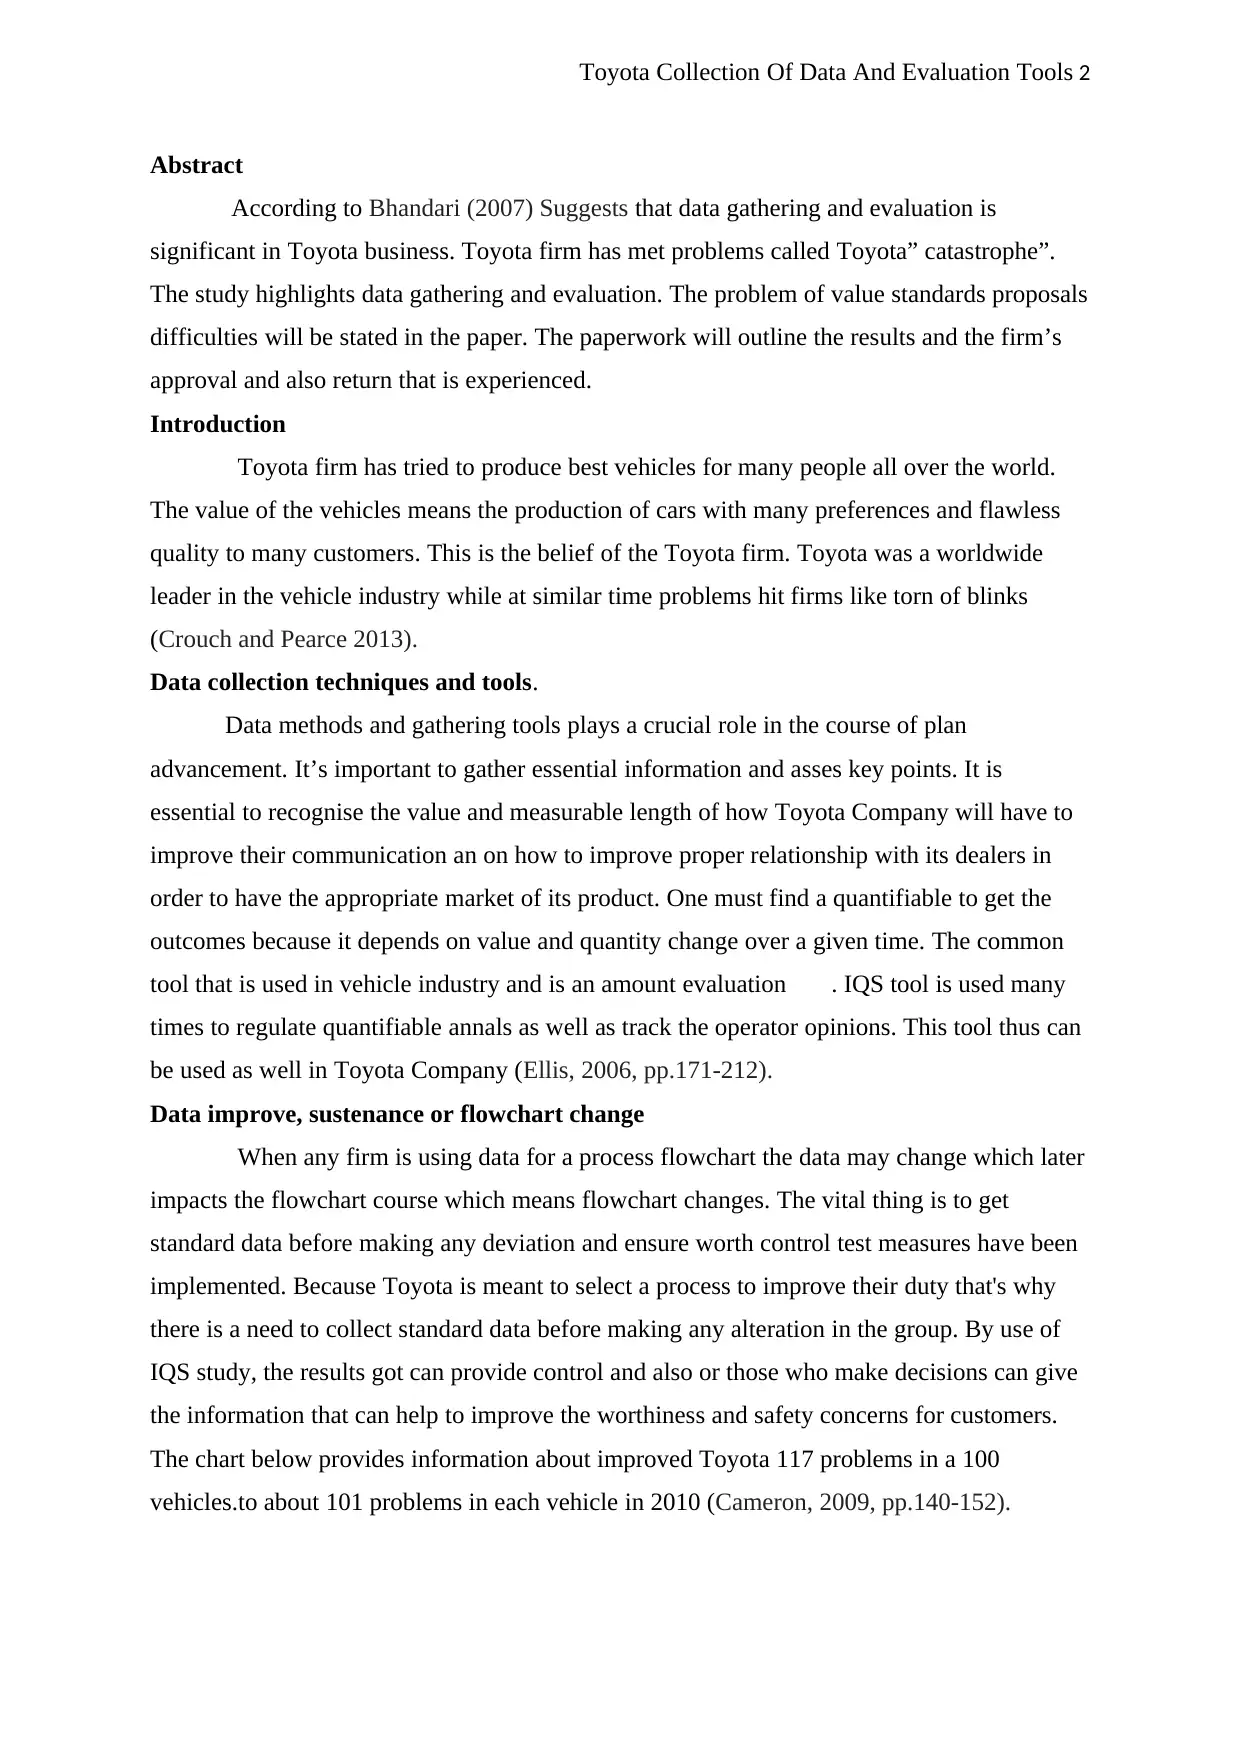
The chart below provides information about improved Toyota 117 problems in a 100
vehicles.to about 101 problems in each vehicle in 2010 (Cameron, 2009, pp.140-152).
Abstract
According to Bhandari (2007) Suggests that data gathering and evaluation is
significant in Toyota business. Toyota firm has met problems called Toyota” catastrophe”.
The study highlights data gathering and evaluation. The problem of value standards proposals
difficulties will be stated in the paper. The paperwork will outline the results and the firm’s
approval and also return that is experienced.
Introduction
Toyota firm has tried to produce best vehicles for many people all over the world.
The value of the vehicles means the production of cars with many preferences and flawless
quality to many customers. This is the belief of the Toyota firm. Toyota was a worldwide
leader in the vehicle industry while at similar time problems hit firms like torn of blinks
(Crouch and Pearce 2013).
Data collection techniques and tools.
Data methods and gathering tools plays a crucial role in the course of plan
advancement. It’s important to gather essential information and asses key points. It is
essential to recognise the value and measurable length of how Toyota Company will have to
improve their communication an on how to improve proper relationship with its dealers in
order to have the appropriate market of its product. One must find a quantifiable to get the
outcomes because it depends on value and quantity change over a given time. The common
tool that is used in vehicle industry and is an amount evaluation . IQS tool is used many
times to regulate quantifiable annals as well as track the operator opinions. This tool thus can
be used as well in Toyota Company (Ellis, 2006, pp.171-212).
Data improve, sustenance or flowchart change
When any firm is using data for a process flowchart the data may change which later
impacts the flowchart course which means flowchart changes. The vital thing is to get
standard data before making any deviation and ensure worth control test measures have been
implemented. Because Toyota is meant to select a process to improve their duty that's why
there is a need to collect standard data before making any alteration in the group. By use of
IQS study, the results got can provide control and also or those who make decisions can give
the information that can help to improve the worthiness and safety concerns for customers.
The chart below provides information about improved Toyota 117 problems in a 100
vehicles.to about 101 problems in each vehicle in 2010 (Cameron, 2009, pp.140-152).
Toyota Collection Of Data And Evaluation Tools 3
The data will provide a flow chart indicating that the new process is working. The
reason and the resulting diagram provides a possible root related to worth and safety, matter
in areas such as systems, communication, policies, machinery, people, and beliefs. The
diagram indicates a poor external message to public and poor public relationship that has led
to bad status for Toyota in this situation. The standard data changes band the resulting
flowchart for a needed outcome. Conclusions are made to improve the procedure and later
change problem and issues. IQS chart above indicates that when the vehicle and driver
compared cars from 2010 to 2011, there is an improvement from 117 problems in a given 100
cars to101 difficulties in a vehicle in 2011 (Scott 2015).
⊘ This is a preview!⊘
Do you want full access?
Subscribe today to unlock all pages.
Trusted by 1+ million students worldwide
Toyota Collection Of Data And Evaluation Tools 4
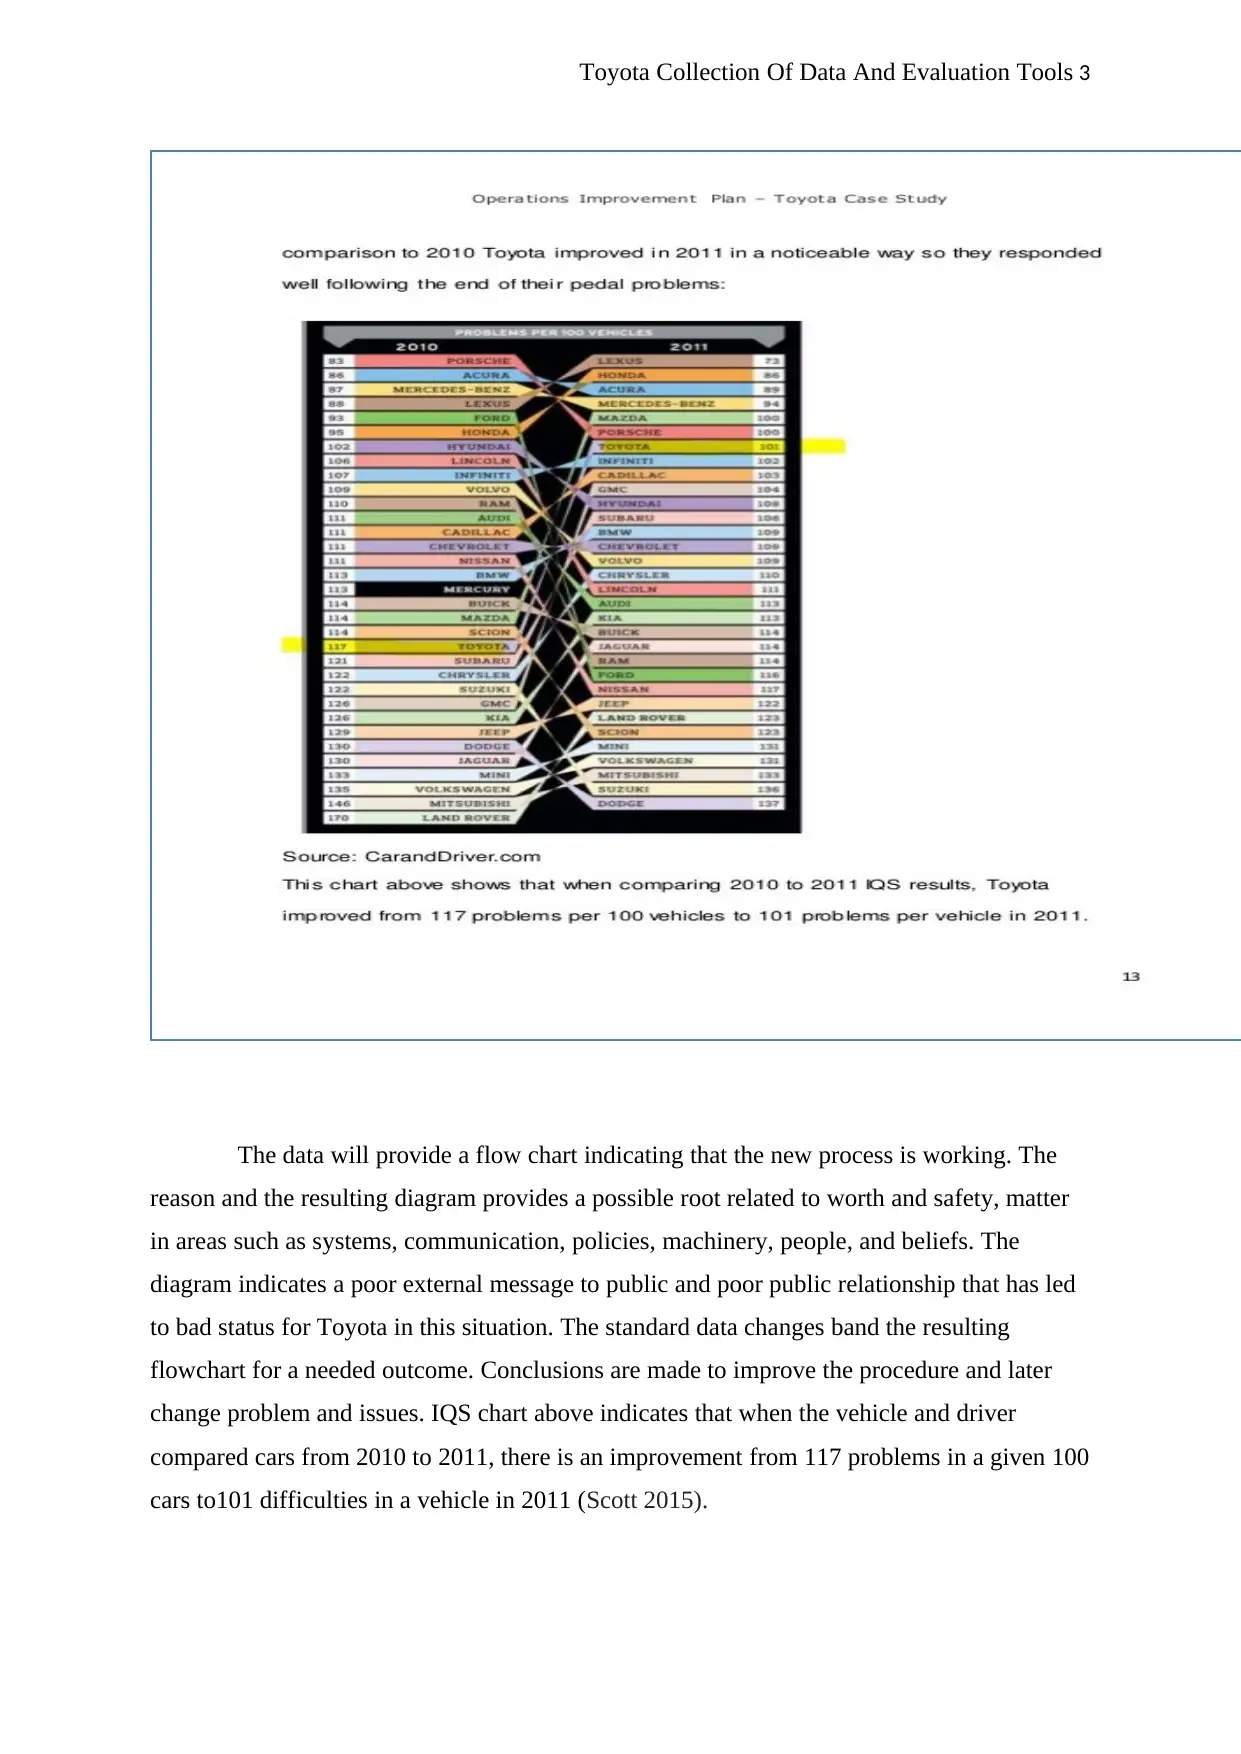
Initial Quality Study: Car Ratings
The top models in each segment are listed. Click on the image or model name to read its
2012 Cars.com report.
Category Best in Category Other Top Picks
Best Subcompact
Toyota Yaris
Honda Fit
Mazda Mazda2
Best Compact
Toyota Corolla
Toyota Prius
Honda Civic
Best Compact Sport
Mazda MX-5
Miata
Volkswagen Eos
Best Luxury Compact
Sport Volvo C70
Mercedes-Benz E-Class
Cabriolet/Coupe
Best Midsize Sport
Ford Mustang
Dodge Challenger
Best Entry Luxury
Lexus ES 350
Acura TL
Lincoln MKZ
Best Midsize Luxury
Infiniti M
Series
Lincoln MKS
Mercedes-Benz E-Class
(sedan/wagon)
Best Full-Size Luxury
Lexus LS
Mercedes-Benz S-Class
Porsche Panamera
In the year 2012 J.D. Powers together with associates produced its 2012first quality study.
The diagram above displays the results. It shows the best subcompact Toyota Yaris, best
compact Toyota Corolla, and Best Luxury Lexus LS and Lexus ES 350.
Paraphrase This Document
Need a fresh take? Get an instant paraphrase of this document with our AI Paraphraser
Toyota Collection Of Data And Evaluation Tools 5
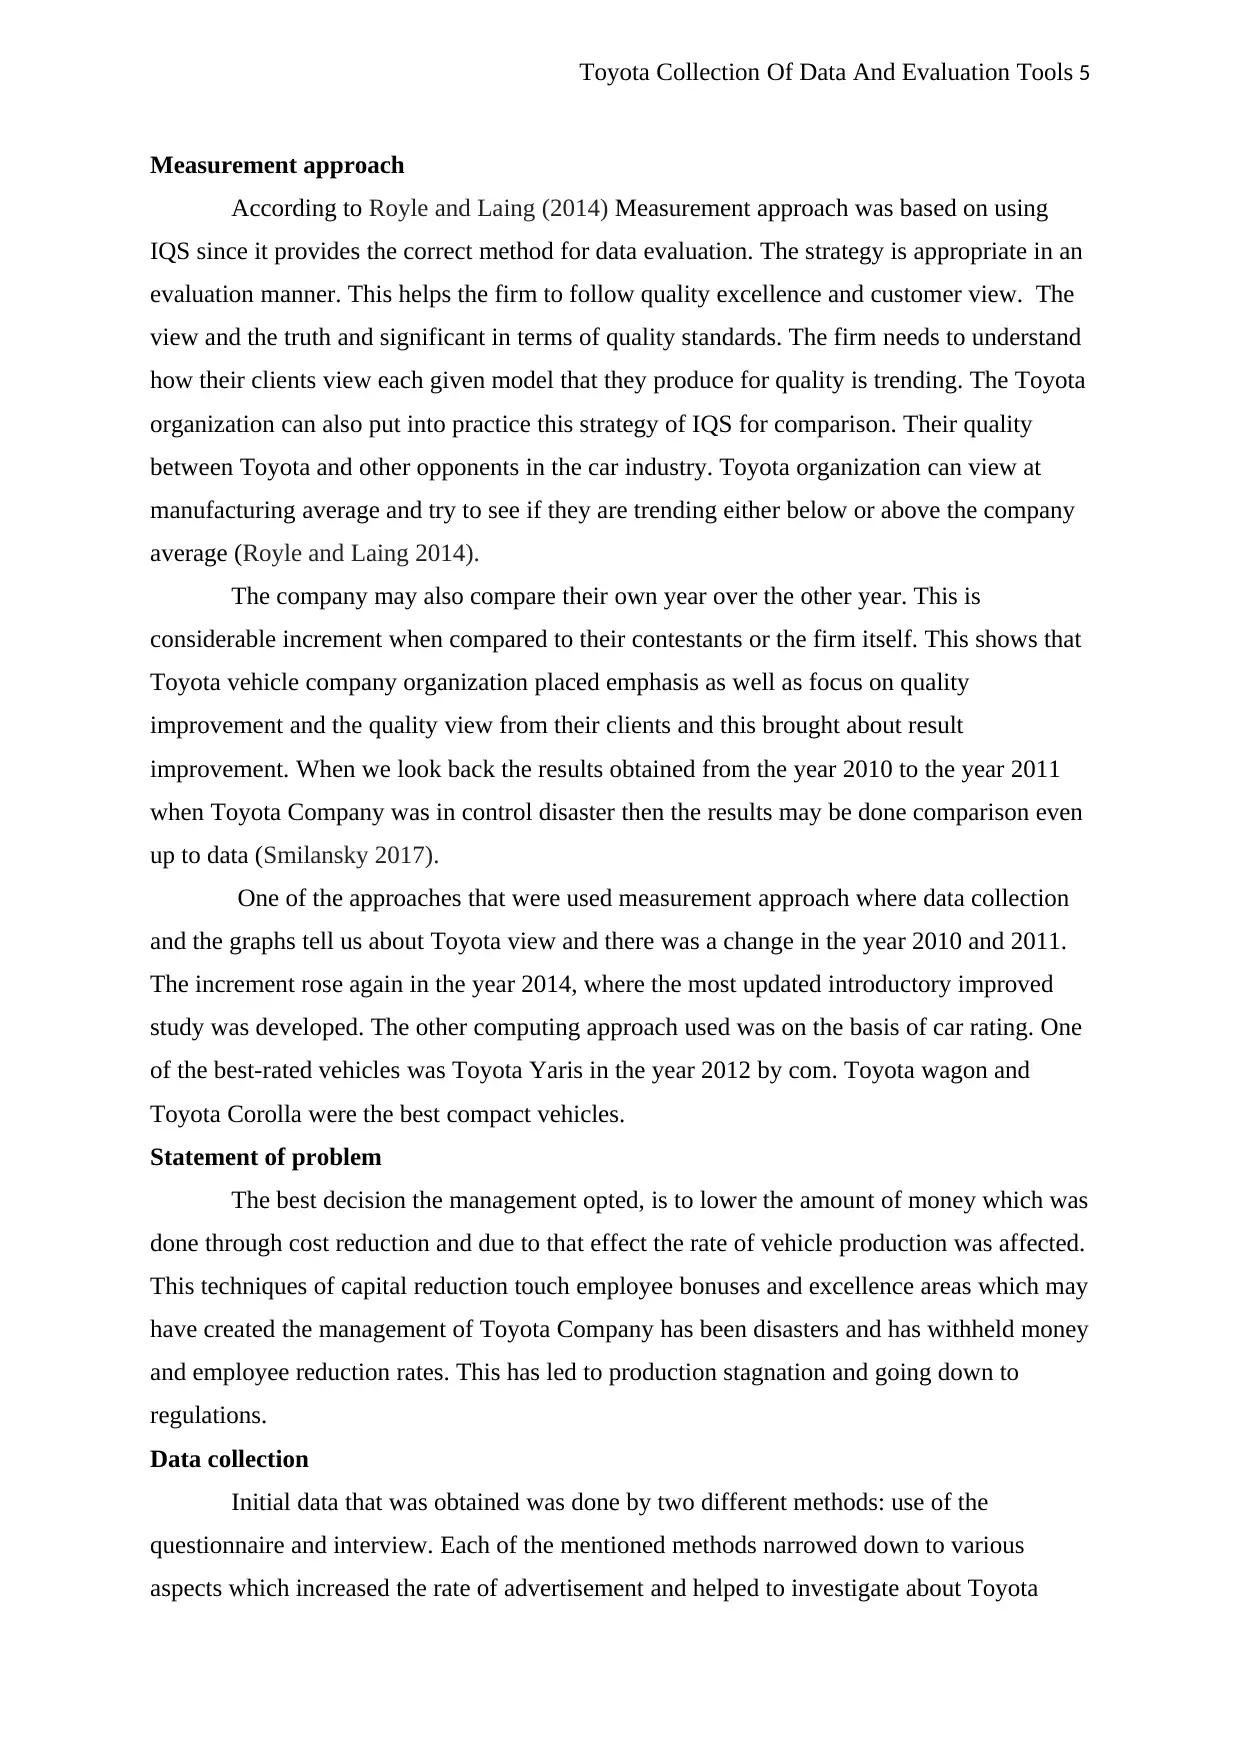
Measurement approach
According to Royle and Laing (2014) Measurement approach was based on using
IQS since it provides the correct method for data evaluation. The strategy is appropriate in an
evaluation manner. This helps the firm to follow quality excellence and customer view. The
view and the truth and significant in terms of quality standards. The firm needs to understand
how their clients view each given model that they produce for quality is trending. The Toyota
organization can also put into practice this strategy of IQS for comparison. Their quality
between Toyota and other opponents in the car industry. Toyota organization can view at
manufacturing average and try to see if they are trending either below or above the company
average (Royle and Laing 2014).
The company may also compare their own year over the other year. This is
considerable increment when compared to their contestants or the firm itself. This shows that
Toyota vehicle company organization placed emphasis as well as focus on quality
improvement and the quality view from their clients and this brought about result
improvement. When we look back the results obtained from the year 2010 to the year 2011
when Toyota Company was in control disaster then the results may be done comparison even
up to data (Smilansky 2017).
One of the approaches that were used measurement approach where data collection
and the graphs tell us about Toyota view and there was a change in the year 2010 and 2011.
The increment rose again in the year 2014, where the most updated introductory improved
study was developed. The other computing approach used was on the basis of car rating. One
of the best-rated vehicles was Toyota Yaris in the year 2012 by com. Toyota wagon and
Toyota Corolla were the best compact vehicles.
Statement of problem
The best decision the management opted, is to lower the amount of money which was
done through cost reduction and due to that effect the rate of vehicle production was affected.
This techniques of capital reduction touch employee bonuses and excellence areas which may
have created the management of Toyota Company has been disasters and has withheld money
and employee reduction rates. This has led to production stagnation and going down to
regulations.
Data collection
Initial data that was obtained was done by two different methods: use of the
questionnaire and interview. Each of the mentioned methods narrowed down to various
aspects which increased the rate of advertisement and helped to investigate about Toyota
Toyota Collection Of Data And Evaluation Tools 6
Company. Data collection gives a detailed information about how the company thrills and
this helps to know the loop holes in the firm.
Interview
The interview aimed at understanding Toyota marketing strategy as well as their
communication techniques as wee as the change of networks in a period of time. When the
question was asked about the Toyota marketing tactic the answer that was given was that
Toyota Company doesn't always depend on association marketing. This is due to the fact that
they trust their marketing plan always reflect on their mission which is always to provide the
best client experience and trades support. For Toyota to develop products that will avail to
their client's satisfaction then they have to develop best client experience, understand their
client needs and also support. They also trust themselves that the best products always
markets itself.
The advertisement using billboards is also the best way. Toyota marketing budget
was also low compared to other automobile marketing budget for the reason is Toyota relies
on this to sell their products. Toyota is well known in the Middle East as well as GCC. When
asked about the most proficient marketing found in Saudi it was found that it was through the
use of billboards which are well spread inroads in big and small cities in order to capture
clients attention with the latest model vehicles (Tanwani 2016).
The direct conversation was done which took advantage of body language
conversation of the interviewee which gave the interviewer more indication that could be put
by use of the word of mouth. An interview is a tool that is used to collect primary data.
Secondary data is always found in written sources and also on the internet but easily
found as it contains a lot of details. Ancient and modern information is got from the
secondary data. There are other internet sources that are used to gather Toyotas company
information and they include Toyota global.com CBC.ca an also the use of Facebook
(Tanwani 2016).
Questionnaire
Questionnaire as a primary method of data collection was used to get individual data
where members were to be straight about gender as well as their age number. It entailed
information about whether they own vehicles.
Questionnaire design
The questionnaire was made of four major parts which were very crucial, the
personal information is the first part in and consists of three questions which state the sex,
⊘ This is a preview!⊘
Do you want full access?
Subscribe today to unlock all pages.
Trusted by 1+ million students worldwide
Toyota Collection Of Data And Evaluation Tools 7
age group and the last part that states whether an individual owns a vehicle or not. Part two
(2) known as the brand recognition and contains the picture with Toyota logo and some few
questions after it. The two questions after the logo tell how one is familiar with the logo and
if the present communication strategy is making any change or not.
The third part (part 3 contains two important questions and tell whether the Toyota
company has reached its goals and this can be found in the client's thoughts. The very last
part of it, the part four labelled as Toyota and this section tries to measure the how
mindfulness of the company and this affects the decision of buying Toyota car or not buying.
The questionnaire produced is made as short as possible so that many respondents may be
reached. Many people will avoid filling survey when it contains many open-ended questions
and that's why the questionnaires were made short as possible. The questionnaire contains
seven open-ended question to see peoples interest to purchase Toyota car or to describe
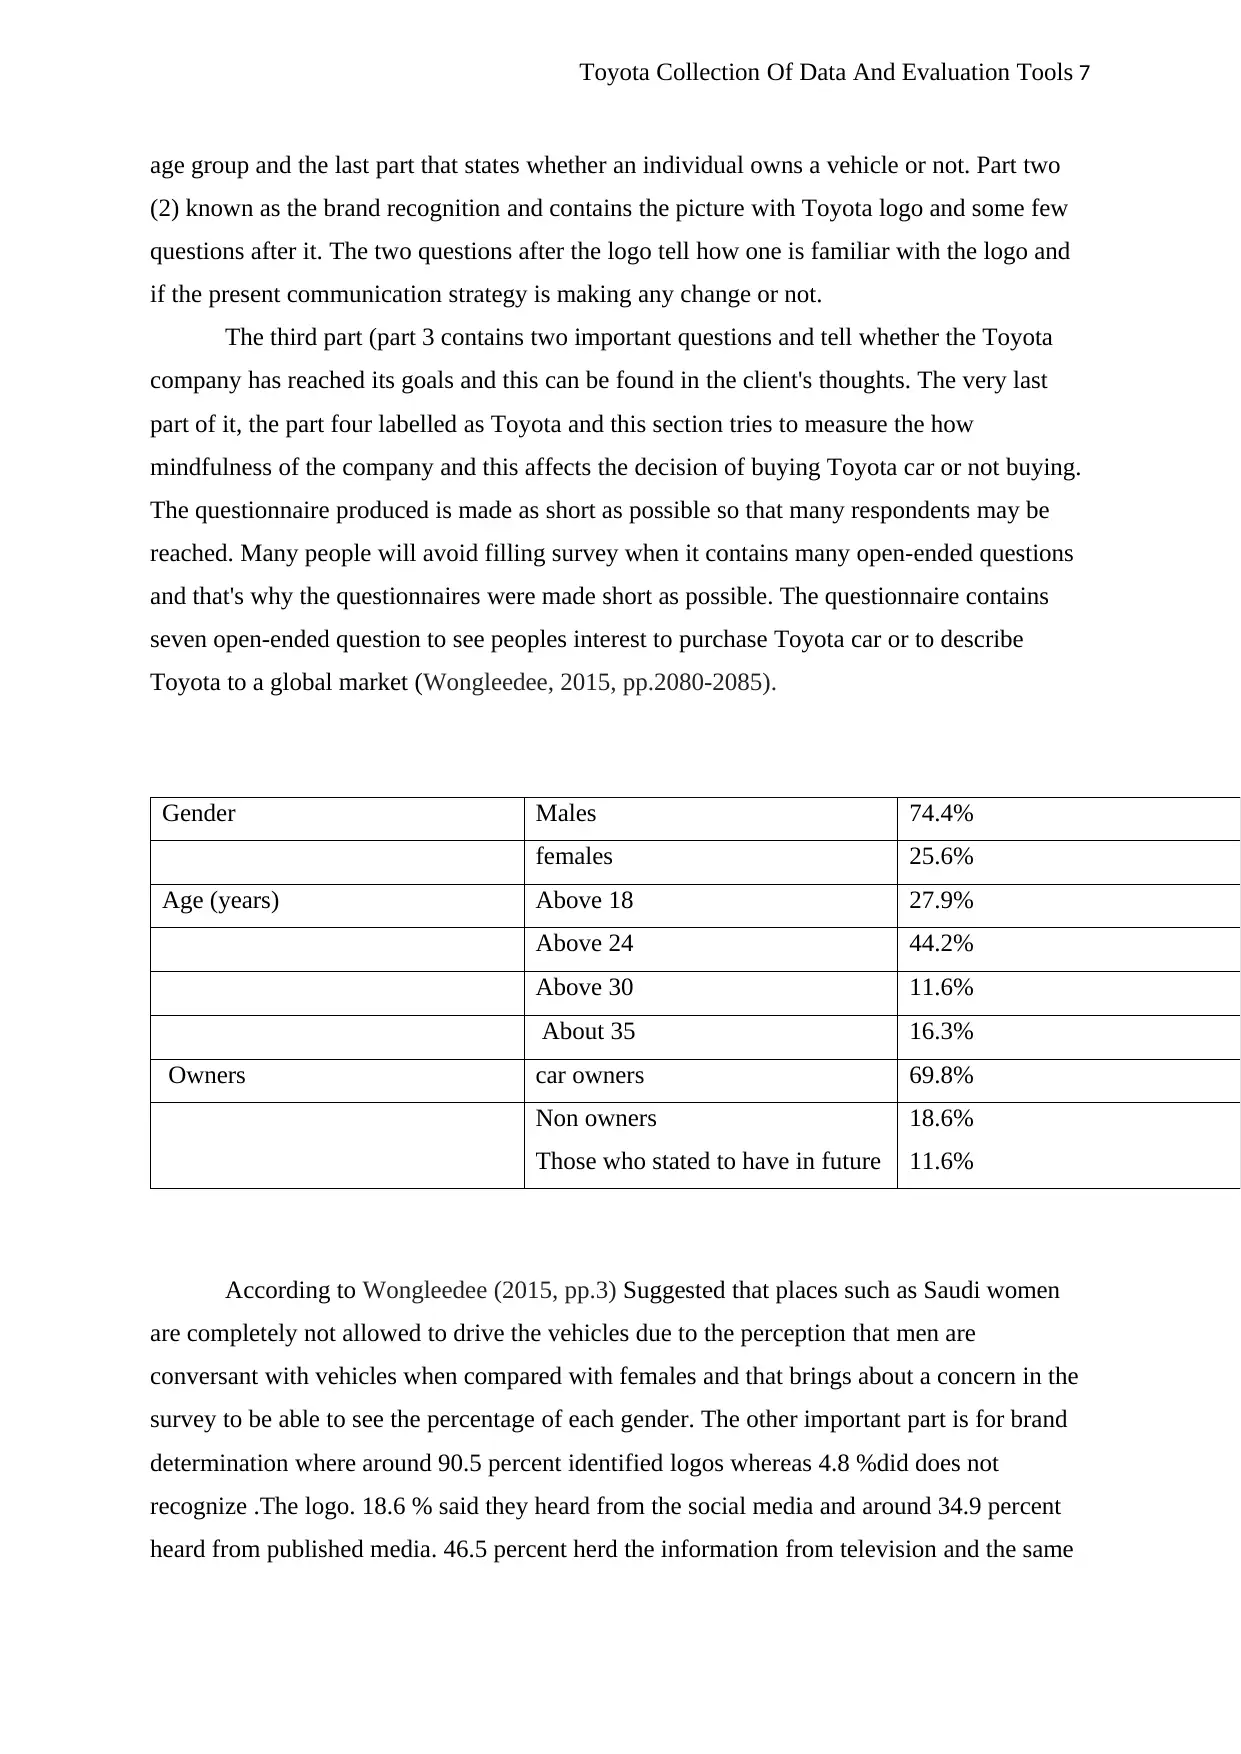
Toyota to a global market (Wongleedee, 2015, pp.2080-2085).
Gender Males 74.4%
females 25.6%
Age (years) Above 18 27.9%
Above 24 44.2%
Above 30 11.6%
About 35 16.3%
Owners car owners 69.8%
Non owners
Those who stated to have in future
18.6%
11.6%
According to Wongleedee (2015, pp.3) Suggested that places such as Saudi women
are completely not allowed to drive the vehicles due to the perception that men are
conversant with vehicles when compared with females and that brings about a concern in the
survey to be able to see the percentage of each gender. The other important part is for brand
determination where around 90.5 percent identified logos whereas 4.8 %did does not
recognize .The logo. 18.6 % said they heard from the social media and around 34.9 percent
heard from published media. 46.5 percent herd the information from television and the same
age group and the last part that states whether an individual owns a vehicle or not. Part two
(2) known as the brand recognition and contains the picture with Toyota logo and some few
questions after it. The two questions after the logo tell how one is familiar with the logo and
if the present communication strategy is making any change or not.
The third part (part 3 contains two important questions and tell whether the Toyota
company has reached its goals and this can be found in the client's thoughts. The very last
part of it, the part four labelled as Toyota and this section tries to measure the how
mindfulness of the company and this affects the decision of buying Toyota car or not buying.
The questionnaire produced is made as short as possible so that many respondents may be
reached. Many people will avoid filling survey when it contains many open-ended questions
and that's why the questionnaires were made short as possible. The questionnaire contains
seven open-ended question to see peoples interest to purchase Toyota car or to describe
Toyota to a global market (Wongleedee, 2015, pp.2080-2085).
Gender Males 74.4%
females 25.6%
Age (years) Above 18 27.9%
Above 24 44.2%
Above 30 11.6%
About 35 16.3%
Owners car owners 69.8%
Non owners
Those who stated to have in future
18.6%
11.6%
According to Wongleedee (2015, pp.3) Suggested that places such as Saudi women
are completely not allowed to drive the vehicles due to the perception that men are
conversant with vehicles when compared with females and that brings about a concern in the
survey to be able to see the percentage of each gender. The other important part is for brand
determination where around 90.5 percent identified logos whereas 4.8 %did does not
recognize .The logo. 18.6 % said they heard from the social media and around 34.9 percent
heard from published media. 46.5 percent herd the information from television and the same
Paraphrase This Document
Need a fresh take? Get an instant paraphrase of this document with our AI Paraphraser
Toyota Collection Of Data And Evaluation Tools 8
percent saw the information from the billboards, 81.4 percent see people driving cars made
by Toyota while the 7 percent said that their recognition is from other channels. Brand
acknowledgment is a key thing when it comes to marketing.
According to Cashman, K. (2013, 08 21) says the last part was about current Toyota
recollect and the survey was done in order to evaluate the amount of alertness the Saudi
clients have to Toyota world information. This tried to discover whether they had the latest
information about the news of latest Toyota. This shows how good Toyota is worldly
marketing communication means and how it has influenced the customer's choice to buy
Toyota vehicles (Tanwani 2016).
The results were that about 35.7 percent were familiar with the recall, 47.6 percent were not
familiar with the recall, and 16.7 percent were asking what a recall was while 9.3 percent said
that the recall touched their upcoming Toyota ordering choice. About 32, 6 said that they
were not affected at all while 37.2 said maybe it will affect them in future and about 20.9 said
that they don't know whether they will be affected or not.
Secondary data
Based on Alon and Prange (2016) The information given by CNN Toyota was rank
eight in the global largest 500 assistance but in the year 2011 Toyota was ranked number five
and according to CNN money the decrease is due to the stoppage in production as a result of
latest tremor and tidal wave that blow Japan in the year 2011. Toyota has been struggling to
reform its picture to the public by using different communication channel to market its own
products. However, Toyota has tried to buy the American Super Bowl that advertises sports
for about eight million dollars (Alona and Vianelli 2016).
Toyota is in the first line making sure that it's the best of all in today's world and
sober by modifying the view of being seen as becoming more efficient. Toyota is the
mainstream part that tries to reach young group generation. Toyota cannot be ignored as
being part of communal media and a good example is Facebook and YouTube and uses
approximately above 131 million dollars on the social media advancement.
According Adil, M., (2013 pp.358-373) Social media networking is not viewed as doing very
well in places such as Saudi as compared to other nations where about 79% of mature people
are public users, taking in mind that known public networking site, a good example includes
Facebook and Twitter are known not to charge when one sets up accounts and profile pages.
Toyota Company is known to hold the top honours in what's called Brandz top 100 years
Toyota Collection Of Data And Evaluation Tools 9
even if it is viewed as having low sales. It was ranked as the world largest and most
appreciated product in the year 2011.
Certain web links and internet services are not found in every part of the world.
Facebook is not found in China (Adil, 2013 pp.358-373) There an evidence that Toyota has
become more important in many communication networks for it to cover a wide area of
demographics. Toyota has begun its promotion and the updates which provide good
promotion and being in touch with customers. Billboards are not always found in the whole
world for example in Saudi. Toyota has been recognized through printed articles such as
newspapers and magazines. Advancement and apprise provide promotion and trying as much
to come into close intact with their customers. The use of billboards is not always used all
over the world e.g. In Saudi the printed magazines as well as newspapers then Toyota is
recognized worldwide. Toyota Company should improve its marketing strategy in any means.
Toyota Company is viewed as the best-known product all over the globe and this also
demonstrates their success in their communication channel. They help most of the television
shows and also buying the prime sports which are good methods for the company to advertise
the products and always engage in the client compatibility. Television advertisement claim
well scripts and plot and such scripts and plots may not be well for the nation.
Based on Toyota (September 11, 2012) indicates that Toyota leadership has been in a
disaster and has been making the wrong decision to secure money by reducing thousands of
workers Toyota didn't take an instant action when their customers were complaining about
issues with cars. Toyota impedes to improve the quality of customers in response to problems
and take proper measures to prevent any future inconveniences. The value of and safety
graphic chart flows shows how Toyota can implement the latest process which will later
develop total quality management and empower everybody in the firm to be integrated into
the process of quality management.
Total quality management process has four main divisions which include to plan, to
do, to check and final which include to plan, to do, to check and finally to react.
Before the implementation, the flow diagram shows that the Toyota Company operates and
conducts their business prior to quality process advancement .the largest emphasis is
stockholder who worries about reducing costs with an intention of making profits. Quality
was the least part of this robust system at a functional meeting (Morgan, 2007 pp.43-76).
⊘ This is a preview!⊘
Do you want full access?
Subscribe today to unlock all pages.
Trusted by 1+ million students worldwide
Toyota Collection Of Data And Evaluation Tools 10
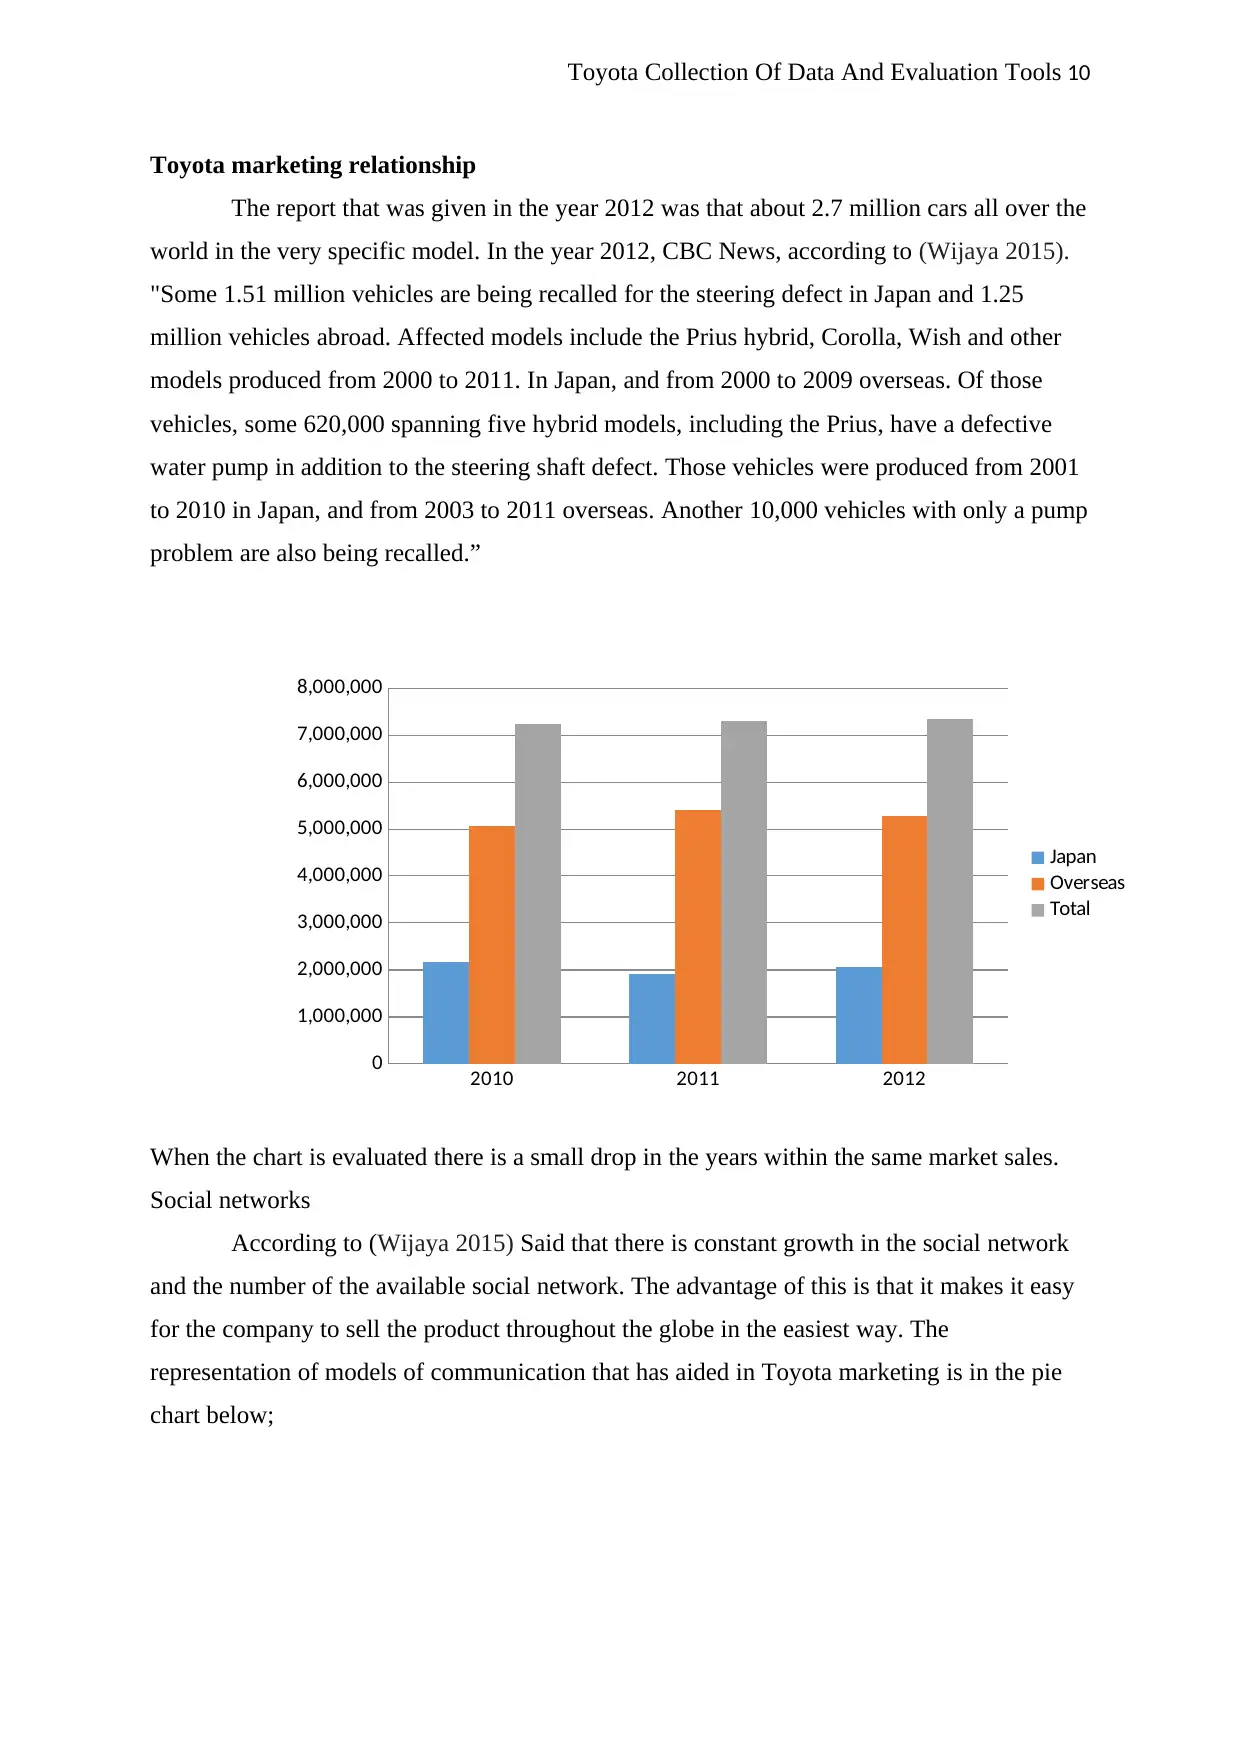
Toyota marketing relationship
The report that was given in the year 2012 was that about 2.7 million cars all over the
world in the very specific model. In the year 2012, CBC News, according to (Wijaya 2015).
"Some 1.51 million vehicles are being recalled for the steering defect in Japan and 1.25
million vehicles abroad. Affected models include the Prius hybrid, Corolla, Wish and other
models produced from 2000 to 2011. In Japan, and from 2000 to 2009 overseas. Of those
vehicles, some 620,000 spanning five hybrid models, including the Prius, have a defective
water pump in addition to the steering shaft defect. Those vehicles were produced from 2001
to 2010 in Japan, and from 2003 to 2011 overseas. Another 10,000 vehicles with only a pump
problem are also being recalled.”
When the chart is evaluated there is a small drop in the years within the same market sales.
Social networks
According to (Wijaya 2015) Said that there is constant growth in the social network
and the number of the available social network. The advantage of this is that it makes it easy
for the company to sell the product throughout the globe in the easiest way. The
representation of models of communication that has aided in Toyota marketing is in the pie
chart below;
2010 2011 2012
0
1,000,000
2,000,000
3,000,000
4,000,000
5,000,000
6,000,000
7,000,000
8,000,000
Japan
Overseas
Total
Paraphrase This Document
Need a fresh take? Get an instant paraphrase of this document with our AI Paraphraser
Toyota Collection Of Data And Evaluation Tools 11
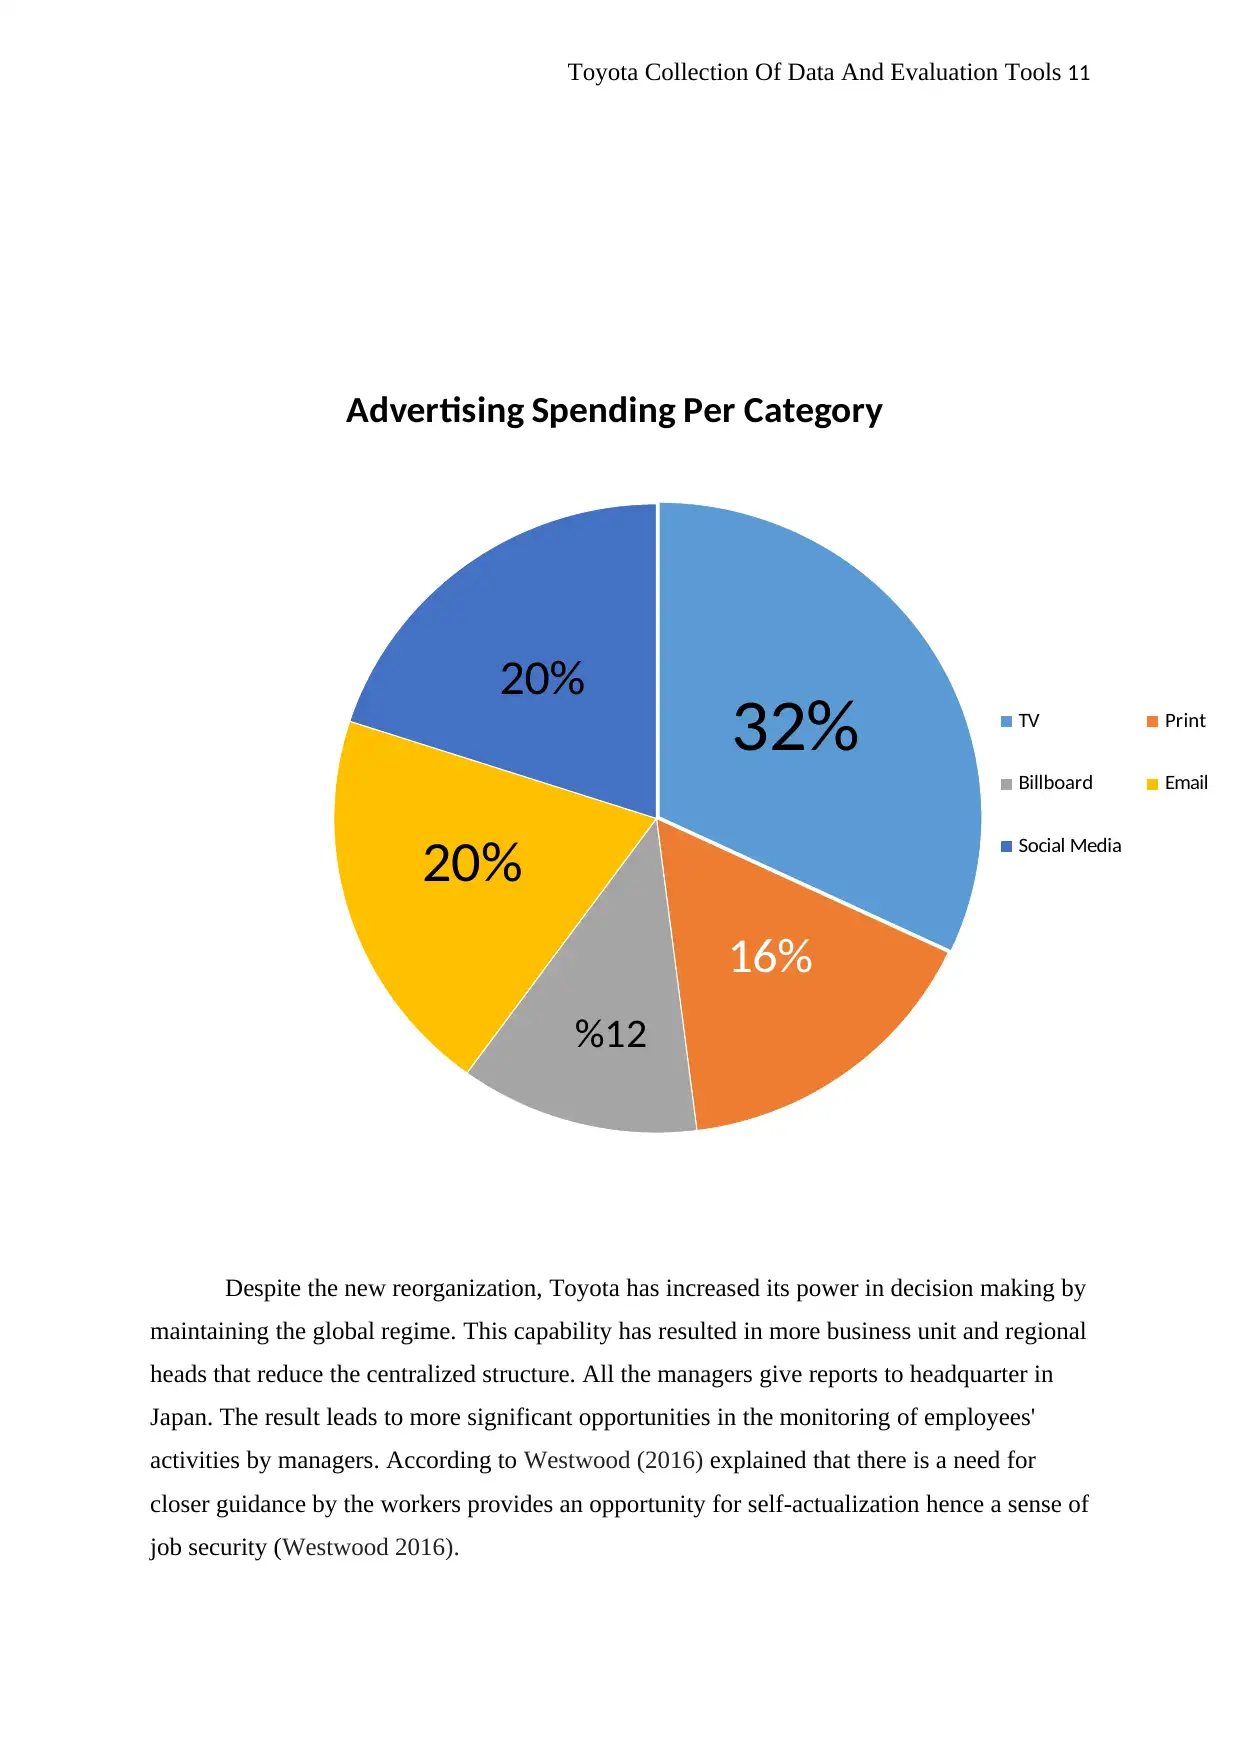
32%
16%
%12
20%
20%
Advertising Spending Per Category
TV Print
Billboard Email
Social Media
Despite the new reorganization, Toyota has increased its power in decision making by
maintaining the global regime. This capability has resulted in more business unit and regional
heads that reduce the centralized structure. All the managers give reports to headquarter in
Japan. The result leads to more significant opportunities in the monitoring of employees'
activities by managers. According to Westwood (2016) explained that there is a need for
closer guidance by the workers provides an opportunity for self-actualization hence a sense of
job security (Westwood 2016).
Toyota Collection Of Data And Evaluation Tools 12
References
Adil, M., 2013. Modelling effect of perceived service quality dimensions on customer
satisfaction in Indian bank settings. International Journal of Services and
Operations Management, 15(3), pp.358-373.
Alon, I., Jaffe, E., Prange, C. and Vianelli, D., 2016. Global marketing: contemporary
theory, practice, and cases. Routledge.
Bhandari, S., 2007. An Analysis of Toyota’s Marketing Strategy.
Bhardwaj, D., 2017. The new rules of marketing and PR: How to use social media, online
video, mobile applications, blogs, news releases, and viral marketing to reach buyers
directly by David Merman Scott: Wiley, Hoboken, NJ, 2015, 458 pp.,18-98
(paperback), ISBN: 978-81-265-6004-2.
Brannen, J., 2009. Prologue: Mixed methods for novice researchers: Reflections and
themes. International journal of multiple research approaches, 3(1), pp.8-12.
Cameron, R., 2009. A sequential mixed model research design: Design, analytical and
display issues. International Journal of Multiple Research Approaches, 3(2),
pp.140-152.
Crouch, C. and Pearce, J., 2013. Doing research in design. Bloomsbury Publishing.
Crowther, D. and Lancaster, G., 2012. Research methods. Routledge
Ellis, D., 1989. A behavioural approach to information retrieval system design. Journal of
documentation, 45(3), pp.171-212.
Johnson, R.B., Onwuegbuzie, A.J. and Turner, L.A., 2007. Toward a definition of mixed
methods research. Journal of mixed methods research, 1(2), pp.112-133.
.
⊘ This is a preview!⊘
Do you want full access?
Subscribe today to unlock all pages.
Trusted by 1+ million students worldwide
1 out of 14


Your All-in-One AI-Powered Toolkit for Academic Success.
+13062052269
info@desklib.com
Available 24*7 on WhatsApp / Email
![[object Object]](/_next/static/media/star-bottom.7253800d.svg)
Unlock your academic potential
Copyright © 2020–2026 A2Z Services. All Rights Reserved. Developed and managed by ZUCOL.