Tracker Portfolio Construction: Analysis, Methods, and Performance
VerifiedAdded on 2023/06/05
|12
|1633
|249
Report
AI Summary
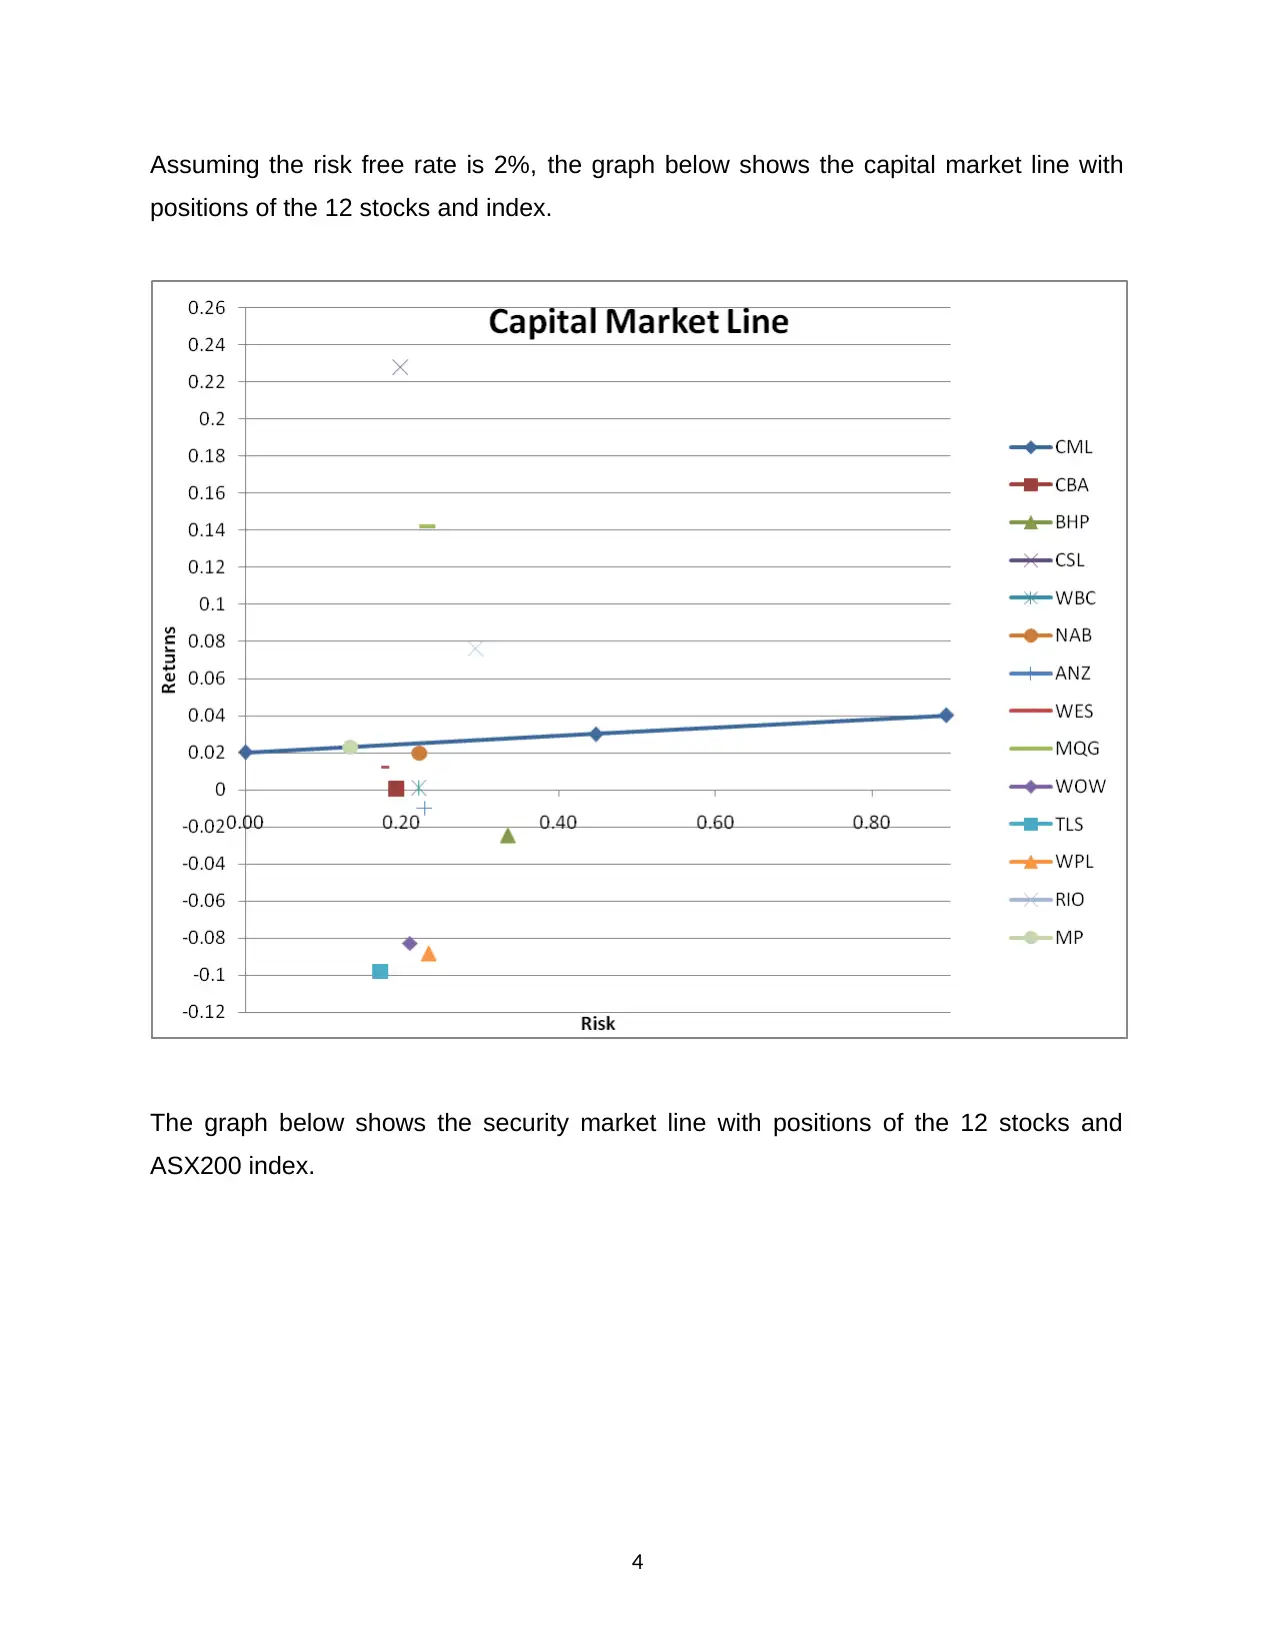
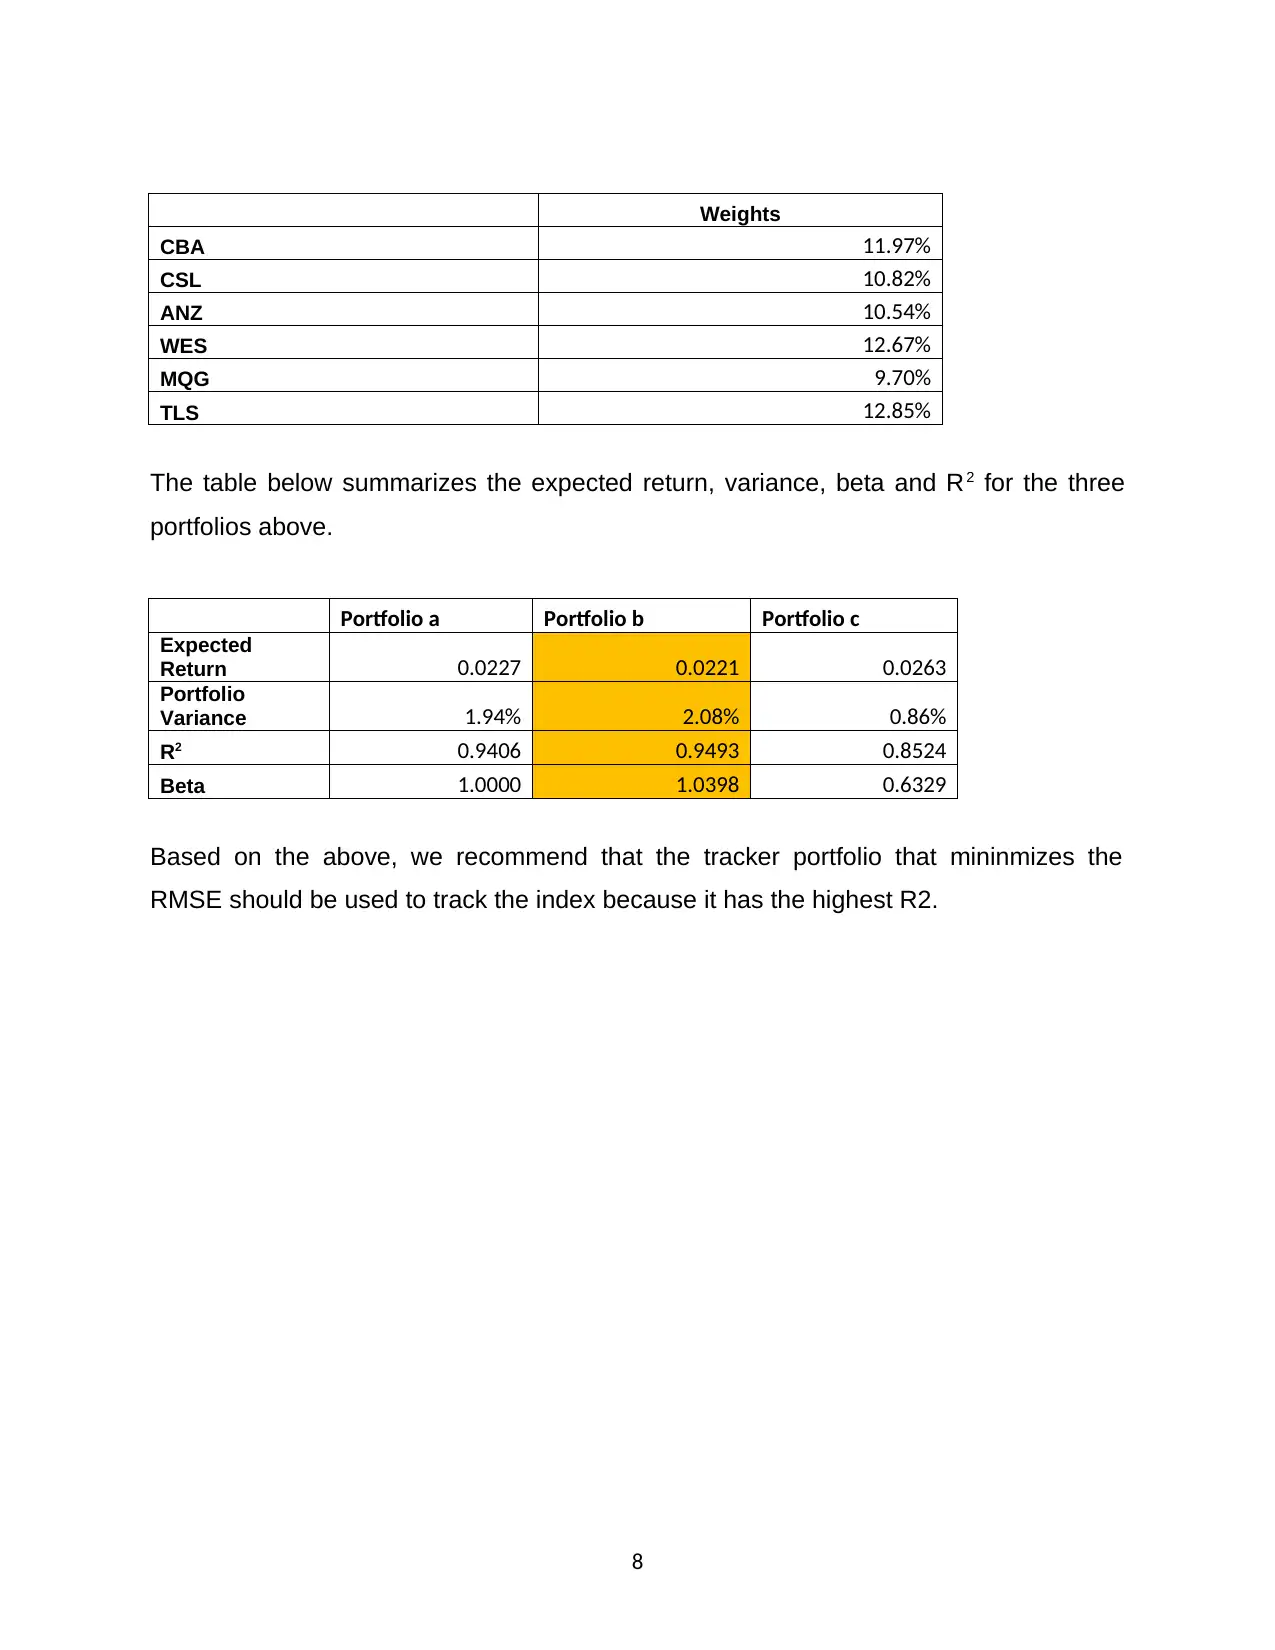
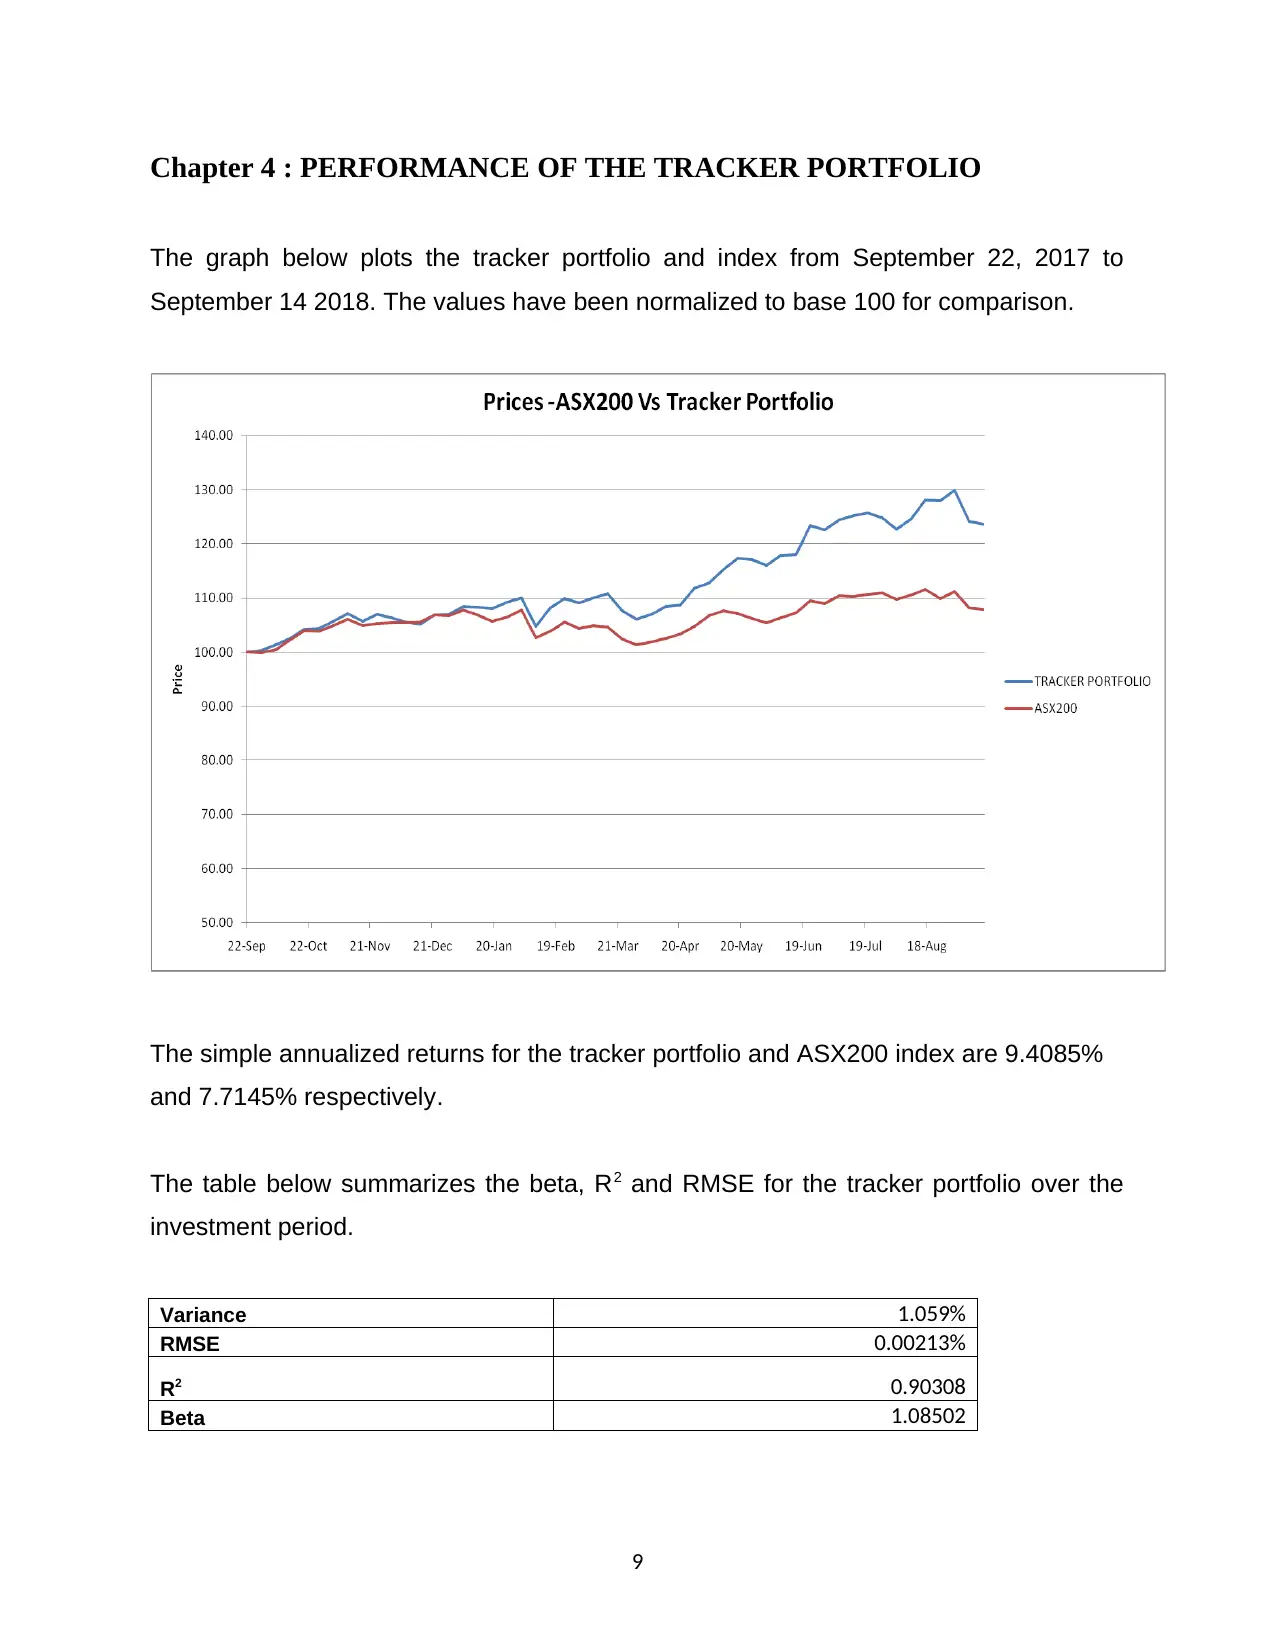
This report investigates various methods for constructing a tracking portfolio using 12 stocks and the ASX200 index. It transforms stock prices into weekly returns and analyzes annualized returns, variance-covariance matrix, and beta. Three portfolios are constructed using different methods to track the ASX200, and their performance is compared. The analysis includes variance minimization and RMSE optimization. The report also evaluates the tracker portfolio's performance over 12 months, assessing how closely it follows the index, and discusses the expected return, variance, beta, and R-squared for each portfolio. It concludes by recommending the tracker portfolio that minimizes RMSE for tracking the index due to its higher R-squared value.

1 out of 12
Related Documents


Your All-in-One AI-Powered Toolkit for Academic Success.
+13062052269
info@desklib.com
Available 24*7 on WhatsApp / Email
![[object Object]](/_next/static/media/star-bottom.7253800d.svg)
Copyright © 2020–2025 A2Z Services. All Rights Reserved. Developed and managed by ZUCOL.