BUS708: Statistical Analysis of NSW Transport System Data Report, 2018
VerifiedAdded on 2023/06/04
|11
|1882
|92
Report
AI Summary
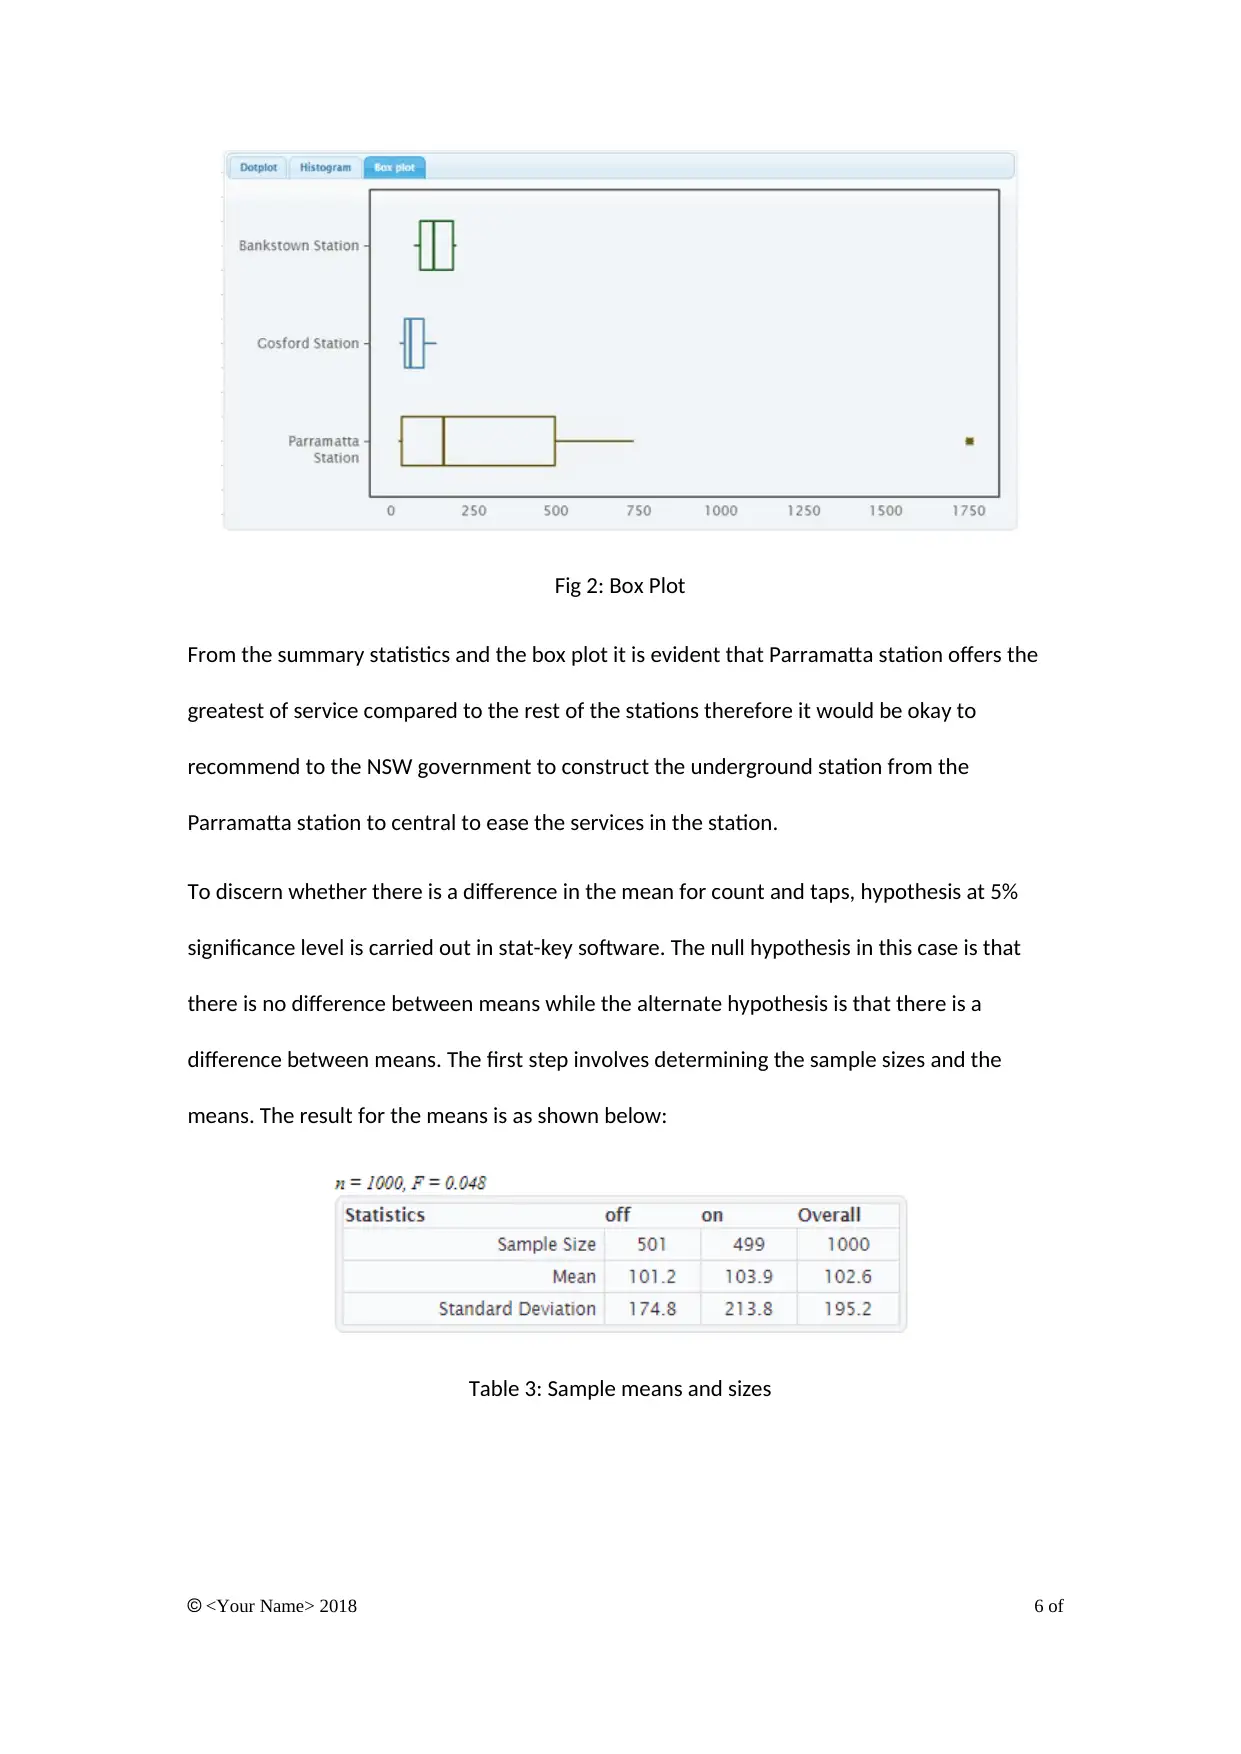
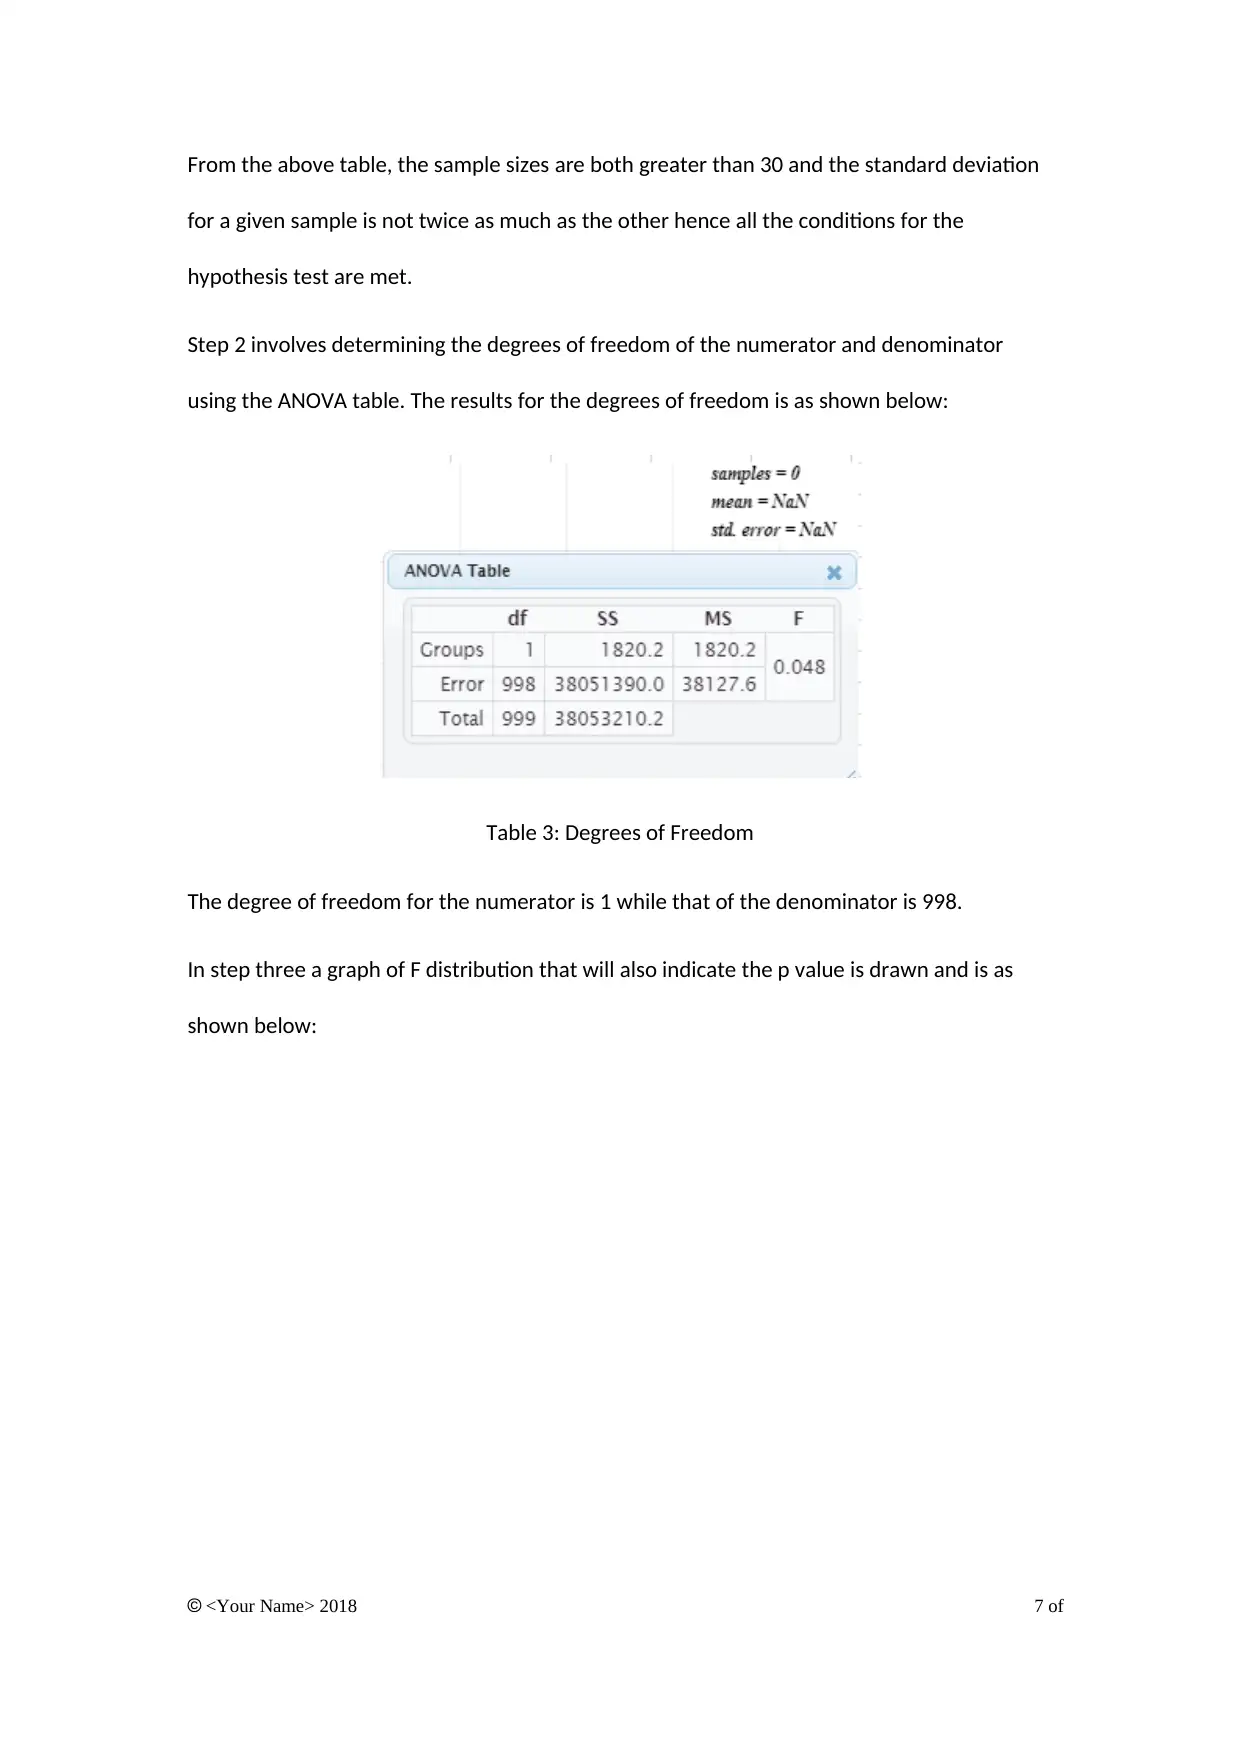
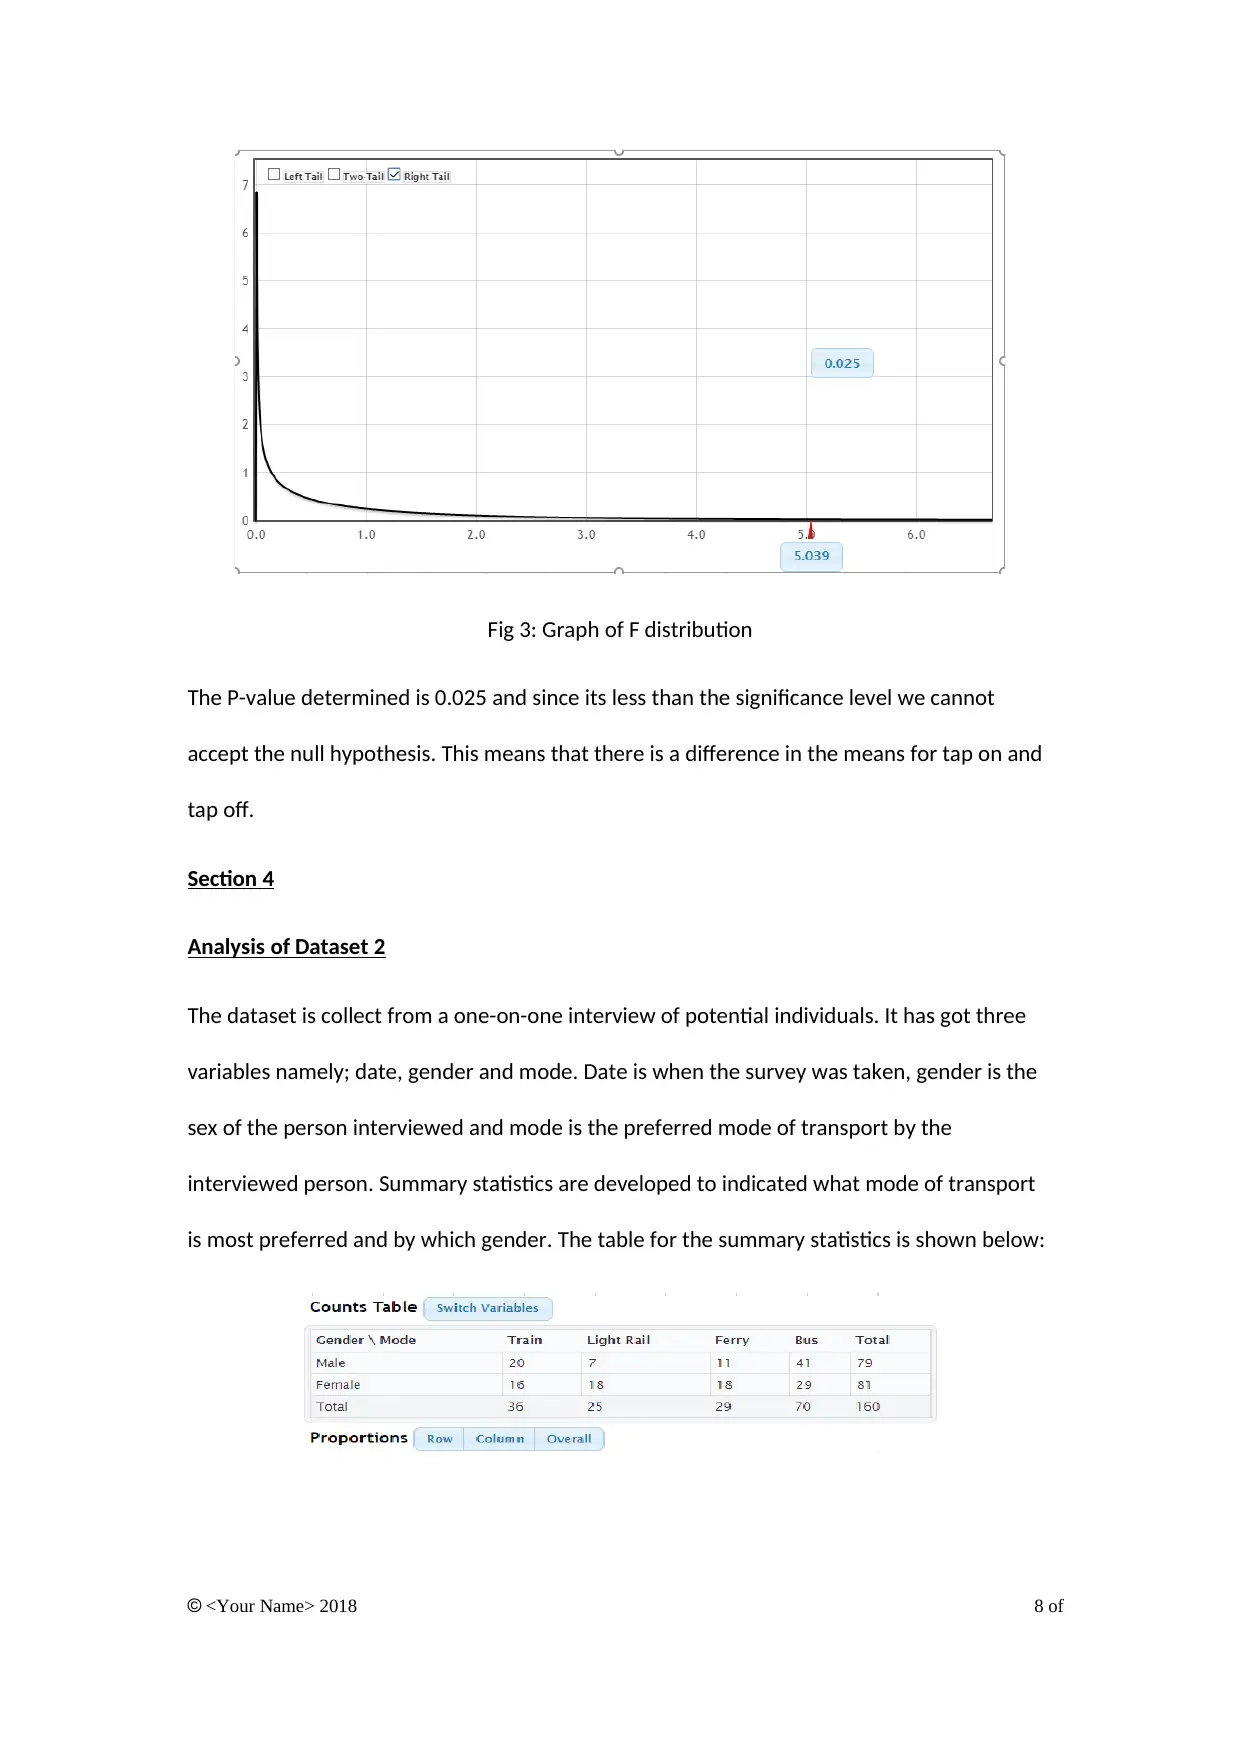
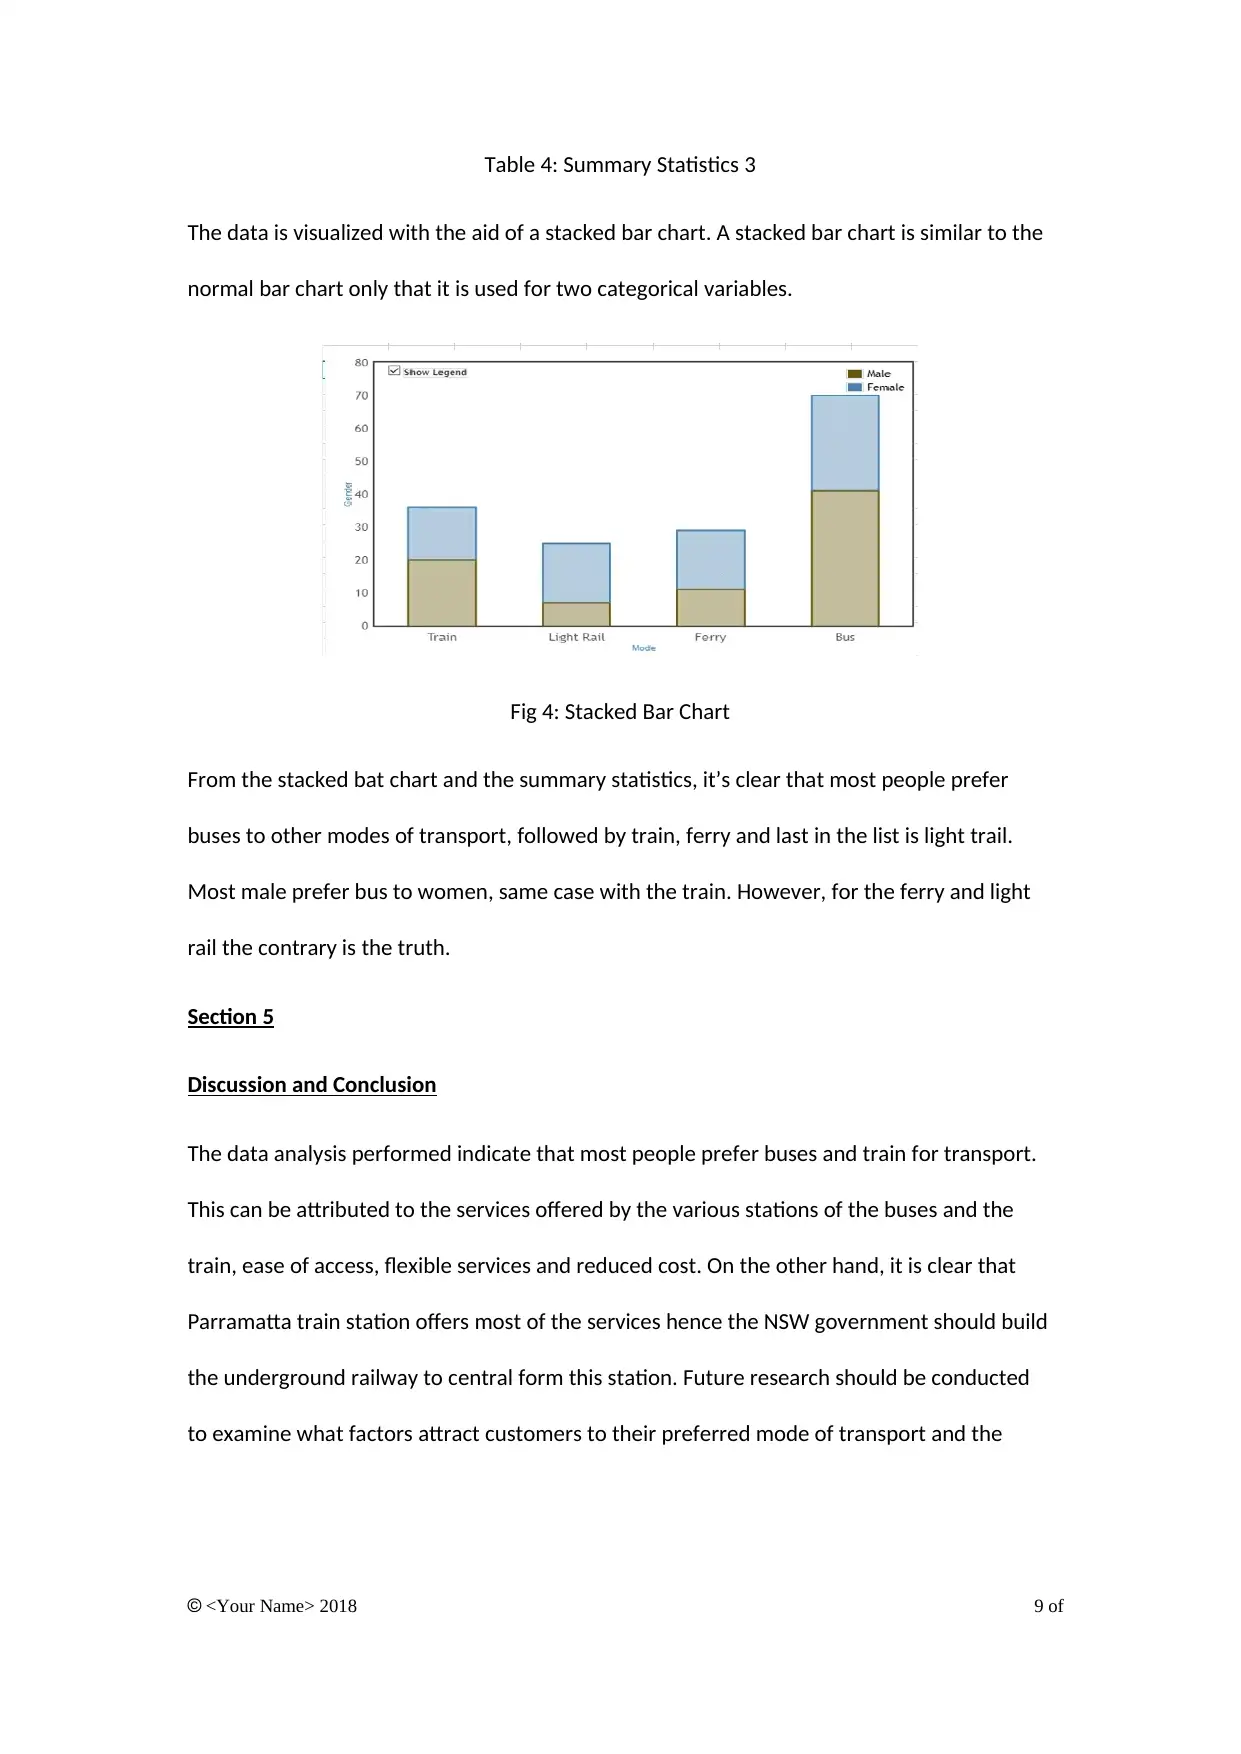
This report presents a statistical analysis of NSW transport data, focusing on the commonly used modes of transport and potential areas for improvement. The analysis utilizes two datasets: one provided by Transport for NSW and a second dataset collected through a survey. The report includes single and two-variable analyses, employing summary statistics, pie charts, and box plots to visualize the data. Hypothesis testing is conducted to determine the significance of observed differences in transport preferences. The findings reveal that buses and trains are the most popular modes of transport. Furthermore, the analysis suggests that the Parramatta train station offers the most service. The report concludes with recommendations for the NSW government, including the construction of an underground railway from Parramatta station to central. The report also suggests further research into factors influencing transport choices. Statistical software like StatKey and Excel were used to analyze the data.

1 out of 11
Related Documents


Your All-in-One AI-Powered Toolkit for Academic Success.
+13062052269
info@desklib.com
Available 24*7 on WhatsApp / Email
![[object Object]](/_next/static/media/star-bottom.7253800d.svg)
Copyright © 2020–2026 A2Z Services. All Rights Reserved. Developed and managed by ZUCOL.