Financial Analysis and Management Report on Thomas Cook Company
VerifiedAdded on 2020/01/23
|25
|5896
|27
Report
AI Summary
This report provides a comprehensive financial analysis of Thomas Cook, a major player in the UK travel and tourism industry. The analysis begins with a justification for selecting Thomas Cook, highlighting its operational scope and recent financial struggles. The report identifies key events and announcements that have impacted the company's performance, including financing facilities, joint ventures, and external factors like economic downturns and geopolitical instability. It then examines changes in key financial trends, such as gross and net profit ratios, illustrating these trends with charts. A detailed ratio analysis is presented, covering profitability, liquidity, and activity ratios, with tables and illustrations to visualize the data. The analysis offers insights into the company's financial health and concludes with recommendations based on the findings.

FIANANCIAL ANALSIS AND
MANAGEMENT
MANAGEMENT
Paraphrase This Document
Need a fresh take? Get an instant paraphrase of this document with our AI Paraphraser
TABLE OF CONTENTS
INTRODUCTION...........................................................................................................................3
Choice of company and justification for its inclusion................................................................3
Identification of key events and announcements........................................................................4
Changes in key financial trends..................................................................................................6
Ratio analysis of Thomas cook...................................................................................................8
Recommendation and conclusion..................................................................................................19
REFRENCES.................................................................................................................................20
APPENDIX....................................................................................................................................22
INDEX OF TABLES
Table 1: Ratios of Thomas cook......................................................................................................8
ILLUSTRATION INDEX
Illustration 1: Gross profit ratio of Thomas cook............................................................................6
Illustration 2: Net profit ratio of Thomas cook................................................................................7
Illustration 3: Gross profit ratio of Thomas cook............................................................................9
Illustration 4: Net profit ratio of Thomas cook..............................................................................10
Illustration 5: Operating profit ratio of Thomas cook....................................................................11
Illustration 6: Current ratio of Thomas cook.................................................................................12
Illustration 7: Quick ratio of Thomas cook....................................................................................13
Illustration 8: Assets turnover ratio of Thomas cook.....................................................................14
Illustration 9: Inventory turnover ratio of Thomas cook...............................................................14
Illustration 10: Receivable turnover ratio of Thomas cook...........................................................16
Illustration 11: Debt equity ratio of Thomas cook.........................................................................17
Illustration 12: EPS of Thomas cook.............................................................................................17
Illustration 13: PE ratio of Thomas cook.......................................................................................18
Illustration 14: Dividend yield ratio of Thomas cook....................................................................19
INTRODUCTION
Ratio analysis is a one of the most important technique that is used to measure firm
performance. In financial analysis firms are evaluated on the basis of various parameters. In this
report Thomas cook which operates in the travel and tourism industry of UK is taken in to
consideration and is analyzed deeply by using different type of ratios. Justification for selection
of the firm is given in the report. After doing entire analysis and study of the firm some
recommendations are given in the report. Along with this conclusion is also derived at end of the
report.
Choice of company and justification for its inclusion
Thomas cook is taken into consideration for the financial analysis of a company and it is
currently operating across the globe. In many nations like India, China and UK, it is operating its
business. In UK and Ireland, it is employing 9,262 employees. Thomas cook is taken for research
because it is one of the leading firms in the UK which is operating in the travel and tourism
industry. From past few years, it has been observed that its profitability has been shrinking
consistently. This report is prepared to identify the factors due to which firm is not performing
well even it has good image among the public. Travel and tourism industry covers 9% of the UK
GDP. . In past years, firm profitability was negative in value (Chen and Gupta, 2011). The
second factor that is taken into consideration while selecting Thomas cook is that travel and
tourism industry is growing at a rapid pace approx 9% and instead of that, this firm is struggling
for its survival and fast growth rate. Hence, it is very important to identify the reasons that are
responsible for very slow growth of firm in the industry. If there is slow growth rate of in case
of small or medium sized firm then to some extent it can assumed that that poor economic
condition of the nation is the main reason behind same. Thomas cook is the largest travel and
tourism firm in the UK so it can be said that firm’s growth rate must be in alignment to the
industry growth rate. But this is not happening and firm is nowhere nearby to industry in terms of
growth rate which is a matter of concern for its top managers (Miller and Jones, 2010). In past
years, firm’s top managers taken many decisions but results show that same were ineffective for
the firm in terms of growth rate. Ratio analysis method will be used to evaluate the performance
of firm. This will help in evaluating the business performance from various sides. This technique
will also aid in assessing several strong and weak points in context of business. Thus, by this,
⊘ This is a preview!⊘
Do you want full access?
Subscribe today to unlock all pages.
Trusted by 1+ million students worldwide
firm will be able to know the internal factors that are responsible for the slow growth of it. This
company is chosen because its profitability was low and it will help in understanding the extent
to which business environment puts negative impact on the firm’s profitability. It will also aid in
understanding the internal factors and the roles played by same in the firm’s growth rate. Hence,
it can be said that this ratio will to large extent help in identifying the factors to which firms must
give due importance. Analysis of Thomas cook will also support in identifying the factors that
indirectly put their large impact on the firm’s financial performance.
Identification of key events and announcements
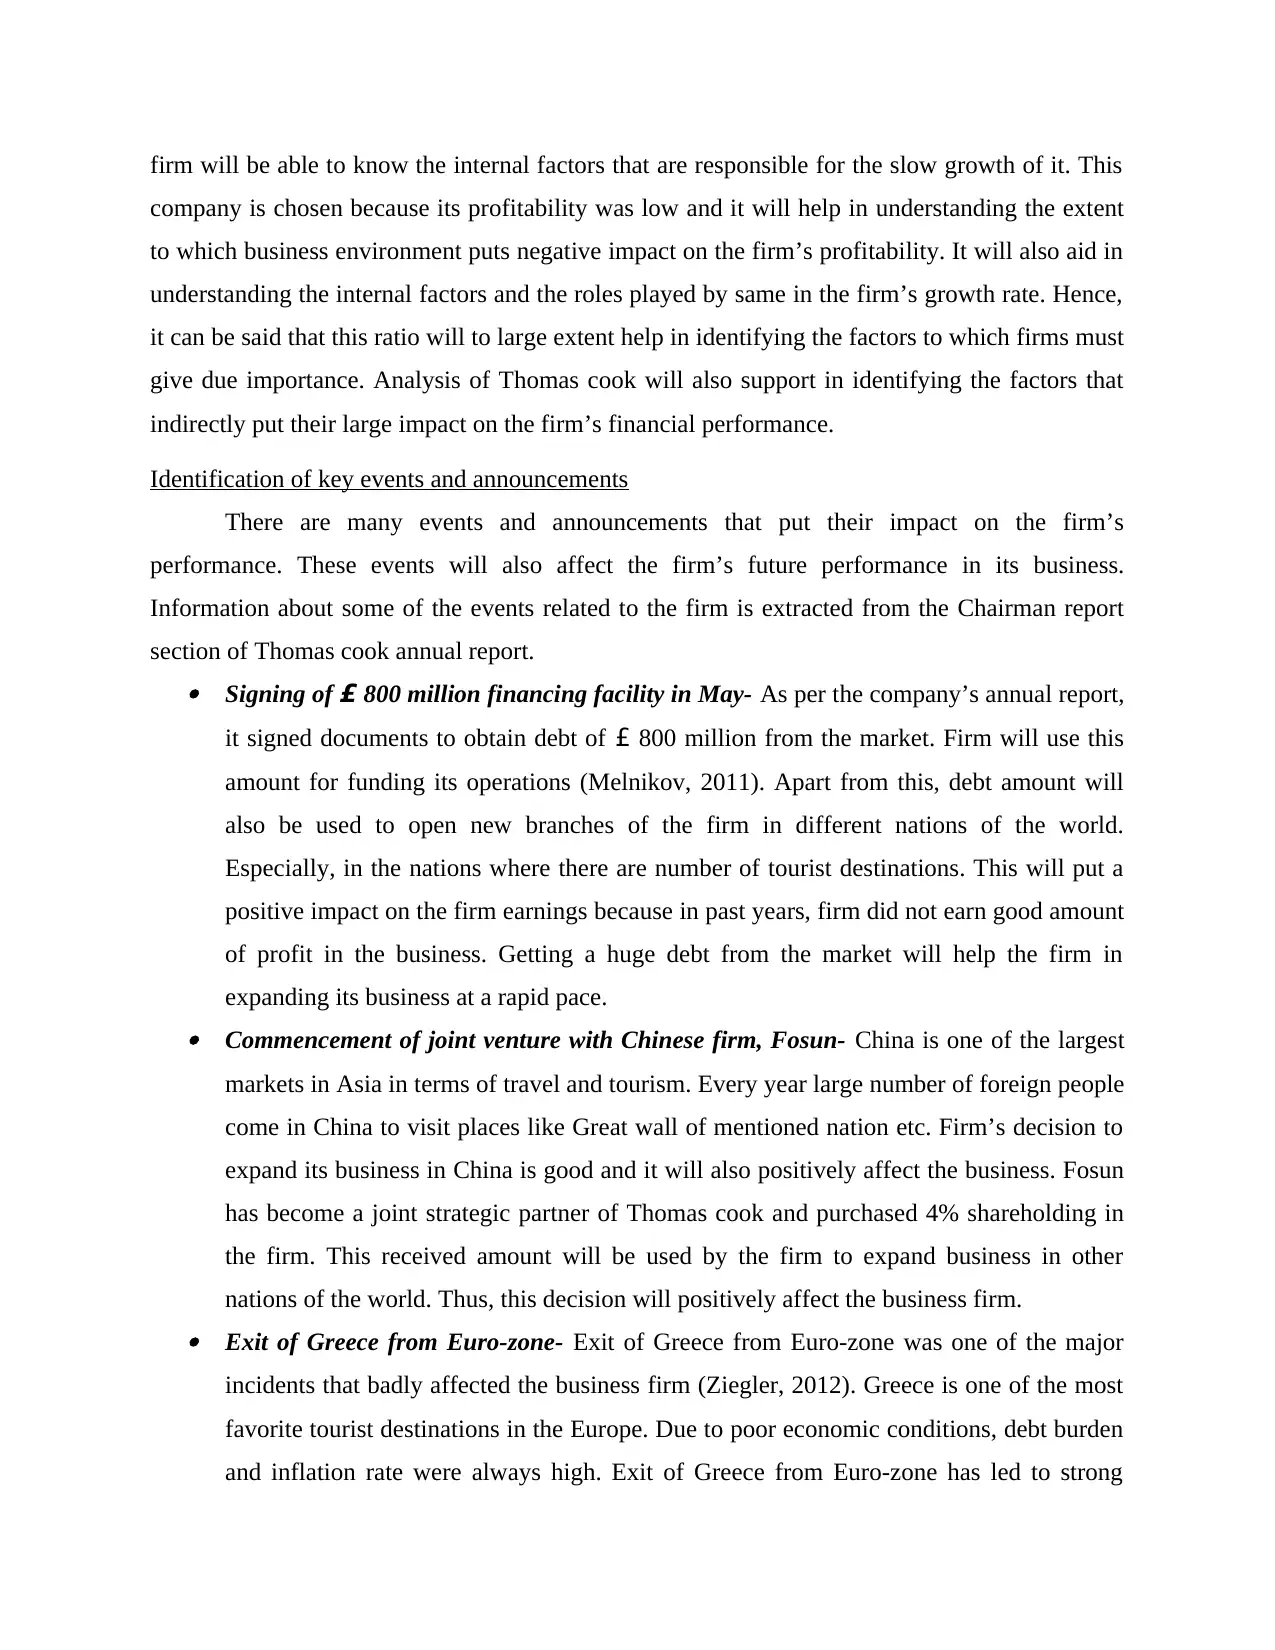
There are many events and announcements that put their impact on the firm’s
performance. These events will also affect the firm’s future performance in its business.
Information about some of the events related to the firm is extracted from the Chairman report
section of Thomas cook annual report. Signing of £ 800 million financing facility in May- As per the company’s annual report,
it signed documents to obtain debt of £ 800 million from the market. Firm will use this
amount for funding its operations (Melnikov, 2011). Apart from this, debt amount will
also be used to open new branches of the firm in different nations of the world.
Especially, in the nations where there are number of tourist destinations. This will put a
positive impact on the firm earnings because in past years, firm did not earn good amount
of profit in the business. Getting a huge debt from the market will help the firm in
expanding its business at a rapid pace. Commencement of joint venture with Chinese firm, Fosun- China is one of the largest
markets in Asia in terms of travel and tourism. Every year large number of foreign people
come in China to visit places like Great wall of mentioned nation etc. Firm’s decision to
expand its business in China is good and it will also positively affect the business. Fosun
has become a joint strategic partner of Thomas cook and purchased 4% shareholding in
the firm. This received amount will be used by the firm to expand business in other
nations of the world. Thus, this decision will positively affect the business firm. Exit of Greece from Euro-zone- Exit of Greece from Euro-zone was one of the major
incidents that badly affected the business firm (Ziegler, 2012). Greece is one of the most
favorite tourist destinations in the Europe. Due to poor economic conditions, debt burden
and inflation rate were always high. Exit of Greece from Euro-zone has led to strong
company is chosen because its profitability was low and it will help in understanding the extent
to which business environment puts negative impact on the firm’s profitability. It will also aid in
understanding the internal factors and the roles played by same in the firm’s growth rate. Hence,
it can be said that this ratio will to large extent help in identifying the factors to which firms must
give due importance. Analysis of Thomas cook will also support in identifying the factors that
indirectly put their large impact on the firm’s financial performance.
Identification of key events and announcements
There are many events and announcements that put their impact on the firm’s
performance. These events will also affect the firm’s future performance in its business.
Information about some of the events related to the firm is extracted from the Chairman report
section of Thomas cook annual report. Signing of £ 800 million financing facility in May- As per the company’s annual report,
it signed documents to obtain debt of £ 800 million from the market. Firm will use this
amount for funding its operations (Melnikov, 2011). Apart from this, debt amount will
also be used to open new branches of the firm in different nations of the world.
Especially, in the nations where there are number of tourist destinations. This will put a
positive impact on the firm earnings because in past years, firm did not earn good amount
of profit in the business. Getting a huge debt from the market will help the firm in
expanding its business at a rapid pace. Commencement of joint venture with Chinese firm, Fosun- China is one of the largest
markets in Asia in terms of travel and tourism. Every year large number of foreign people
come in China to visit places like Great wall of mentioned nation etc. Firm’s decision to
expand its business in China is good and it will also positively affect the business. Fosun
has become a joint strategic partner of Thomas cook and purchased 4% shareholding in
the firm. This received amount will be used by the firm to expand business in other
nations of the world. Thus, this decision will positively affect the business firm. Exit of Greece from Euro-zone- Exit of Greece from Euro-zone was one of the major
incidents that badly affected the business firm (Ziegler, 2012). Greece is one of the most
favorite tourist destinations in the Europe. Due to poor economic conditions, debt burden
and inflation rate were always high. Exit of Greece from Euro-zone has led to strong
Paraphrase This Document
Need a fresh take? Get an instant paraphrase of this document with our AI Paraphraser
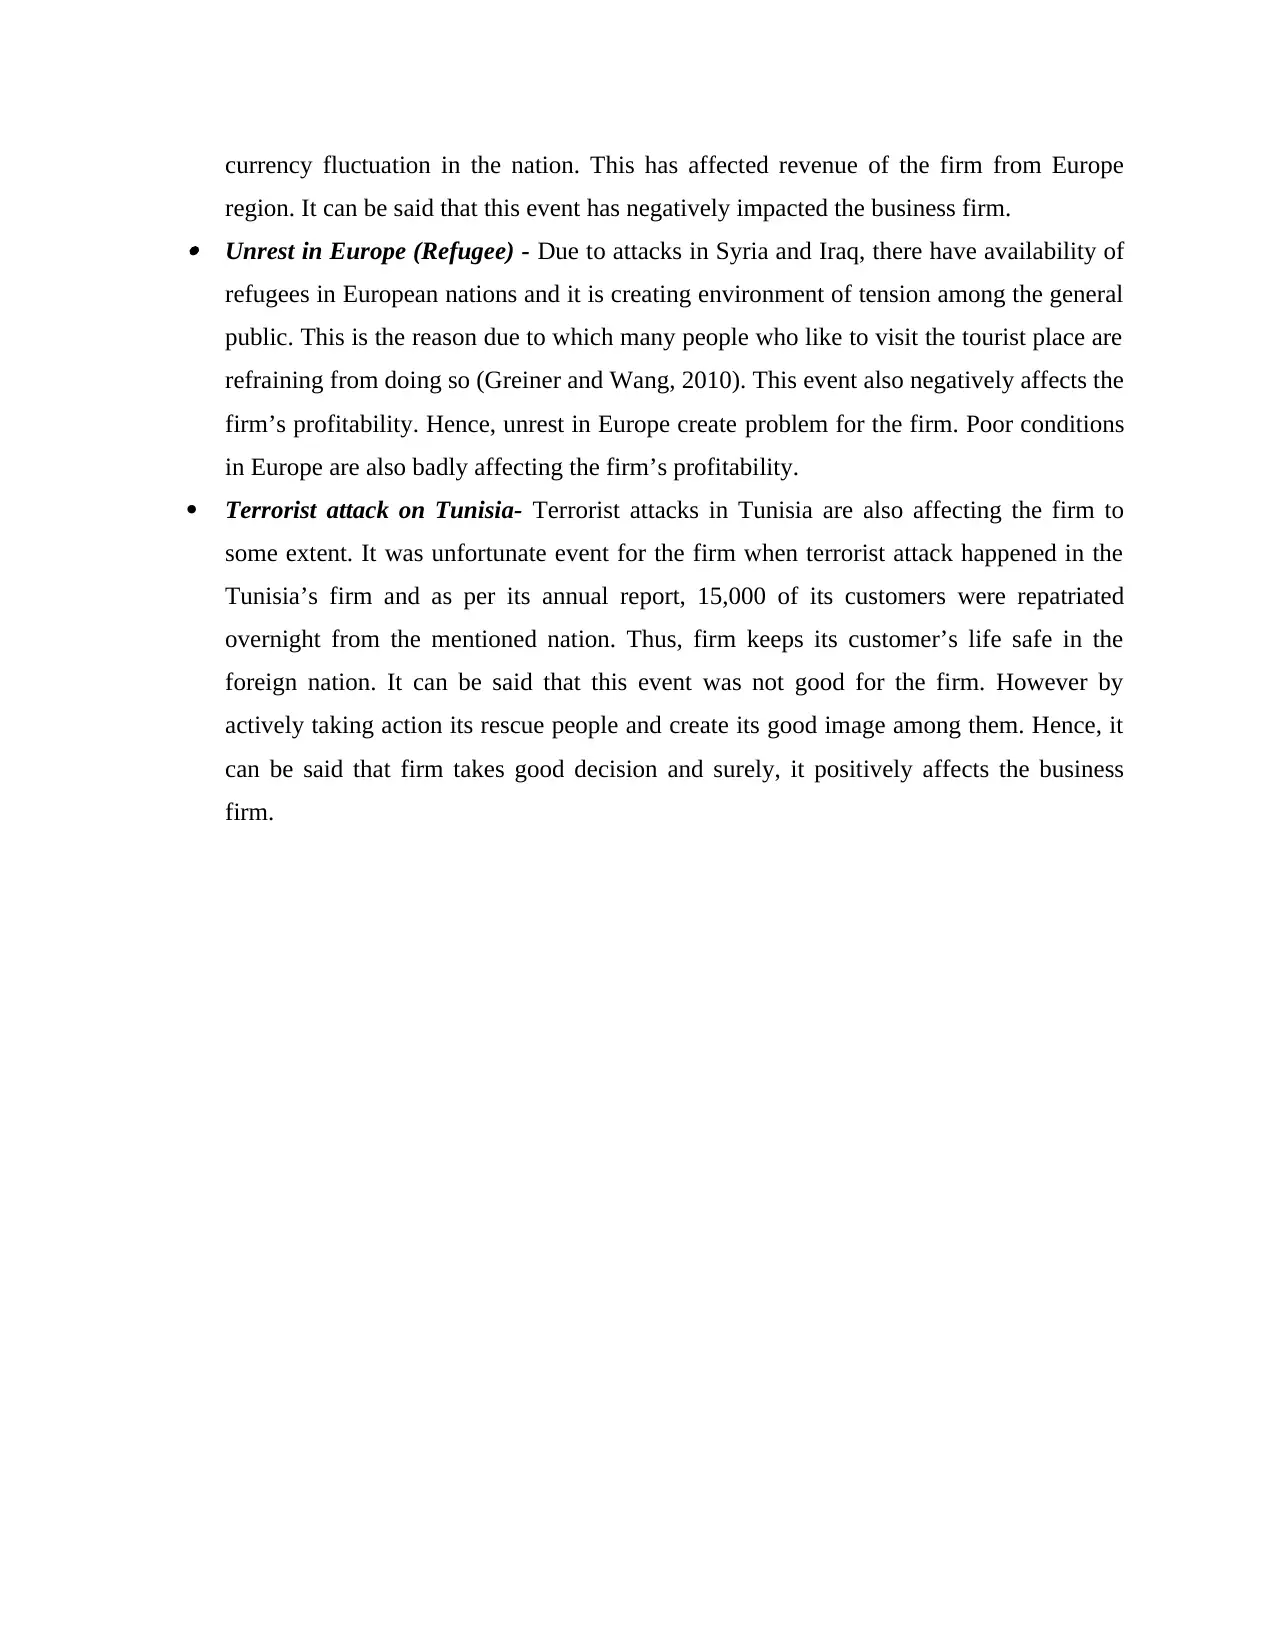
currency fluctuation in the nation. This has affected revenue of the firm from Europe
region. It can be said that this event has negatively impacted the business firm. Unrest in Europe (Refugee) - Due to attacks in Syria and Iraq, there have availability of
refugees in European nations and it is creating environment of tension among the general
public. This is the reason due to which many people who like to visit the tourist place are
refraining from doing so (Greiner and Wang, 2010). This event also negatively affects the
firm’s profitability. Hence, unrest in Europe create problem for the firm. Poor conditions
in Europe are also badly affecting the firm’s profitability.
Terrorist attack on Tunisia- Terrorist attacks in Tunisia are also affecting the firm to
some extent. It was unfortunate event for the firm when terrorist attack happened in the
Tunisia’s firm and as per its annual report, 15,000 of its customers were repatriated
overnight from the mentioned nation. Thus, firm keeps its customer’s life safe in the
foreign nation. It can be said that this event was not good for the firm. However by
actively taking action its rescue people and create its good image among them. Hence, it
can be said that firm takes good decision and surely, it positively affects the business
firm.
Changes in key financial trends
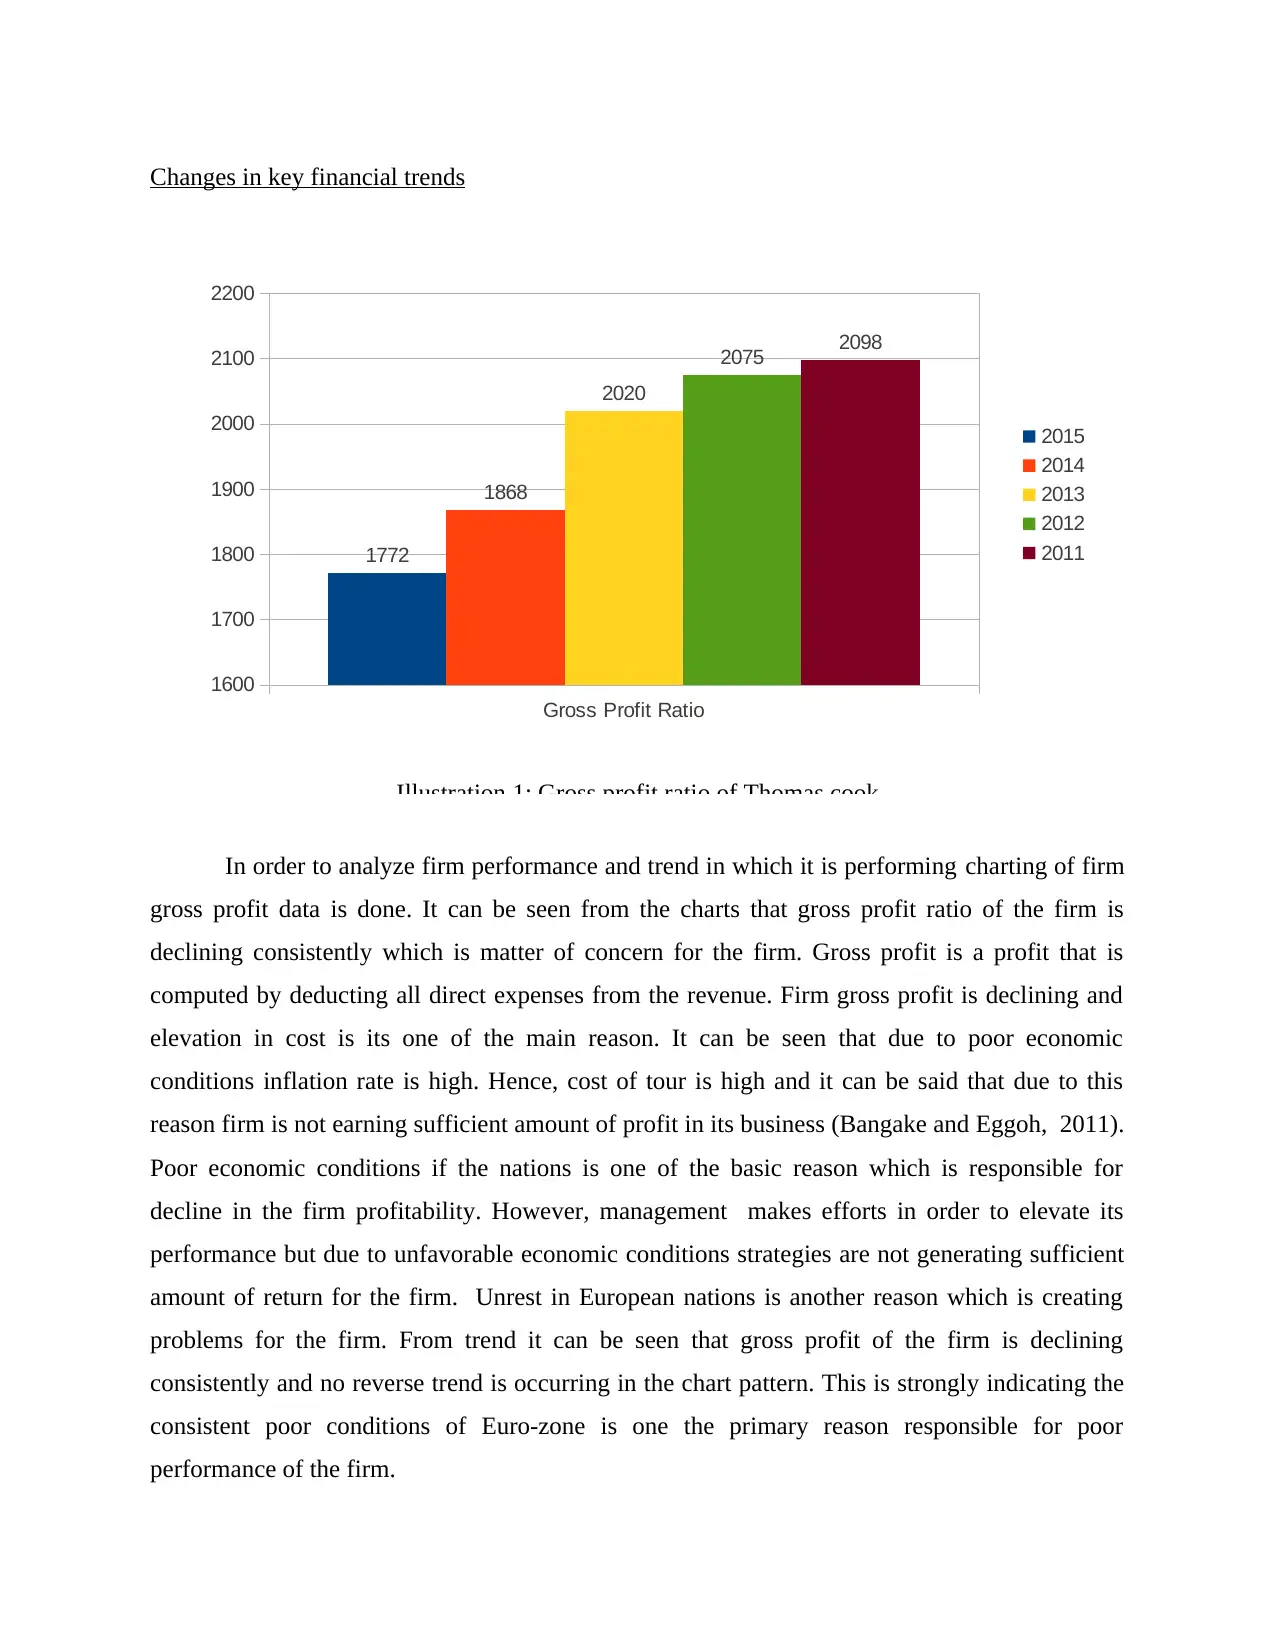
In order to analyze firm performance and trend in which it is performing charting of firm
gross profit data is done. It can be seen from the charts that gross profit ratio of the firm is
declining consistently which is matter of concern for the firm. Gross profit is a profit that is
computed by deducting all direct expenses from the revenue. Firm gross profit is declining and
elevation in cost is its one of the main reason. It can be seen that due to poor economic
conditions inflation rate is high. Hence, cost of tour is high and it can be said that due to this
reason firm is not earning sufficient amount of profit in its business (Bangake and Eggoh, 2011).
Poor economic conditions if the nations is one of the basic reason which is responsible for
decline in the firm profitability. However, management makes efforts in order to elevate its
performance but due to unfavorable economic conditions strategies are not generating sufficient
amount of return for the firm. Unrest in European nations is another reason which is creating
problems for the firm. From trend it can be seen that gross profit of the firm is declining
consistently and no reverse trend is occurring in the chart pattern. This is strongly indicating the
consistent poor conditions of Euro-zone is one the primary reason responsible for poor
performance of the firm.
Gross Profit Ratio
1600
1700
1800
1900
2000
2100
2200
1772
1868
2020
2075 2098
2015
2014
2013
2012
2011
Illustration 1: Gross profit ratio of Thomas cook
⊘ This is a preview!⊘
Do you want full access?
Subscribe today to unlock all pages.
Trusted by 1+ million students worldwide
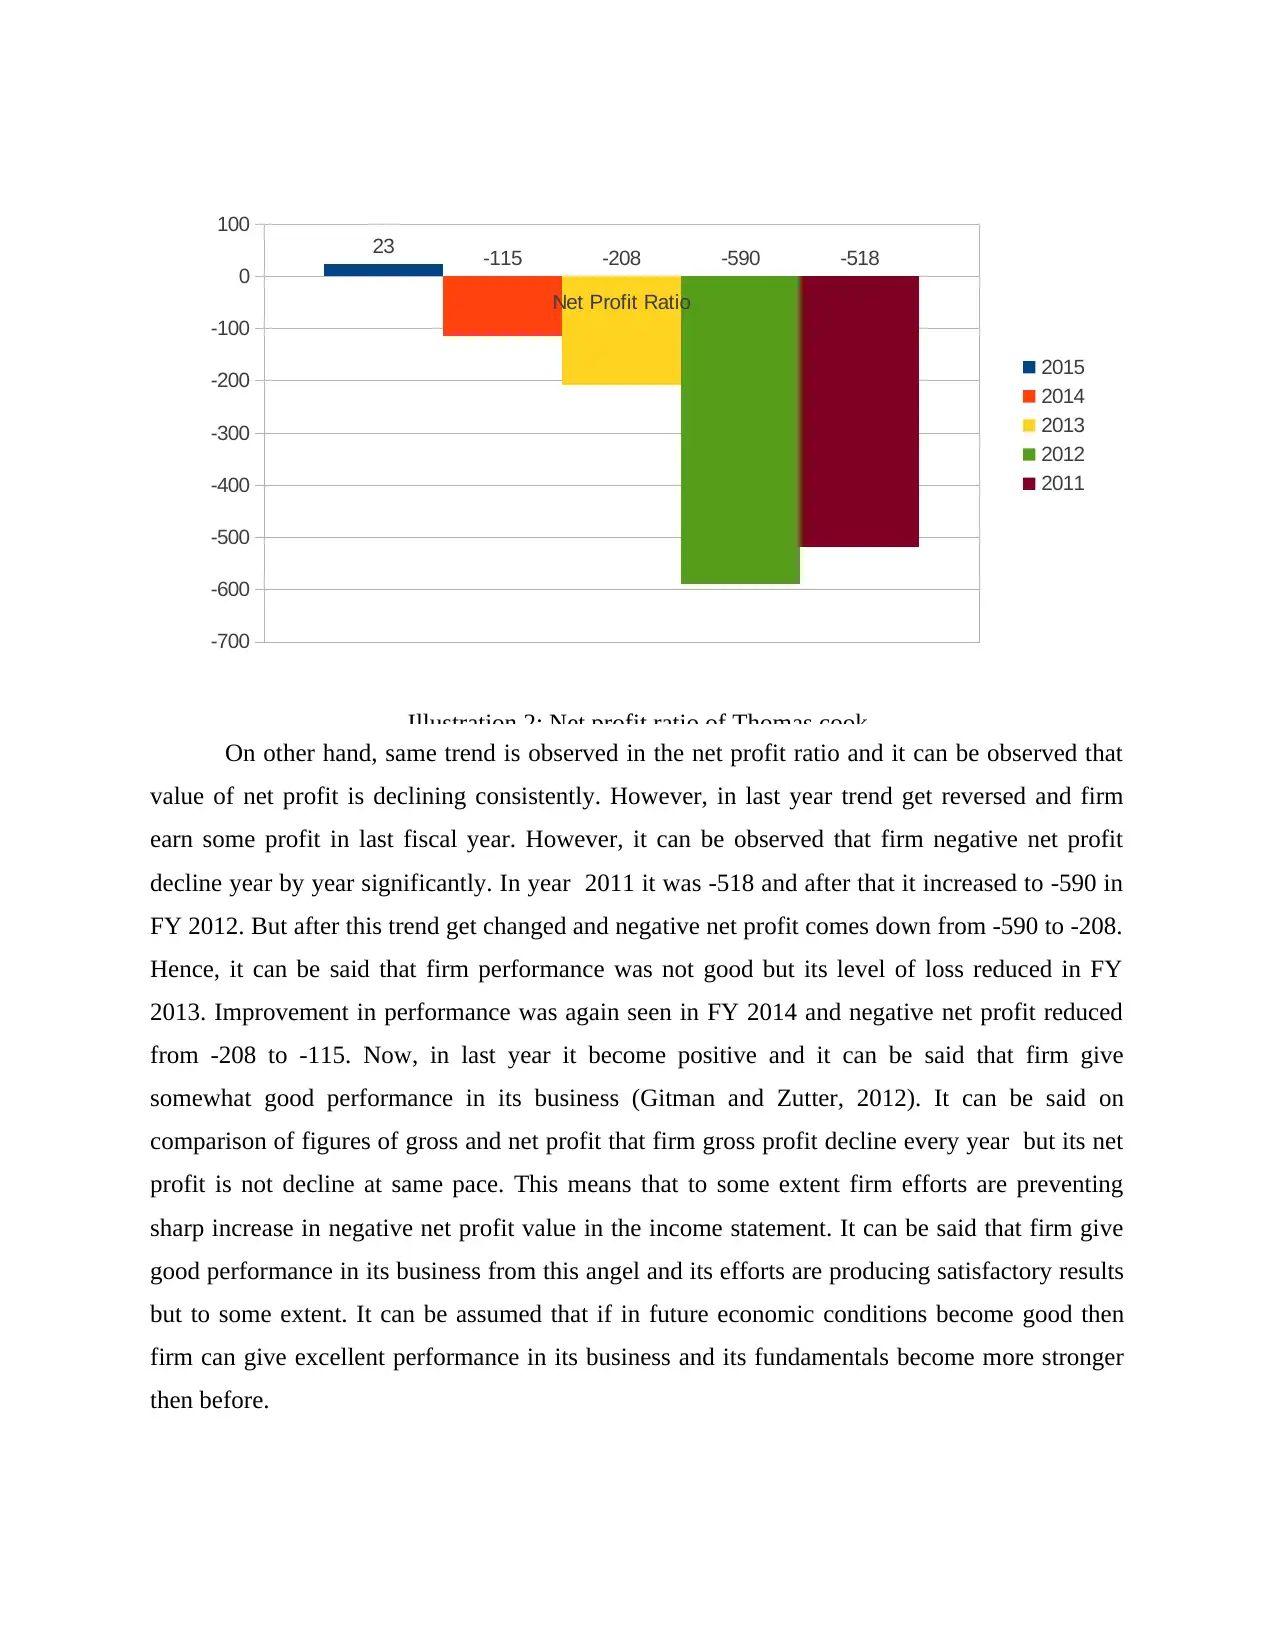
On other hand, same trend is observed in the net profit ratio and it can be observed that
value of net profit is declining consistently. However, in last year trend get reversed and firm
earn some profit in last fiscal year. However, it can be observed that firm negative net profit
decline year by year significantly. In year 2011 it was -518 and after that it increased to -590 in
FY 2012. But after this trend get changed and negative net profit comes down from -590 to -208.
Hence, it can be said that firm performance was not good but its level of loss reduced in FY
2013. Improvement in performance was again seen in FY 2014 and negative net profit reduced
from -208 to -115. Now, in last year it become positive and it can be said that firm give
somewhat good performance in its business (Gitman and Zutter, 2012). It can be said on
comparison of figures of gross and net profit that firm gross profit decline every year but its net
profit is not decline at same pace. This means that to some extent firm efforts are preventing
sharp increase in negative net profit value in the income statement. It can be said that firm give
good performance in its business from this angel and its efforts are producing satisfactory results
but to some extent. It can be assumed that if in future economic conditions become good then
firm can give excellent performance in its business and its fundamentals become more stronger
then before.
Net Profit Ratio
-700
-600
-500
-400
-300
-200
-100
0
100
23 -115 -208 -590 -518
2015
2014
2013
2012
2011
Illustration 2: Net profit ratio of Thomas cook
Paraphrase This Document
Need a fresh take? Get an instant paraphrase of this document with our AI Paraphraser
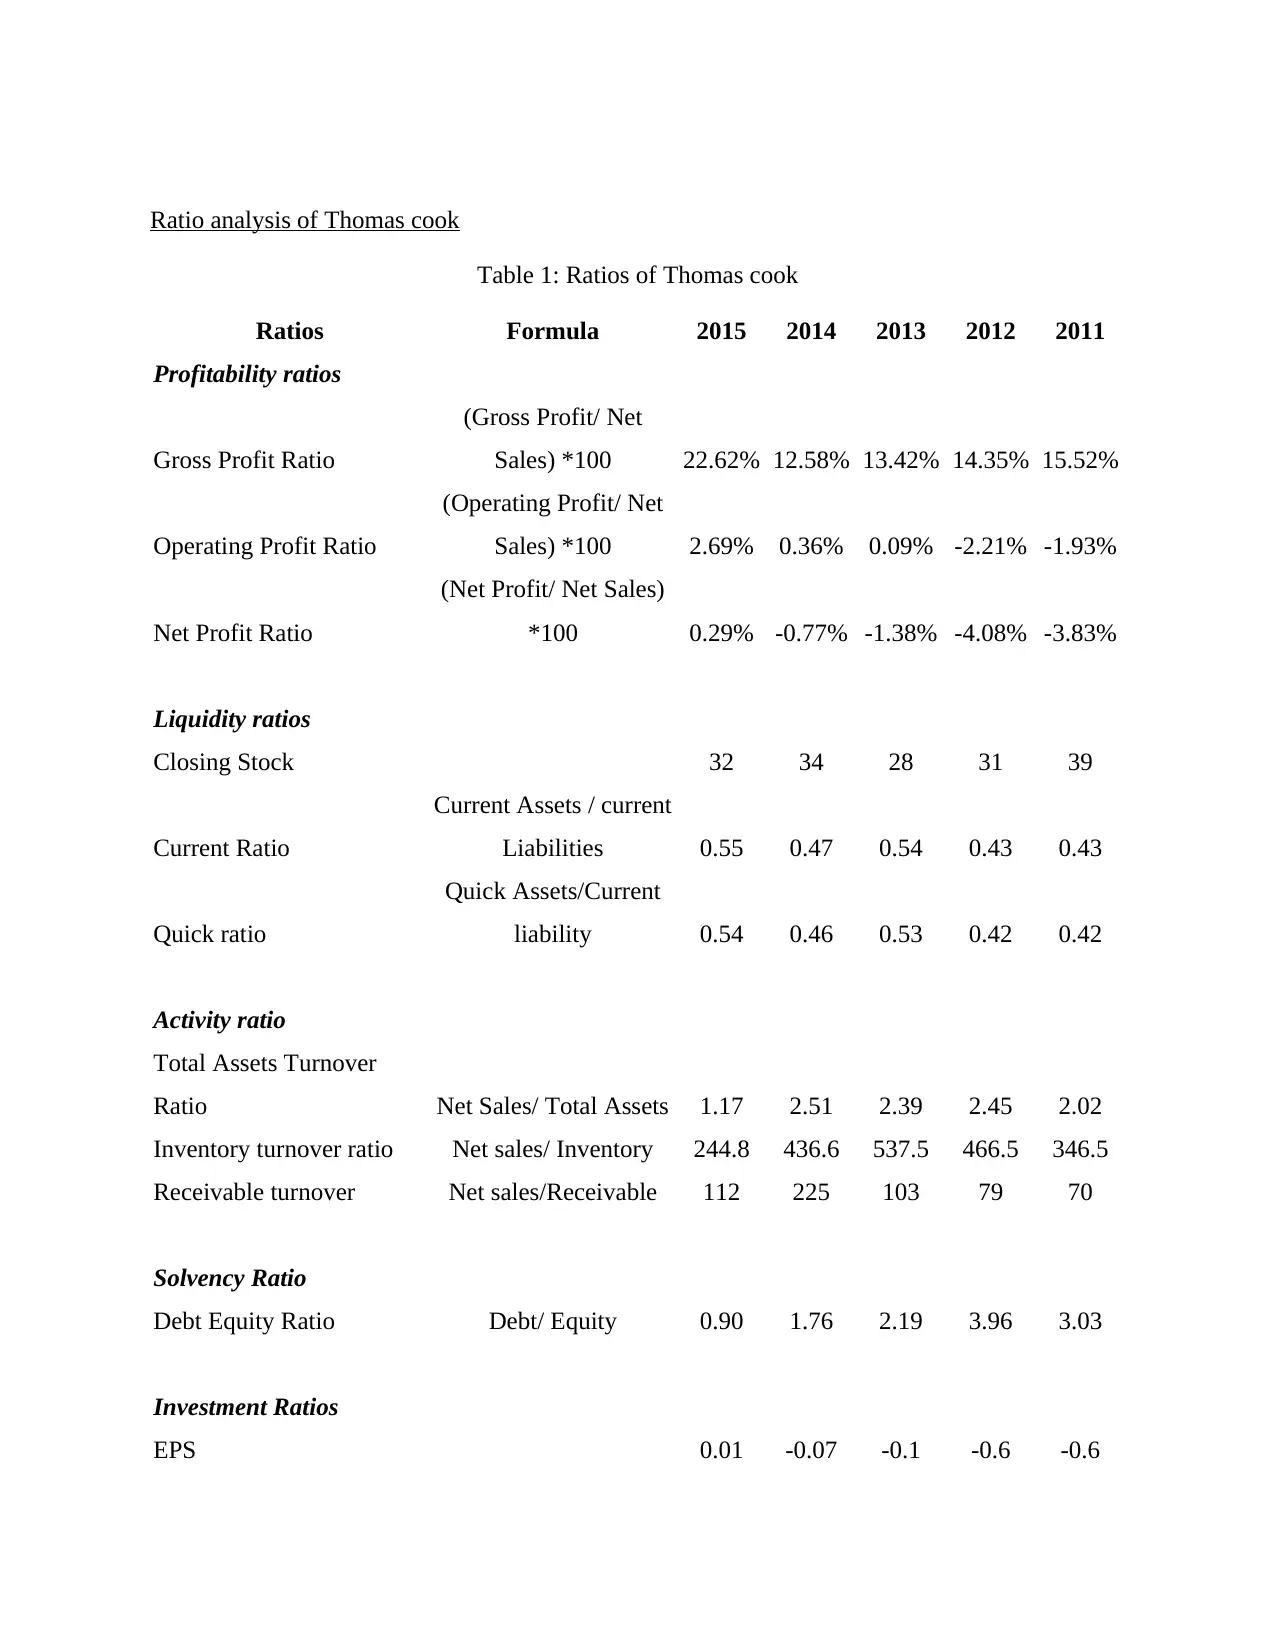
Ratio analysis of Thomas cook
Table 1: Ratios of Thomas cook
Ratios Formula 2015 2014 2013 2012 2011
Profitability ratios
Gross Profit Ratio
(Gross Profit/ Net
Sales) *100 22.62% 12.58% 13.42% 14.35% 15.52%
Operating Profit Ratio
(Operating Profit/ Net
Sales) *100 2.69% 0.36% 0.09% -2.21% -1.93%
Net Profit Ratio
(Net Profit/ Net Sales)
*100 0.29% -0.77% -1.38% -4.08% -3.83%
Liquidity ratios
Closing Stock 32 34 28 31 39
Current Ratio
Current Assets / current
Liabilities 0.55 0.47 0.54 0.43 0.43
Quick ratio
Quick Assets/Current
liability 0.54 0.46 0.53 0.42 0.42
Activity ratio
Total Assets Turnover
Ratio Net Sales/ Total Assets 1.17 2.51 2.39 2.45 2.02
Inventory turnover ratio Net sales/ Inventory 244.8 436.6 537.5 466.5 346.5
Receivable turnover Net sales/Receivable 112 225 103 79 70
Solvency Ratio
Debt Equity Ratio Debt/ Equity 0.90 1.76 2.19 3.96 3.03
Investment Ratios
EPS 0.01 -0.07 -0.1 -0.6 -0.6
P/E ratio
Current market
price/EPS 9309.91
-
2266.43 -661.25 -32.51 -114.28
Dividend yield ratio
DPS/Market value per
share 0 0 0 0
0.10144
92754
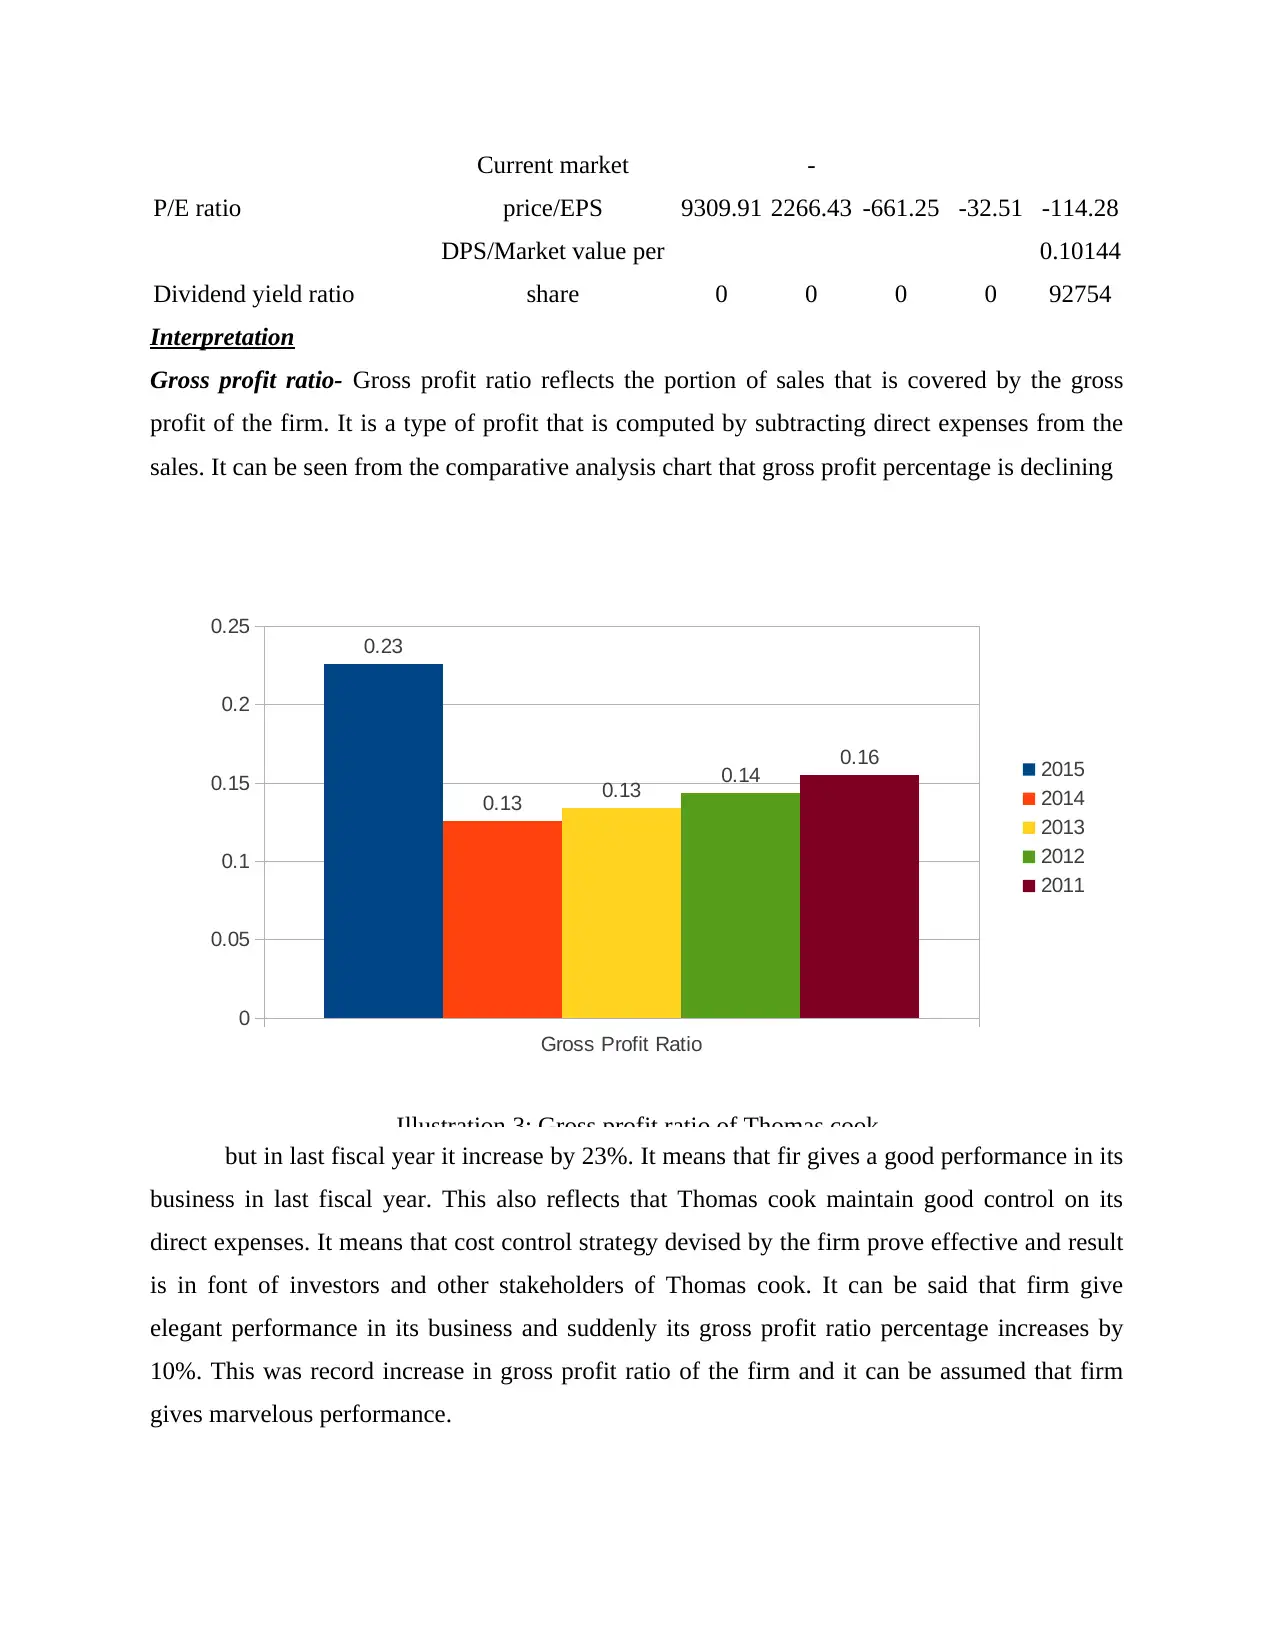
Interpretation
Gross profit ratio- Gross profit ratio reflects the portion of sales that is covered by the gross
profit of the firm. It is a type of profit that is computed by subtracting direct expenses from the
sales. It can be seen from the comparative analysis chart that gross profit percentage is declining
but in last fiscal year it increase by 23%. It means that fir gives a good performance in its
business in last fiscal year. This also reflects that Thomas cook maintain good control on its
direct expenses. It means that cost control strategy devised by the firm prove effective and result
is in font of investors and other stakeholders of Thomas cook. It can be said that firm give
elegant performance in its business and suddenly its gross profit ratio percentage increases by
10%. This was record increase in gross profit ratio of the firm and it can be assumed that firm
gives marvelous performance.
Gross Profit Ratio
0
0.05
0.1
0.15
0.2
0.25 0.23
0.13 0.13 0.14 0.16 2015
2014
2013
2012
2011
Illustration 3: Gross profit ratio of Thomas cook
Current market
price/EPS 9309.91
-
2266.43 -661.25 -32.51 -114.28
Dividend yield ratio
DPS/Market value per
share 0 0 0 0
0.10144
92754
Interpretation
Gross profit ratio- Gross profit ratio reflects the portion of sales that is covered by the gross
profit of the firm. It is a type of profit that is computed by subtracting direct expenses from the
sales. It can be seen from the comparative analysis chart that gross profit percentage is declining
but in last fiscal year it increase by 23%. It means that fir gives a good performance in its
business in last fiscal year. This also reflects that Thomas cook maintain good control on its
direct expenses. It means that cost control strategy devised by the firm prove effective and result
is in font of investors and other stakeholders of Thomas cook. It can be said that firm give
elegant performance in its business and suddenly its gross profit ratio percentage increases by
10%. This was record increase in gross profit ratio of the firm and it can be assumed that firm
gives marvelous performance.
Gross Profit Ratio
0
0.05
0.1
0.15
0.2
0.25 0.23
0.13 0.13 0.14 0.16 2015
2014
2013
2012
2011
Illustration 3: Gross profit ratio of Thomas cook
⊘ This is a preview!⊘
Do you want full access?
Subscribe today to unlock all pages.
Trusted by 1+ million students worldwide
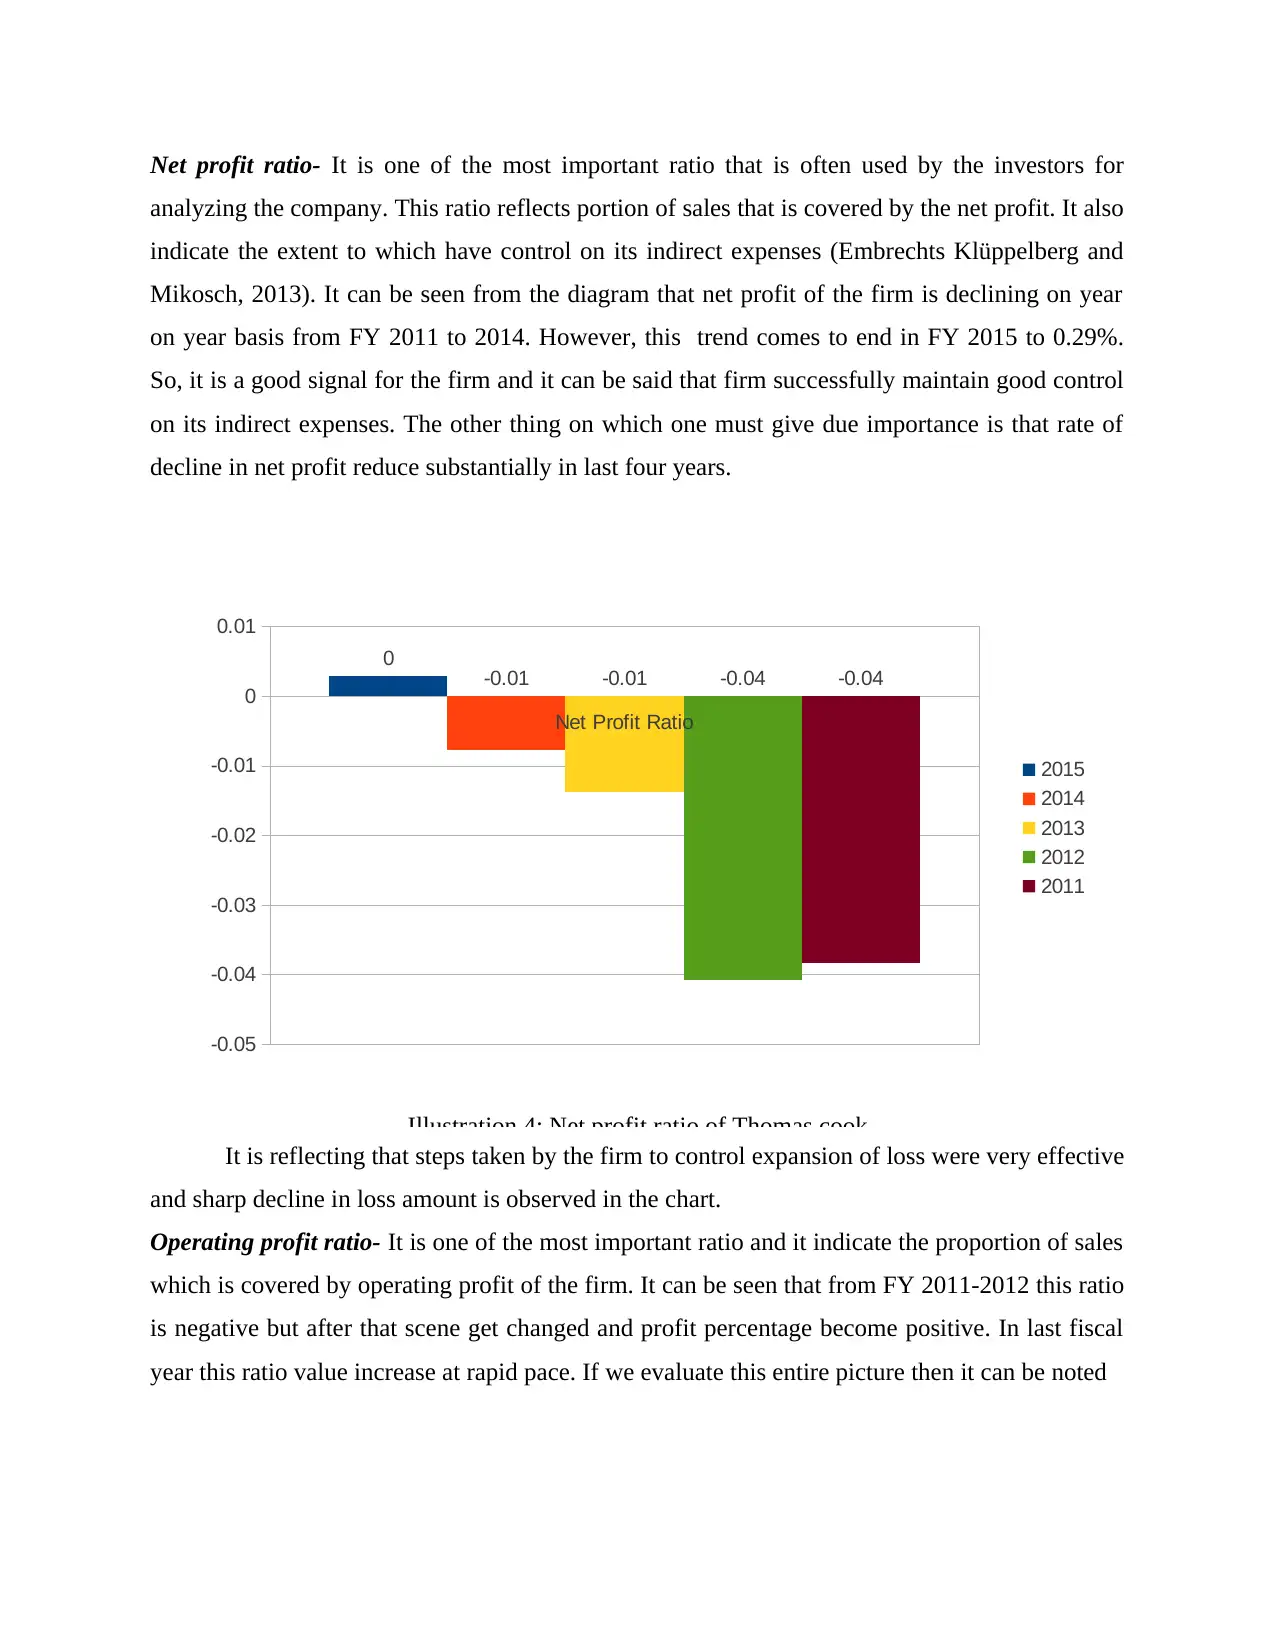
Net profit ratio- It is one of the most important ratio that is often used by the investors for
analyzing the company. This ratio reflects portion of sales that is covered by the net profit. It also
indicate the extent to which have control on its indirect expenses (Embrechts Klüppelberg and
Mikosch, 2013). It can be seen from the diagram that net profit of the firm is declining on year
on year basis from FY 2011 to 2014. However, this trend comes to end in FY 2015 to 0.29%.
So, it is a good signal for the firm and it can be said that firm successfully maintain good control
on its indirect expenses. The other thing on which one must give due importance is that rate of
decline in net profit reduce substantially in last four years.
It is reflecting that steps taken by the firm to control expansion of loss were very effective
and sharp decline in loss amount is observed in the chart.
Operating profit ratio- It is one of the most important ratio and it indicate the proportion of sales
which is covered by operating profit of the firm. It can be seen that from FY 2011-2012 this ratio
is negative but after that scene get changed and profit percentage become positive. In last fiscal
year this ratio value increase at rapid pace. If we evaluate this entire picture then it can be noted
Net Profit Ratio
-0.05
-0.04
-0.03
-0.02
-0.01
0
0.01
0 -0.01 -0.01 -0.04 -0.04
2015
2014
2013
2012
2011
Illustration 4: Net profit ratio of Thomas cook
Paraphrase This Document
Need a fresh take? Get an instant paraphrase of this document with our AI Paraphraser
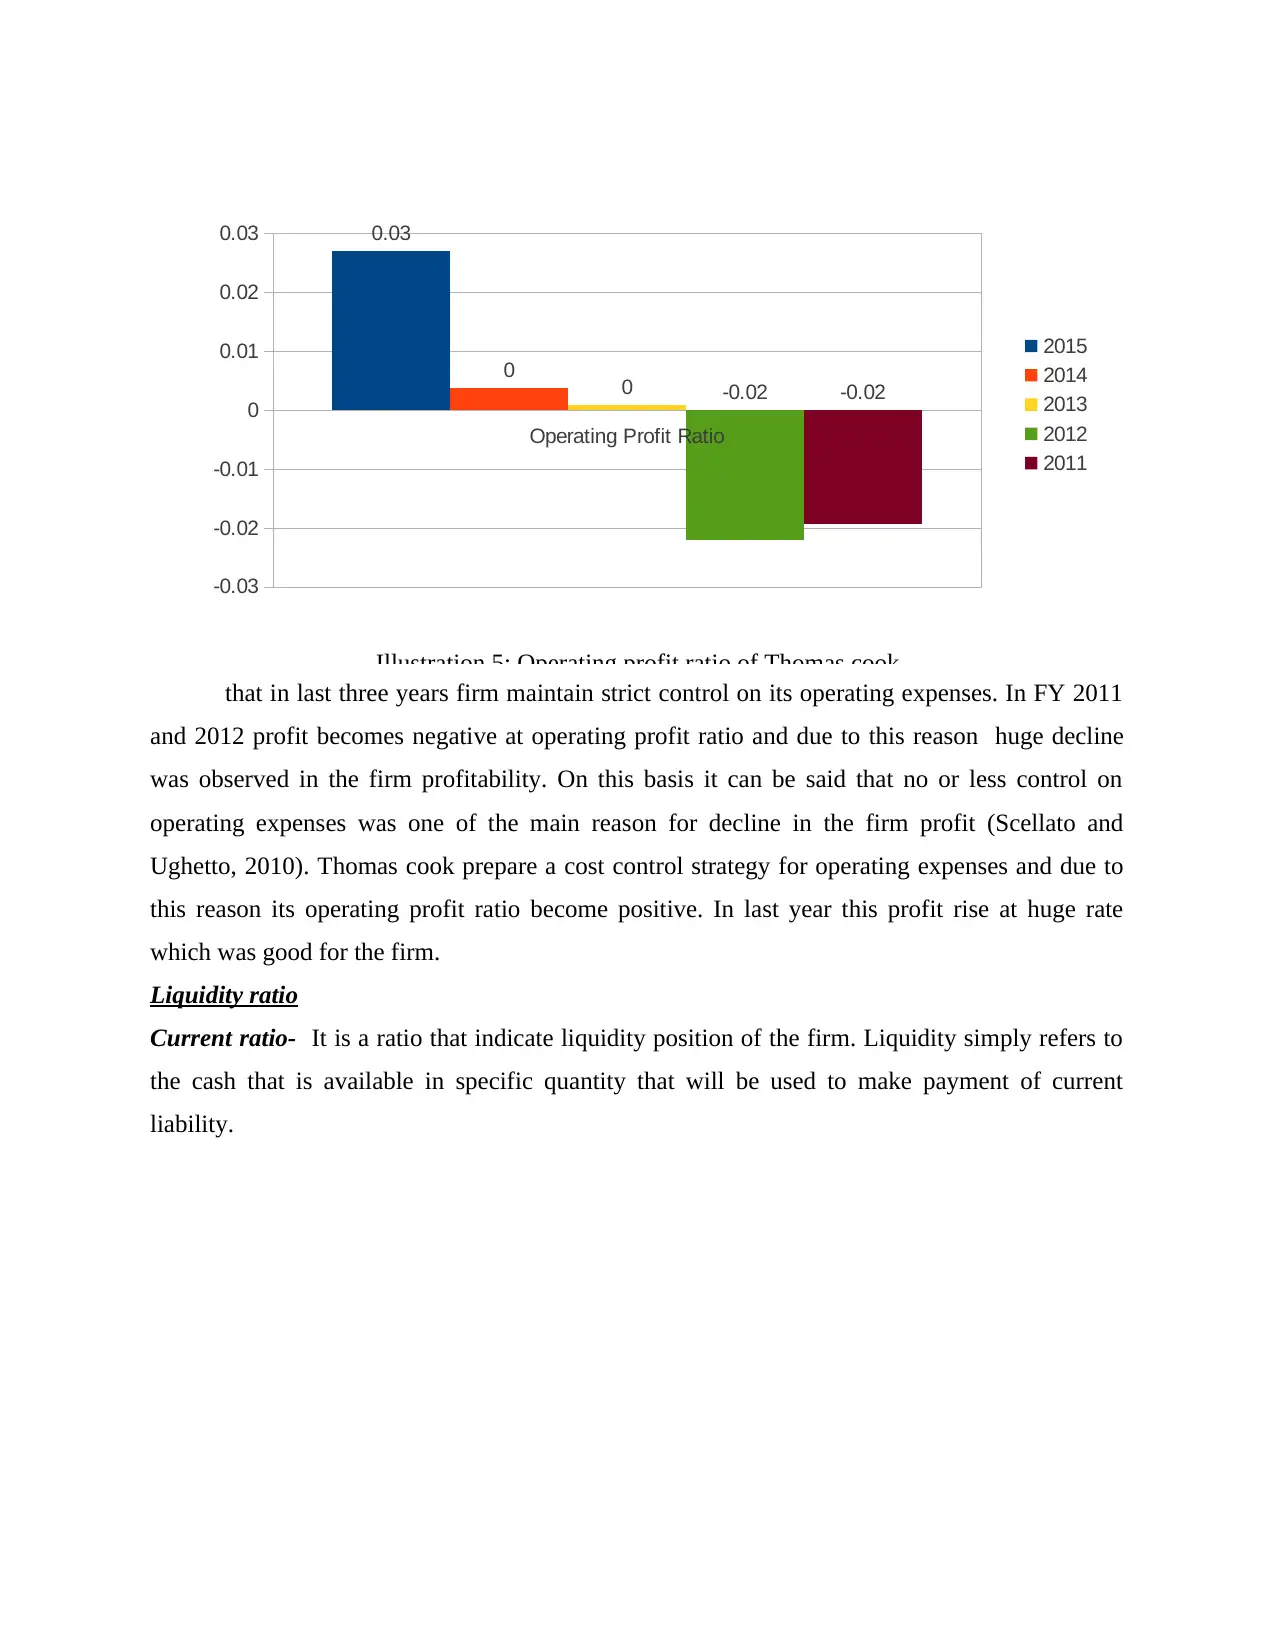
that in last three years firm maintain strict control on its operating expenses. In FY 2011
and 2012 profit becomes negative at operating profit ratio and due to this reason huge decline
was observed in the firm profitability. On this basis it can be said that no or less control on
operating expenses was one of the main reason for decline in the firm profit (Scellato and
Ughetto, 2010). Thomas cook prepare a cost control strategy for operating expenses and due to
this reason its operating profit ratio become positive. In last year this profit rise at huge rate
which was good for the firm.
Liquidity ratio
Current ratio- It is a ratio that indicate liquidity position of the firm. Liquidity simply refers to
the cash that is available in specific quantity that will be used to make payment of current
liability.
Operating Profit Ratio
-0.03
-0.02
-0.01
0
0.01
0.02
0.03 0.03
0 0 -0.02 -0.02
2015
2014
2013
2012
2011
Illustration 5: Operating profit ratio of Thomas cook
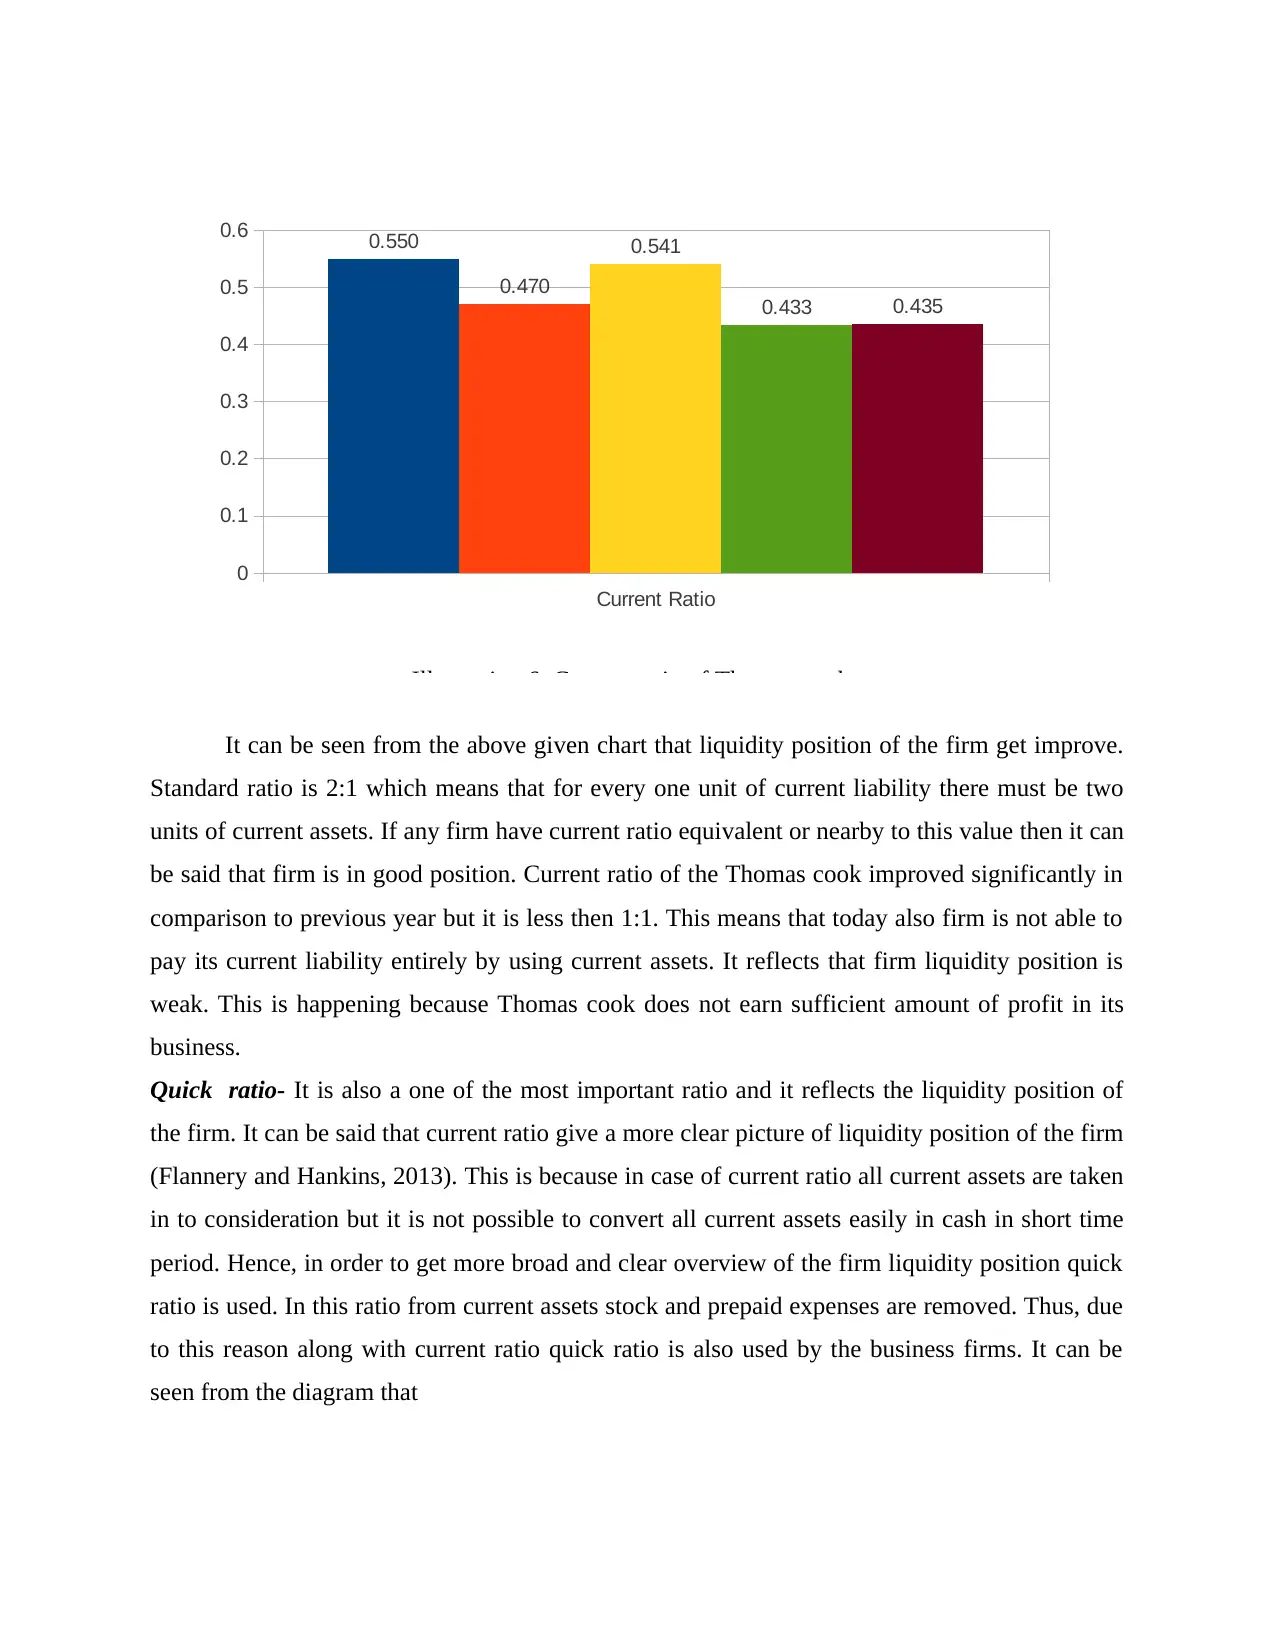
It can be seen from the above given chart that liquidity position of the firm get improve.
Standard ratio is 2:1 which means that for every one unit of current liability there must be two
units of current assets. If any firm have current ratio equivalent or nearby to this value then it can
be said that firm is in good position. Current ratio of the Thomas cook improved significantly in
comparison to previous year but it is less then 1:1. This means that today also firm is not able to
pay its current liability entirely by using current assets. It reflects that firm liquidity position is
weak. This is happening because Thomas cook does not earn sufficient amount of profit in its
business.
Quick ratio- It is also a one of the most important ratio and it reflects the liquidity position of
the firm. It can be said that current ratio give a more clear picture of liquidity position of the firm
(Flannery and Hankins, 2013). This is because in case of current ratio all current assets are taken
in to consideration but it is not possible to convert all current assets easily in cash in short time
period. Hence, in order to get more broad and clear overview of the firm liquidity position quick
ratio is used. In this ratio from current assets stock and prepaid expenses are removed. Thus, due
to this reason along with current ratio quick ratio is also used by the business firms. It can be
seen from the diagram that
Current Ratio
0
0.1
0.2
0.3
0.4
0.5
0.6 0.550
0.470
0.541
0.433 0.435
2015
2014
2013
2012
2011
Illustration 6: Current ratio of Thomas cook
⊘ This is a preview!⊘
Do you want full access?
Subscribe today to unlock all pages.
Trusted by 1+ million students worldwide
1 out of 25
Related Documents


Your All-in-One AI-Powered Toolkit for Academic Success.
+13062052269
info@desklib.com
Available 24*7 on WhatsApp / Email
![[object Object]](/_next/static/media/star-bottom.7253800d.svg)
Unlock your academic potential
Copyright © 2020–2026 A2Z Services. All Rights Reserved. Developed and managed by ZUCOL.