UNL1004 Economics: Supply, Demand, and Elasticity in UK Market
VerifiedAdded on 2023/06/12
|12
|2573
|345
Report
AI Summary
This report analyzes the supply and demand dynamics in the UK market during November and December, focusing on the impact of factors like raw material shortages and increased demand for Christmas products. It uses supply and demand equilibrium diagrams to illustrate various scenarios, including shifts in supply and demand curves due to changes in price and non-price factors. The report also examines the elasticity of supply and demand, differentiating between elastic and inelastic conditions and providing examples relevant to the UK market. The analysis considers the influence of events like the Christmas season and the pandemic on market equilibrium and consumer behavior. The report is designed to give a clear understanding of how economic theory applies to real-world market conditions.
Situation of UK November and
December
December
Paraphrase This Document
Need a fresh take? Get an instant paraphrase of this document with our AI Paraphraser
Table of Contents
INTRODUCTION...........................................................................................................................2
MAIN BODY..................................................................................................................................2
1 A basic supply and demand equilibrium diagrams...................................................................2
2 Supply shifting to the right.......................................................................................................3
3 Supply to the left.......................................................................................................................4
4 Demand to the right..................................................................................................................5
5 Demand to the left....................................................................................................................6
6 Elastic supply............................................................................................................................7
7 Inelastic supply.........................................................................................................................8
8 Elastic demand..........................................................................................................................9
9 Inelastic demand.....................................................................................................................10
CONCLUSION..............................................................................................................................10
REFERENCES..............................................................................................................................11
INTRODUCTION
The demand and supply of product can be affected by many factors so that it can change
rightwards and leftwards direction according to the market price (Arshed and Kalim, 2021). The
presents report is based on the situations of UK in the month November and December in which
there are many Christmas products are getting shortage because the supply of raw material are
comparative less. Also, report identifying the factor by which demand and supply are affected
and then applying the hand made diagram of different situation in the market. Further, study will
support the elasticity of the supply and demand of Christmas products with the help of presenting
diagrams.
MAIN BODY
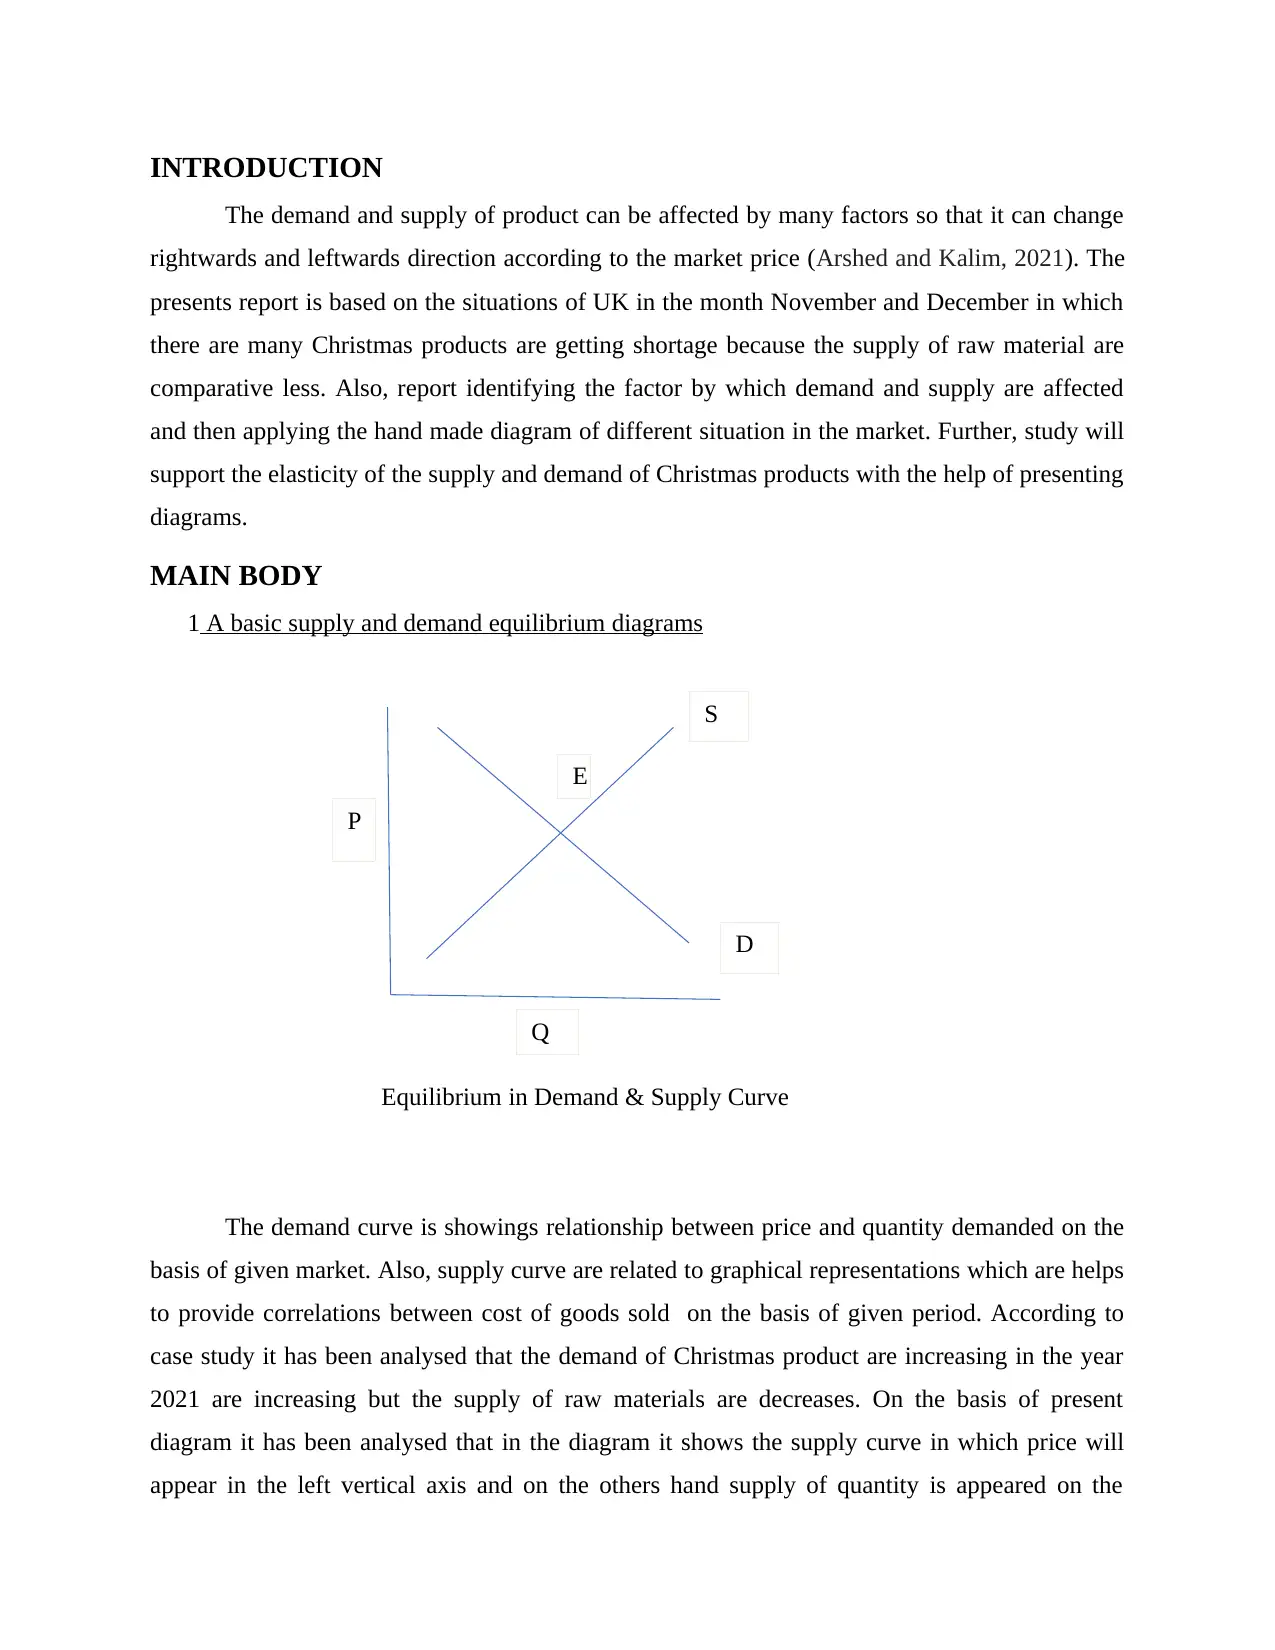
1 A basic supply and demand equilibrium diagrams
Equilibrium in Demand & Supply Curve
The demand curve is showings relationship between price and quantity demanded on the
basis of given market. Also, supply curve are related to graphical representations which are helps
to provide correlations between cost of goods sold on the basis of given period. According to
case study it has been analysed that the demand of Christmas product are increasing in the year
2021 are increasing but the supply of raw materials are decreases. On the basis of present
diagram it has been analysed that in the diagram it shows the supply curve in which price will
appear in the left vertical axis and on the others hand supply of quantity is appeared on the
D
S
Q
P
E
The demand and supply of product can be affected by many factors so that it can change
rightwards and leftwards direction according to the market price (Arshed and Kalim, 2021). The
presents report is based on the situations of UK in the month November and December in which
there are many Christmas products are getting shortage because the supply of raw material are
comparative less. Also, report identifying the factor by which demand and supply are affected
and then applying the hand made diagram of different situation in the market. Further, study will
support the elasticity of the supply and demand of Christmas products with the help of presenting
diagrams.
MAIN BODY
1 A basic supply and demand equilibrium diagrams
Equilibrium in Demand & Supply Curve
The demand curve is showings relationship between price and quantity demanded on the
basis of given market. Also, supply curve are related to graphical representations which are helps
to provide correlations between cost of goods sold on the basis of given period. According to
case study it has been analysed that the demand of Christmas product are increasing in the year
2021 are increasing but the supply of raw materials are decreases. On the basis of present
diagram it has been analysed that in the diagram it shows the supply curve in which price will
appear in the left vertical axis and on the others hand supply of quantity is appeared on the
D
S
Q
P
E
⊘ This is a preview!⊘
Do you want full access?
Subscribe today to unlock all pages.
Trusted by 1+ million students worldwide
horizontal axis. At the points of demand and supply curve are meet it will help to provide the
point of equilibrium in which quantity demanded and supply of the product are equal buts the
price of the product are constant at that situation (Brinca, Duarte and Faria-e-Castro, 2020).
However, it has been identified that there is inverse relationship for the price of good and supply
but when the price of the goods are increases whereas the demand are remained same. Also, it
affects the demand and supply equilibrium by decreasing the price and increasing the quantity of
product.
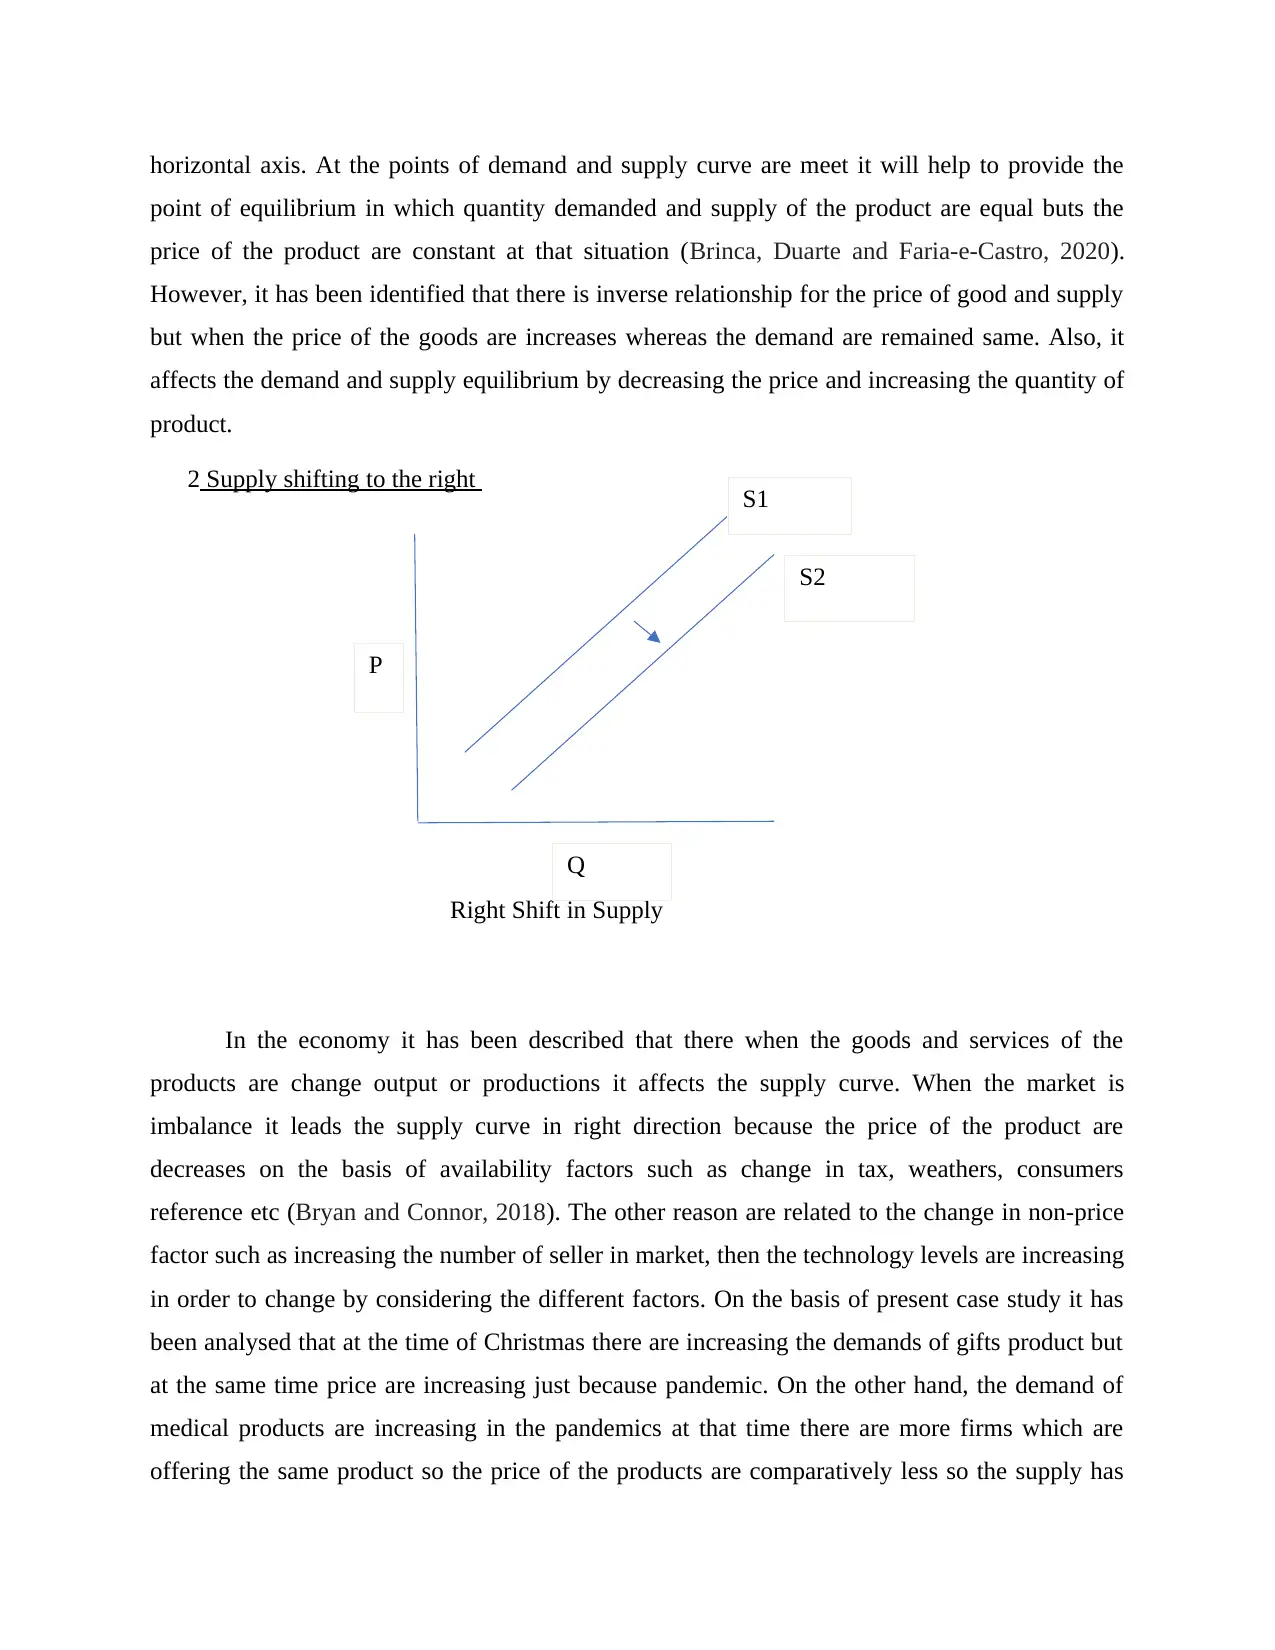
2 Supply shifting to the right
Right Shift in Supply
In the economy it has been described that there when the goods and services of the
products are change output or productions it affects the supply curve. When the market is
imbalance it leads the supply curve in right direction because the price of the product are
decreases on the basis of availability factors such as change in tax, weathers, consumers
reference etc (Bryan and Connor, 2018). The other reason are related to the change in non-price
factor such as increasing the number of seller in market, then the technology levels are increasing
in order to change by considering the different factors. On the basis of present case study it has
been analysed that at the time of Christmas there are increasing the demands of gifts product but
at the same time price are increasing just because pandemic. On the other hand, the demand of
medical products are increasing in the pandemics at that time there are more firms which are
offering the same product so the price of the products are comparatively less so the supply has
P
Q
S1
S2
point of equilibrium in which quantity demanded and supply of the product are equal buts the
price of the product are constant at that situation (Brinca, Duarte and Faria-e-Castro, 2020).
However, it has been identified that there is inverse relationship for the price of good and supply
but when the price of the goods are increases whereas the demand are remained same. Also, it
affects the demand and supply equilibrium by decreasing the price and increasing the quantity of
product.
2 Supply shifting to the right
Right Shift in Supply
In the economy it has been described that there when the goods and services of the
products are change output or productions it affects the supply curve. When the market is
imbalance it leads the supply curve in right direction because the price of the product are
decreases on the basis of availability factors such as change in tax, weathers, consumers
reference etc (Bryan and Connor, 2018). The other reason are related to the change in non-price
factor such as increasing the number of seller in market, then the technology levels are increasing
in order to change by considering the different factors. On the basis of present case study it has
been analysed that at the time of Christmas there are increasing the demands of gifts product but
at the same time price are increasing just because pandemic. On the other hand, the demand of
medical products are increasing in the pandemics at that time there are more firms which are
offering the same product so the price of the products are comparatively less so the supply has
P
Q
S1
S2
Paraphrase This Document
Need a fresh take? Get an instant paraphrase of this document with our AI Paraphraser
directly increases and it has shifted to right ward direction. According to the above diagram it
has been presented that due to other factor the supply curve shifts S1 to S2. When the price of the
product is constant but other factors are change such as technology, preference of consumers,
environmental factor etc ( Reynolds and Sethi, 2021).
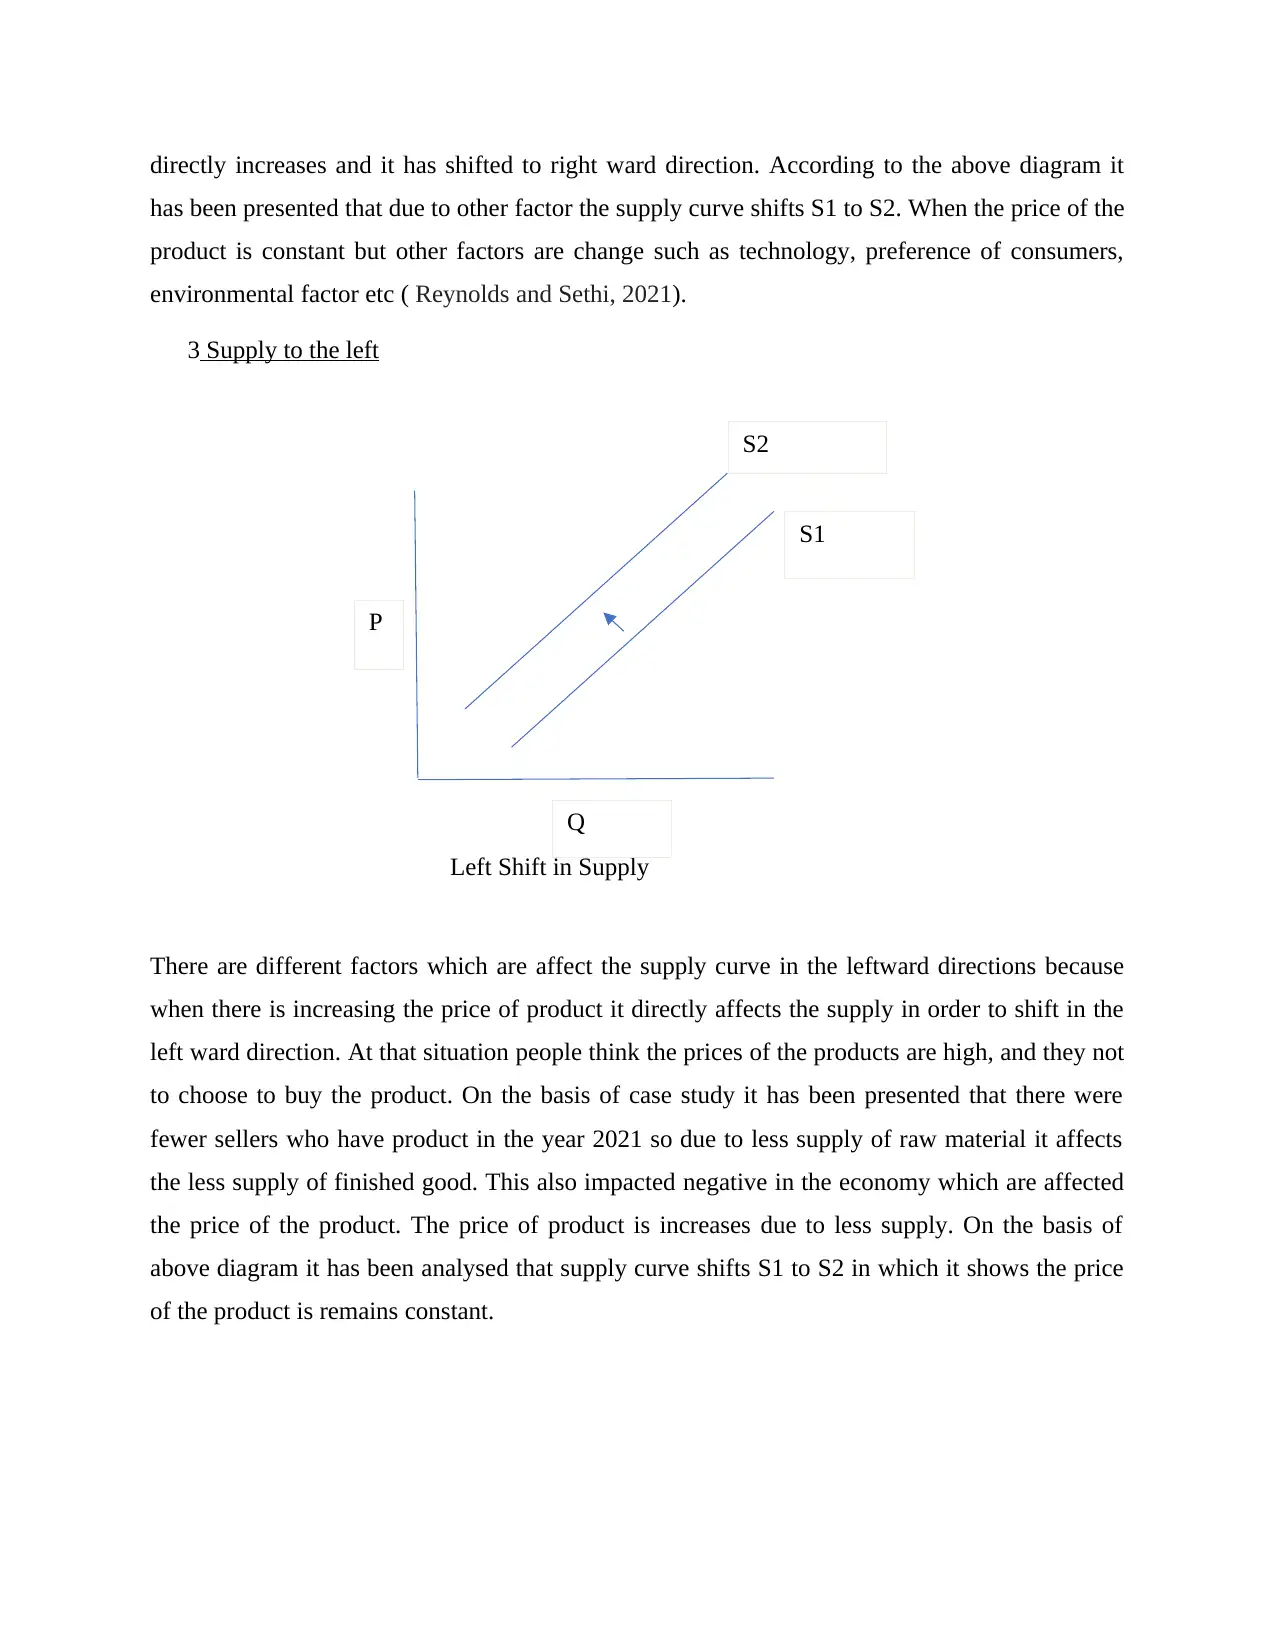
3 Supply to the left
Left Shift in Supply
There are different factors which are affect the supply curve in the leftward directions because
when there is increasing the price of product it directly affects the supply in order to shift in the
left ward direction. At that situation people think the prices of the products are high, and they not
to choose to buy the product. On the basis of case study it has been presented that there were
fewer sellers who have product in the year 2021 so due to less supply of raw material it affects
the less supply of finished good. This also impacted negative in the economy which are affected
the price of the product. The price of product is increases due to less supply. On the basis of
above diagram it has been analysed that supply curve shifts S1 to S2 in which it shows the price
of the product is remains constant.
P
Q
S1
S2
has been presented that due to other factor the supply curve shifts S1 to S2. When the price of the
product is constant but other factors are change such as technology, preference of consumers,
environmental factor etc ( Reynolds and Sethi, 2021).
3 Supply to the left
Left Shift in Supply
There are different factors which are affect the supply curve in the leftward directions because
when there is increasing the price of product it directly affects the supply in order to shift in the
left ward direction. At that situation people think the prices of the products are high, and they not
to choose to buy the product. On the basis of case study it has been presented that there were
fewer sellers who have product in the year 2021 so due to less supply of raw material it affects
the less supply of finished good. This also impacted negative in the economy which are affected
the price of the product. The price of product is increases due to less supply. On the basis of
above diagram it has been analysed that supply curve shifts S1 to S2 in which it shows the price
of the product is remains constant.
P
Q
S1
S2
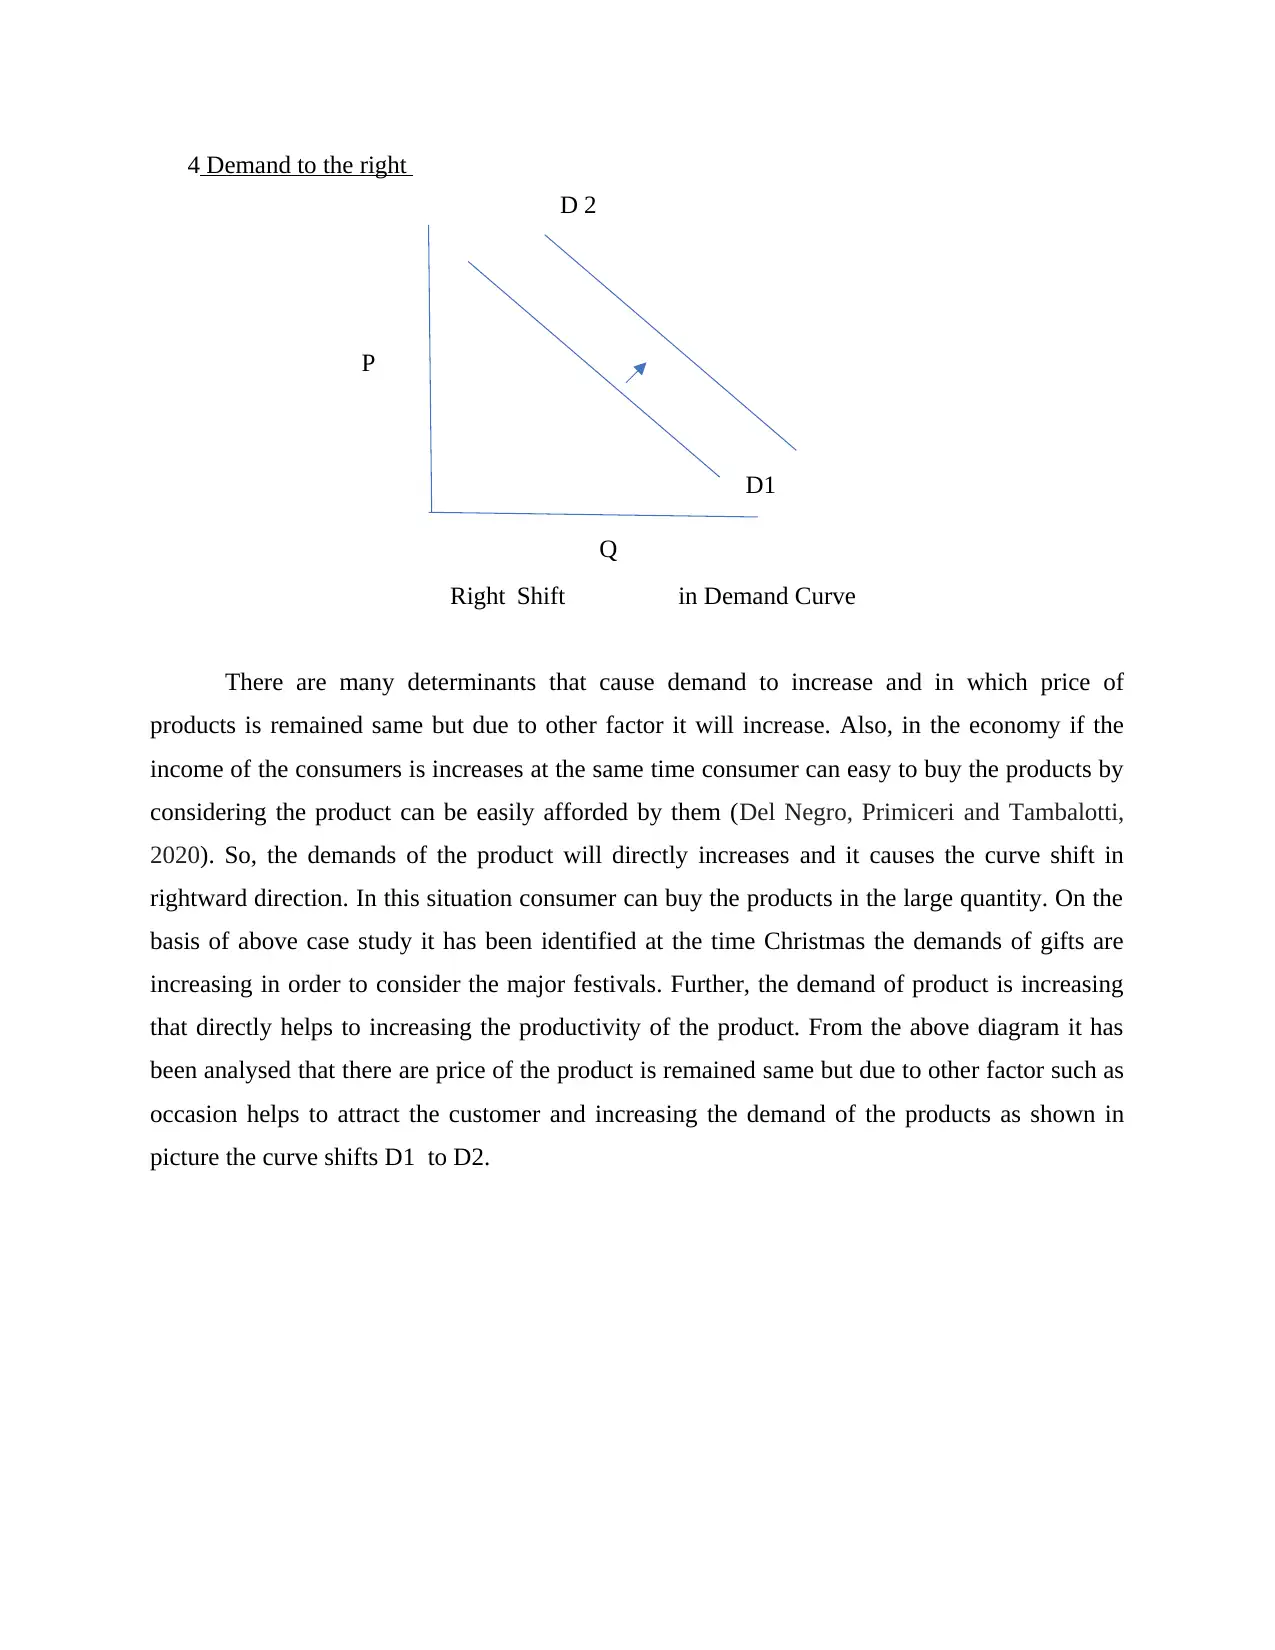
4 Demand to the right
Right Shift in Demand Curve
There are many determinants that cause demand to increase and in which price of
products is remained same but due to other factor it will increase. Also, in the economy if the
income of the consumers is increases at the same time consumer can easy to buy the products by
considering the product can be easily afforded by them (Del Negro, Primiceri and Tambalotti,
2020). So, the demands of the product will directly increases and it causes the curve shift in
rightward direction. In this situation consumer can buy the products in the large quantity. On the
basis of above case study it has been identified at the time Christmas the demands of gifts are
increasing in order to consider the major festivals. Further, the demand of product is increasing
that directly helps to increasing the productivity of the product. From the above diagram it has
been analysed that there are price of the product is remained same but due to other factor such as
occasion helps to attract the customer and increasing the demand of the products as shown in
picture the curve shifts D1 to D2.
D1
D 2
P
Q
⊘ This is a preview!⊘
Do you want full access?
Subscribe today to unlock all pages.
Trusted by 1+ million students worldwide
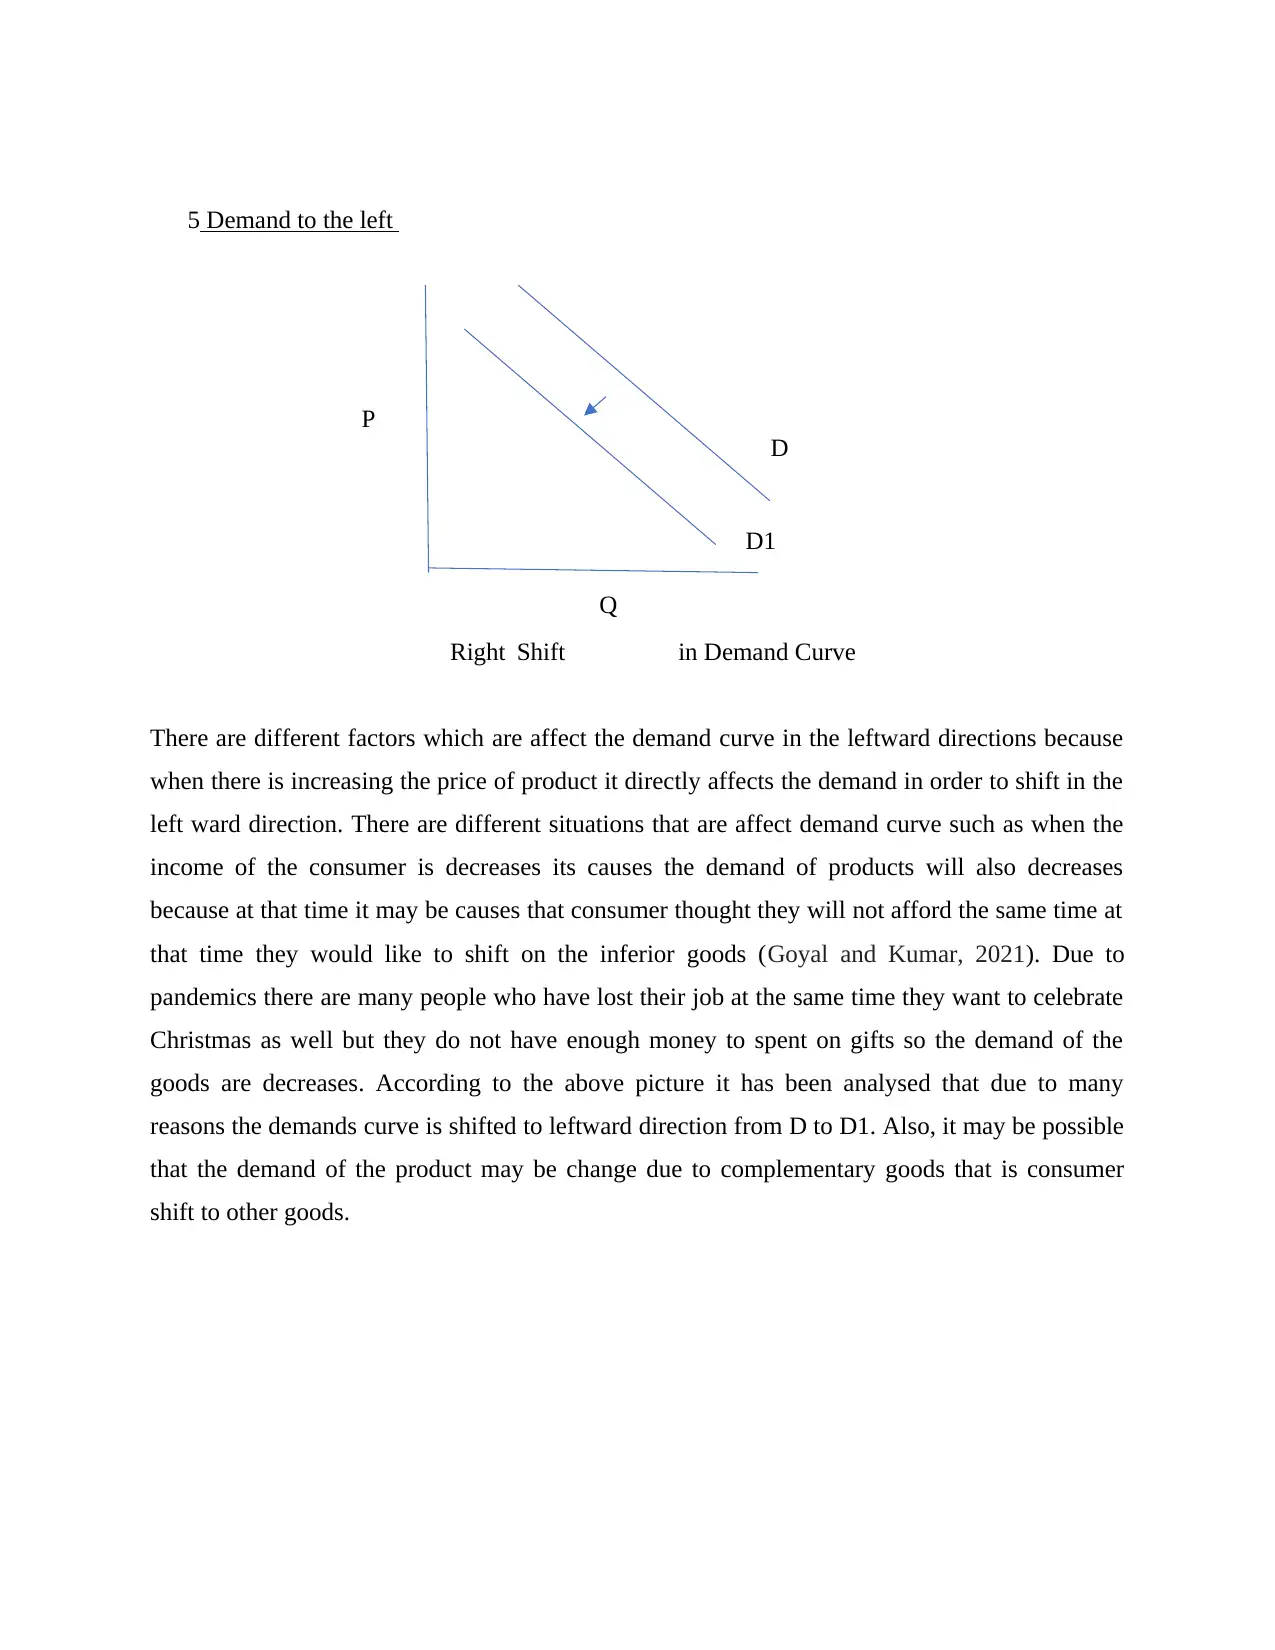
5 Demand to the left
Right Shift in Demand Curve
There are different factors which are affect the demand curve in the leftward directions because
when there is increasing the price of product it directly affects the demand in order to shift in the
left ward direction. There are different situations that are affect demand curve such as when the
income of the consumer is decreases its causes the demand of products will also decreases
because at that time it may be causes that consumer thought they will not afford the same time at
that time they would like to shift on the inferior goods (Goyal and Kumar, 2021). Due to
pandemics there are many people who have lost their job at the same time they want to celebrate
Christmas as well but they do not have enough money to spent on gifts so the demand of the
goods are decreases. According to the above picture it has been analysed that due to many
reasons the demands curve is shifted to leftward direction from D to D1. Also, it may be possible
that the demand of the product may be change due to complementary goods that is consumer
shift to other goods.
D1
P
Q
D
Paraphrase This Document
Need a fresh take? Get an instant paraphrase of this document with our AI Paraphraser
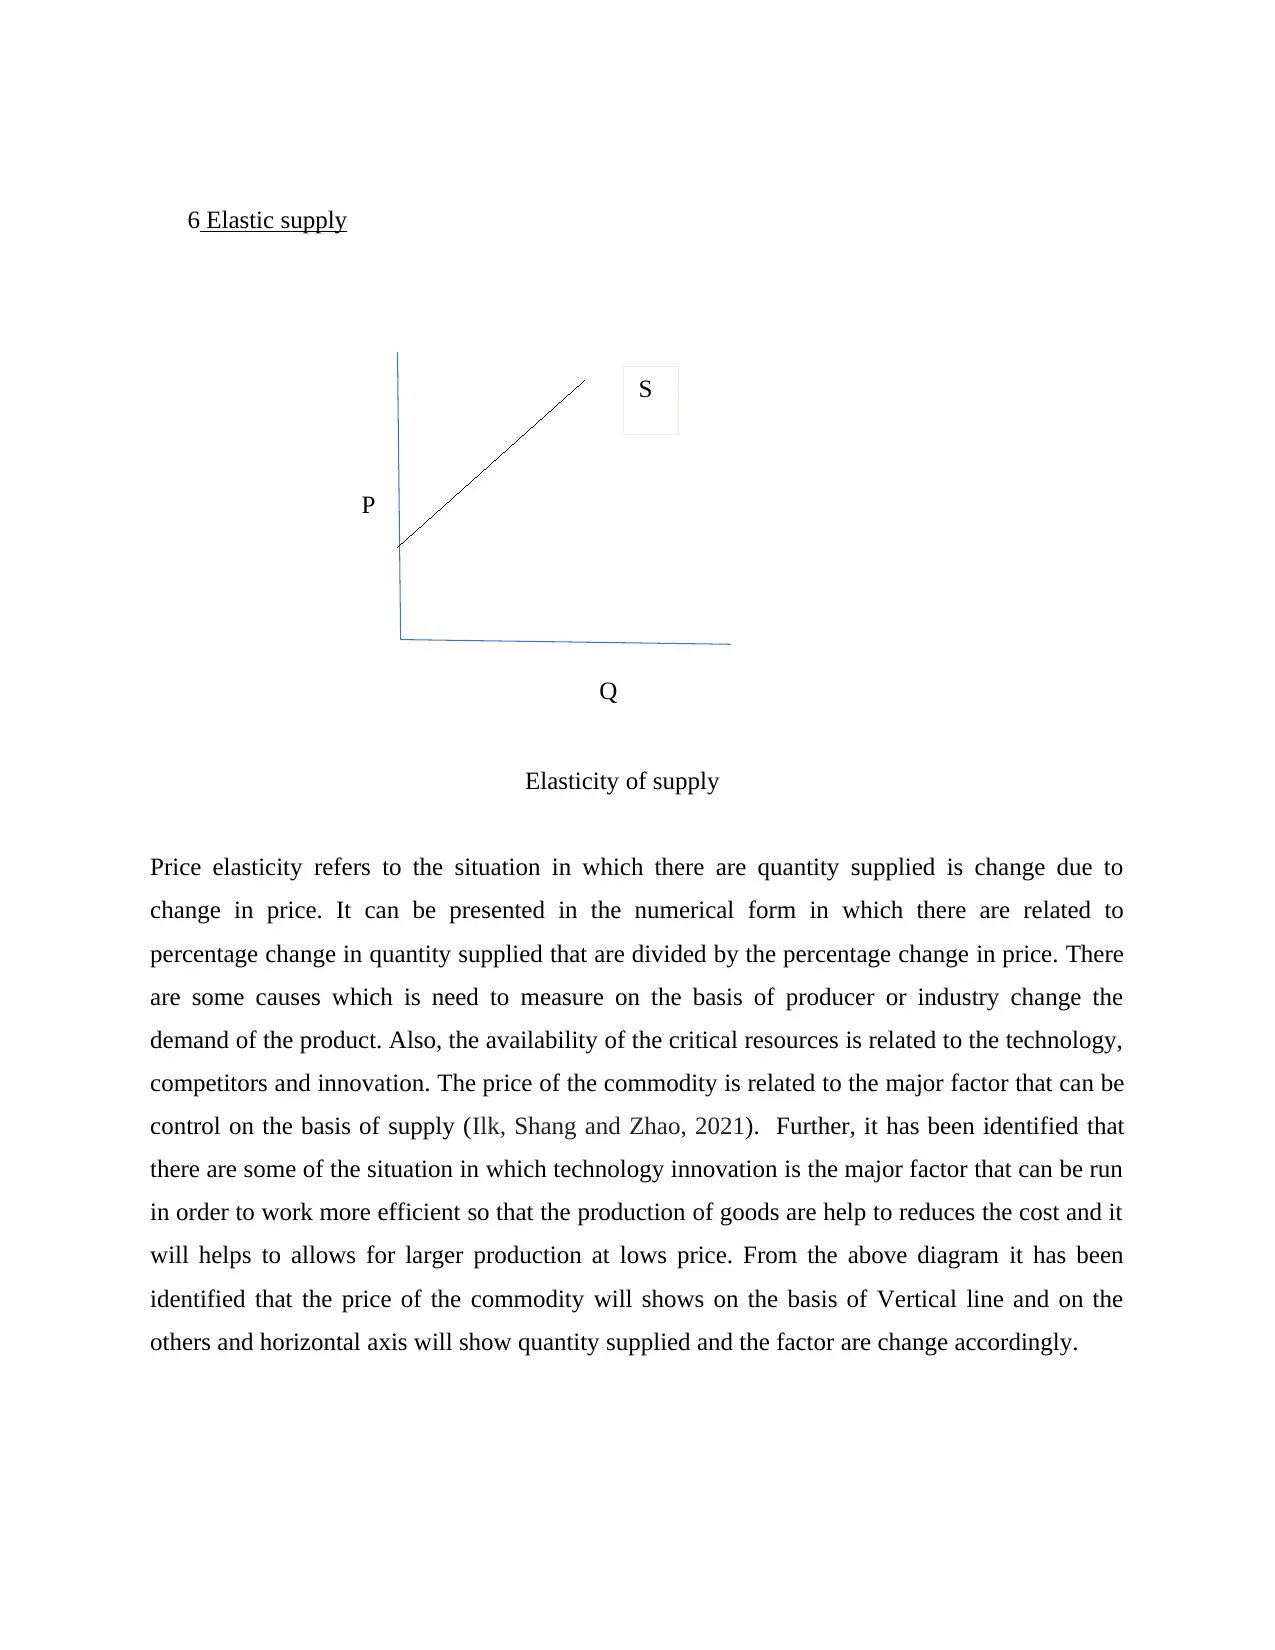
6 Elastic supply
Elasticity of supply
Price elasticity refers to the situation in which there are quantity supplied is change due to
change in price. It can be presented in the numerical form in which there are related to
percentage change in quantity supplied that are divided by the percentage change in price. There
are some causes which is need to measure on the basis of producer or industry change the
demand of the product. Also, the availability of the critical resources is related to the technology,
competitors and innovation. The price of the commodity is related to the major factor that can be
control on the basis of supply (Ilk, Shang and Zhao, 2021). Further, it has been identified that
there are some of the situation in which technology innovation is the major factor that can be run
in order to work more efficient so that the production of goods are help to reduces the cost and it
will helps to allows for larger production at lows price. From the above diagram it has been
identified that the price of the commodity will shows on the basis of Vertical line and on the
others and horizontal axis will show quantity supplied and the factor are change accordingly.
P
Q
S
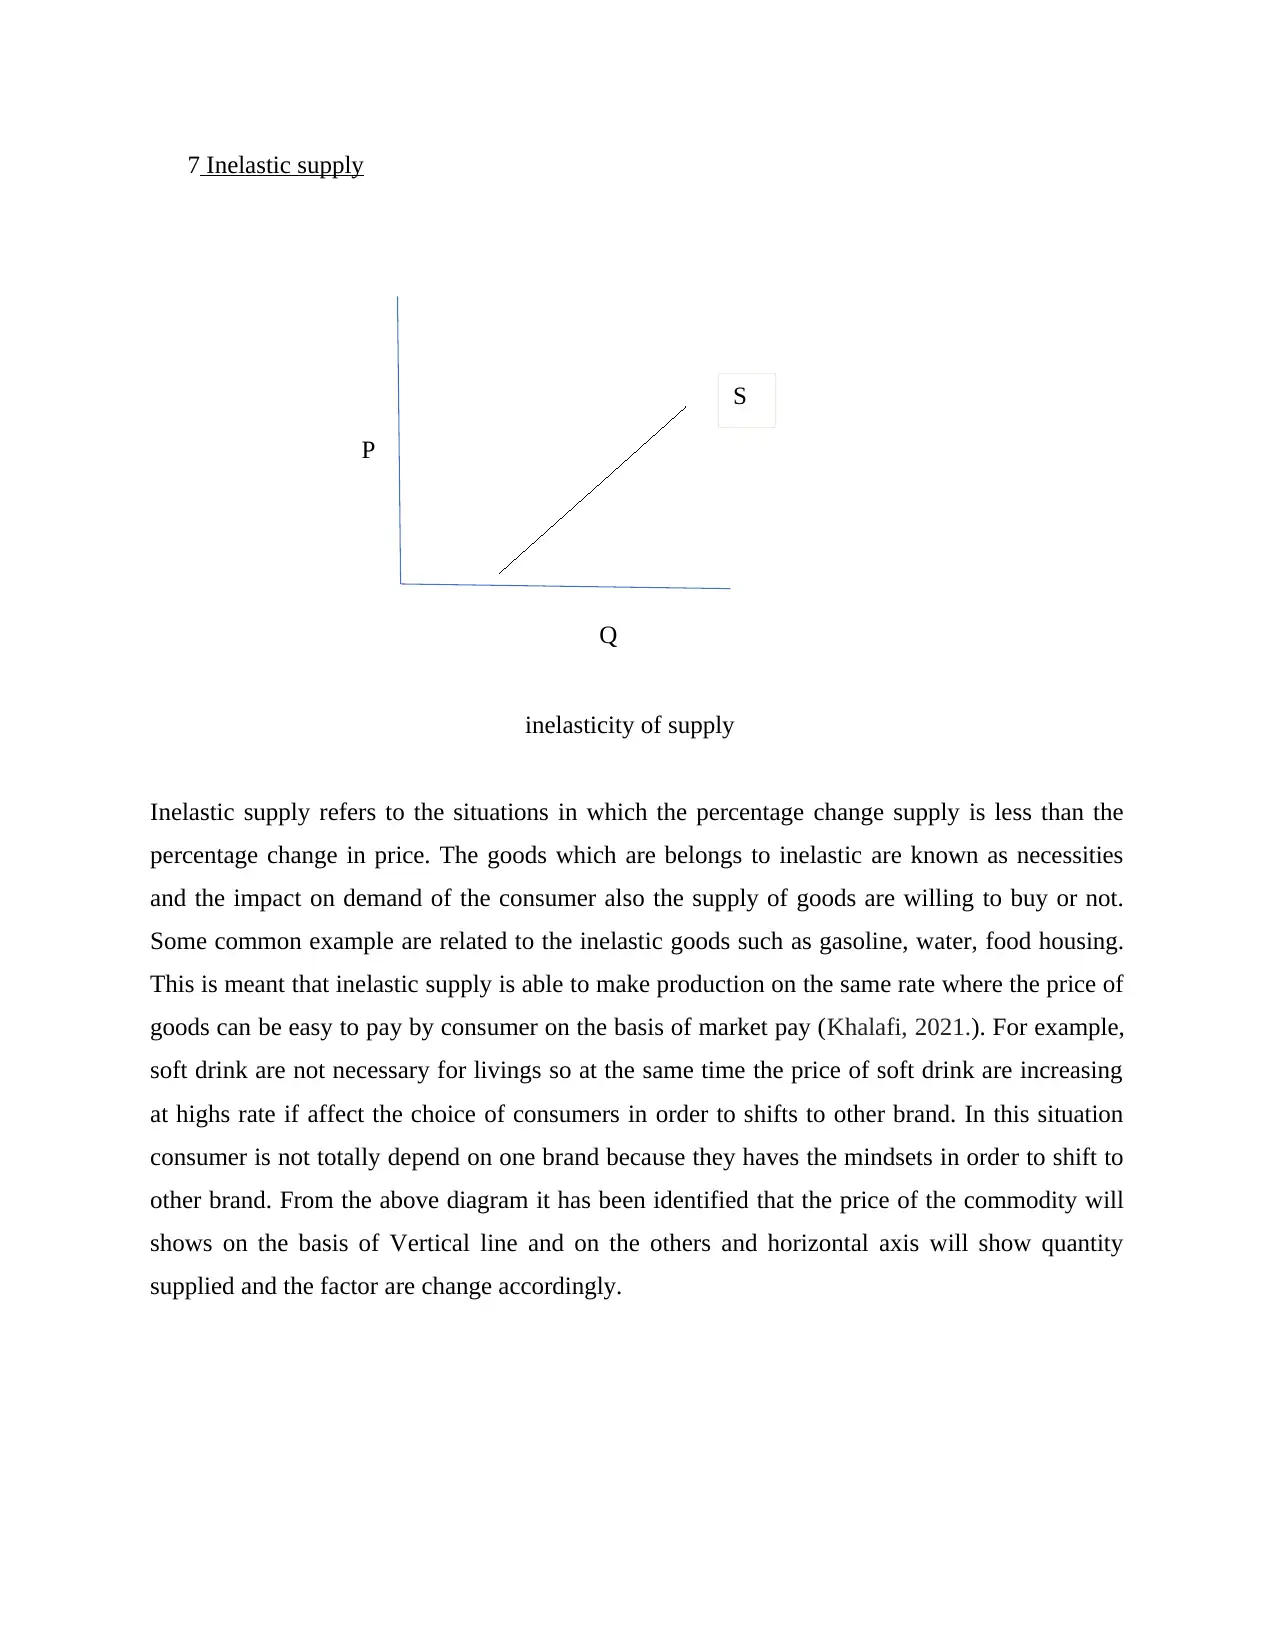
7 Inelastic supply
inelasticity of supply
Inelastic supply refers to the situations in which the percentage change supply is less than the
percentage change in price. The goods which are belongs to inelastic are known as necessities
and the impact on demand of the consumer also the supply of goods are willing to buy or not.
Some common example are related to the inelastic goods such as gasoline, water, food housing.
This is meant that inelastic supply is able to make production on the same rate where the price of
goods can be easy to pay by consumer on the basis of market pay (Khalafi, 2021.). For example,
soft drink are not necessary for livings so at the same time the price of soft drink are increasing
at highs rate if affect the choice of consumers in order to shifts to other brand. In this situation
consumer is not totally depend on one brand because they haves the mindsets in order to shift to
other brand. From the above diagram it has been identified that the price of the commodity will
shows on the basis of Vertical line and on the others and horizontal axis will show quantity
supplied and the factor are change accordingly.
P
Q
S
⊘ This is a preview!⊘
Do you want full access?
Subscribe today to unlock all pages.
Trusted by 1+ million students worldwide
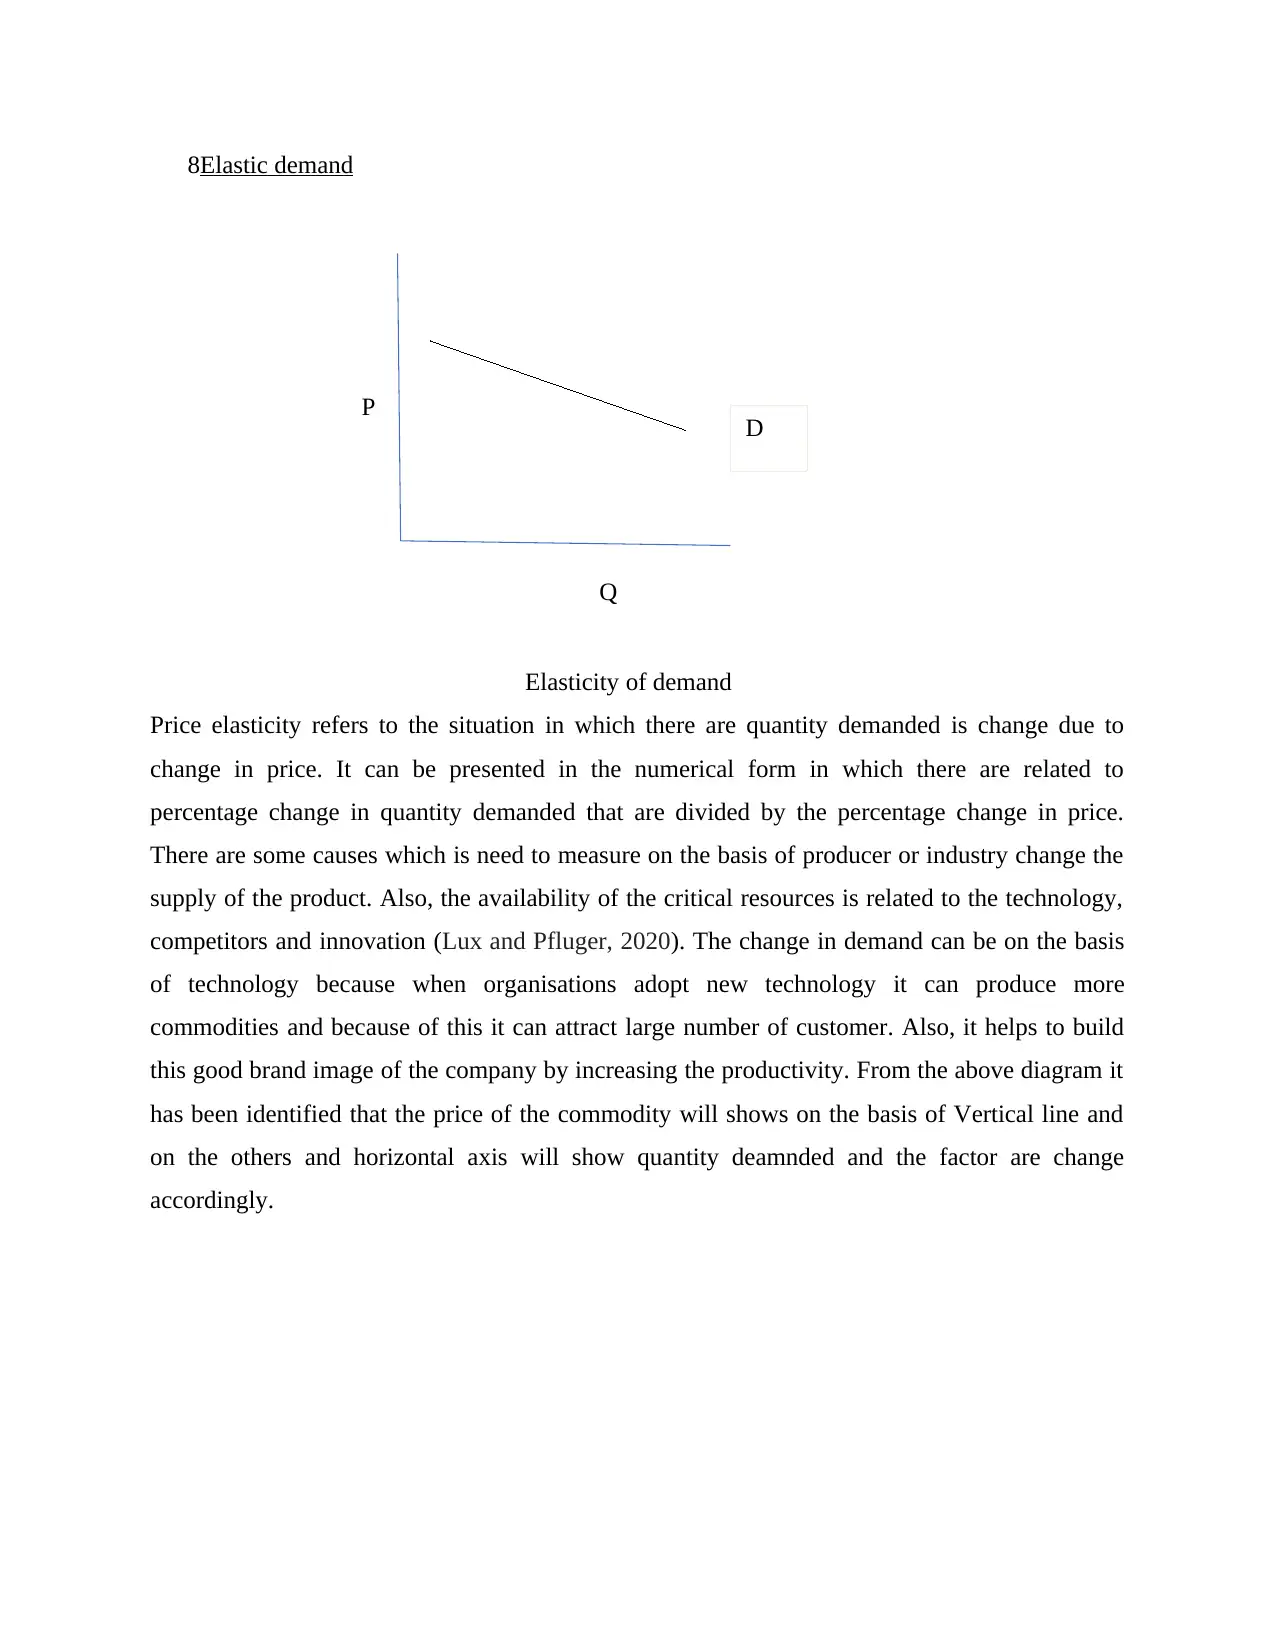
8Elastic demand
Elasticity of demand
Price elasticity refers to the situation in which there are quantity demanded is change due to
change in price. It can be presented in the numerical form in which there are related to
percentage change in quantity demanded that are divided by the percentage change in price.
There are some causes which is need to measure on the basis of producer or industry change the
supply of the product. Also, the availability of the critical resources is related to the technology,
competitors and innovation (Lux and Pfluger, 2020). The change in demand can be on the basis
of technology because when organisations adopt new technology it can produce more
commodities and because of this it can attract large number of customer. Also, it helps to build
this good brand image of the company by increasing the productivity. From the above diagram it
has been identified that the price of the commodity will shows on the basis of Vertical line and
on the others and horizontal axis will show quantity deamnded and the factor are change
accordingly.
P
Q
D
Paraphrase This Document
Need a fresh take? Get an instant paraphrase of this document with our AI Paraphraser
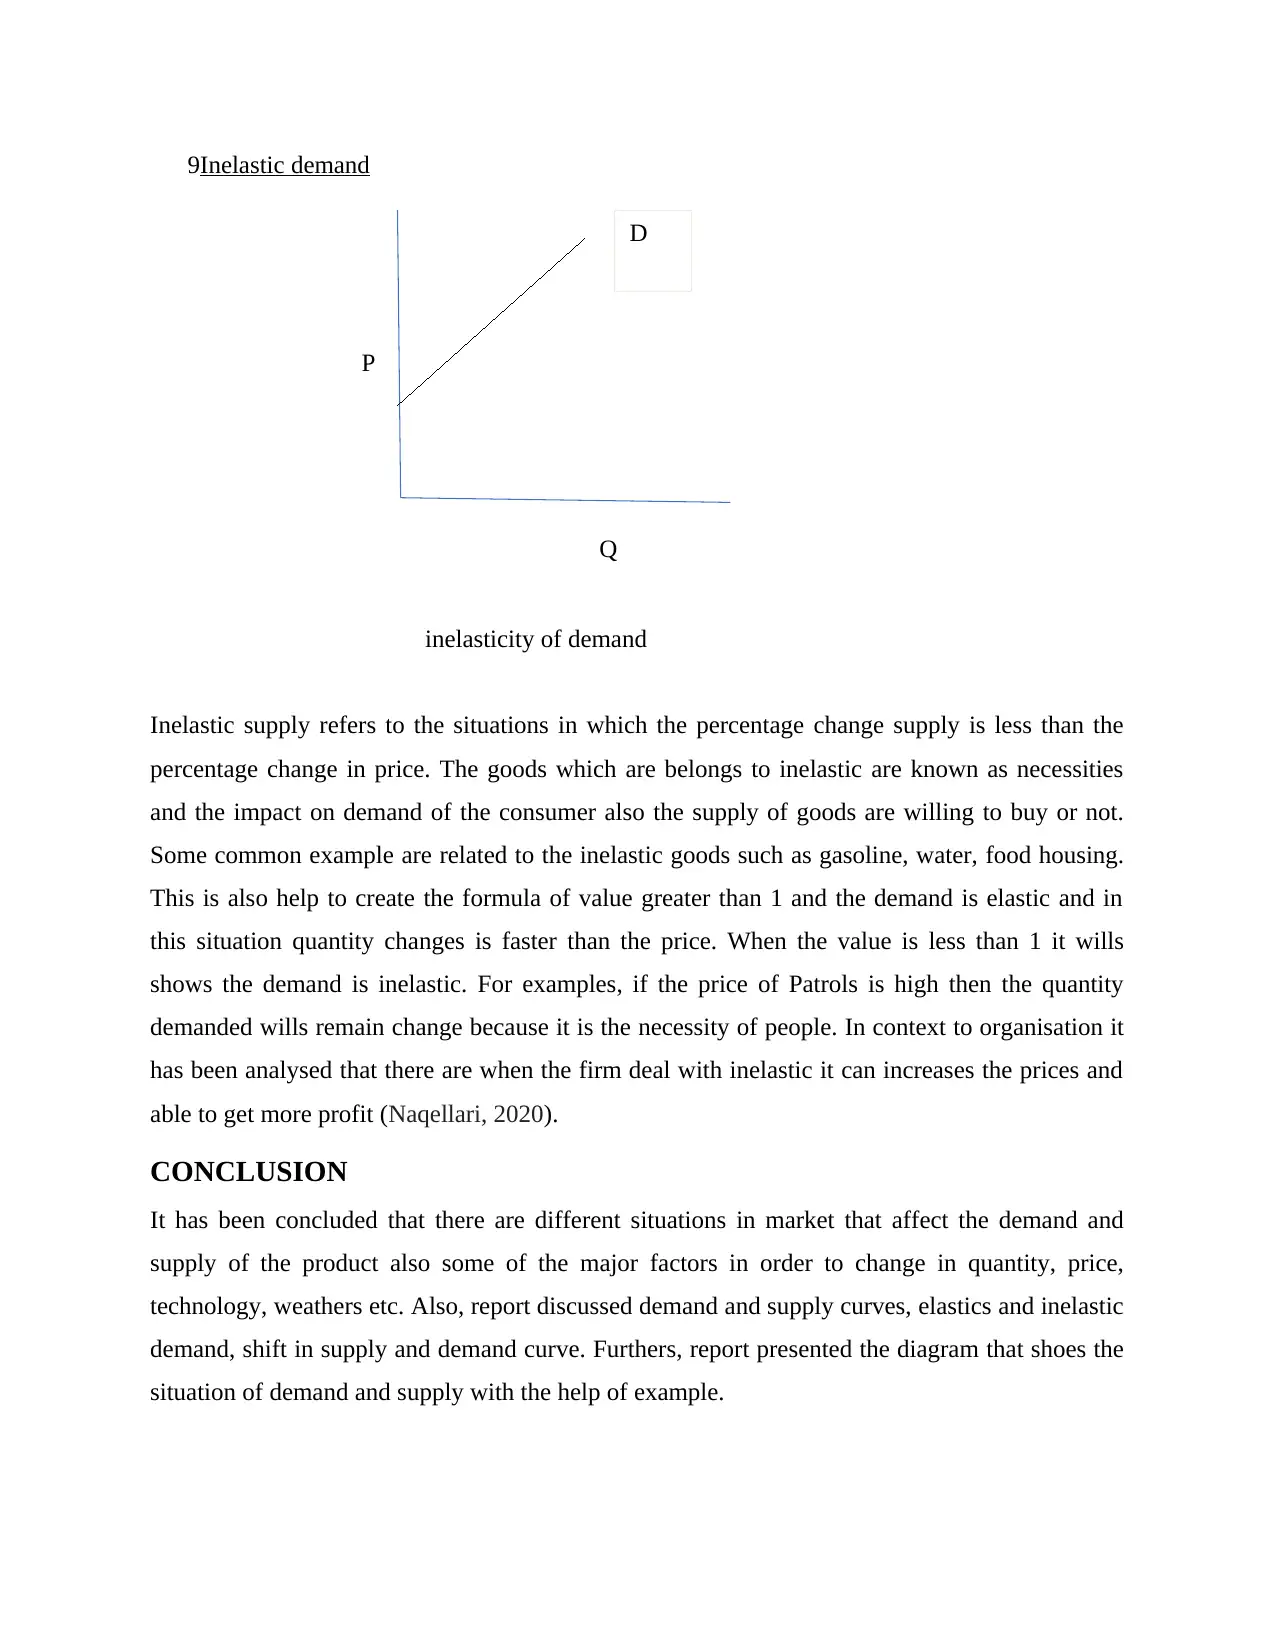
9Inelastic demand
inelasticity of demand
Inelastic supply refers to the situations in which the percentage change supply is less than the
percentage change in price. The goods which are belongs to inelastic are known as necessities
and the impact on demand of the consumer also the supply of goods are willing to buy or not.
Some common example are related to the inelastic goods such as gasoline, water, food housing.
This is also help to create the formula of value greater than 1 and the demand is elastic and in
this situation quantity changes is faster than the price. When the value is less than 1 it wills
shows the demand is inelastic. For examples, if the price of Patrols is high then the quantity
demanded wills remain change because it is the necessity of people. In context to organisation it
has been analysed that there are when the firm deal with inelastic it can increases the prices and
able to get more profit (Naqellari, 2020).
CONCLUSION
It has been concluded that there are different situations in market that affect the demand and
supply of the product also some of the major factors in order to change in quantity, price,
technology, weathers etc. Also, report discussed demand and supply curves, elastics and inelastic
demand, shift in supply and demand curve. Furthers, report presented the diagram that shoes the
situation of demand and supply with the help of example.
P
Q
D
REFERENCES
Books and journals
Arshed, N. and Kalim, R., 2021. Modelling demand and supply of Islamic banking
deposits. International Journal of Finance & Economics, 26(2). pp.2813-2831.
Brinca, P., Duarte, J.B. and Faria-e-Castro, M., 2020. Measuring sectoral supply and demand
shocks during COVID-19. Frb st. louis working paper, (2020-011).
Bryan, B.A., Ye, Y. and Connor, J.D., 2018. Land-use change impacts on ecosystem services
value: Incorporating the scarcity effects of supply and demand dynamics. Ecosystem
services. 32. pp.144-157.
de Gorter, H., Drabik, D., Just, D.R., Reynolds, C. and Sethi, G., 2021. Analyzing the economics
of food loss and waste reductions in a food supply chain. Food Policy. 98. p.101953.
Del Negro, Primiceri, G.E. and Tambalotti, A., 2020. What’s up with the Phillips Curve? (No.
w27003). National Bureau of Economic Research.
Goyal, A. and Kumar, A., 2021. Asymmetry, terms of trade and the aggregate supply curve in an
open economy model. The Journal of Economic Asymmetries. 24. p.e00206.
Ilk, N., Shang, G.,and Zhao, J.L., 2021. STABILITY OF TRANSACTION FEES IN BITCOIN:
A SUPPLY AND DEMAND PERSPECTIVE. MIS Quarterly, 45(2).
Khalafi, M., 2021. Predicting supply curve of electricity in an intra-day market using state-space
models and sequential markov chain monte carlo methods (Doctoral dissertation).
Lux, B. and Pfluger, B., 2020. A supply curve of electricity-based hydrogen in a decarbonized
European energy system in 2050. Applied Energy. 269. p.115011.
Naqellari, A., 2020. Market Model with Positive Demand Curve Overthrows Marxist and
Keynesian Model. Academic Journal of Interdisciplinary Studies. 9(3). pp.59-59.
⊘ This is a preview!⊘
Do you want full access?
Subscribe today to unlock all pages.
Trusted by 1+ million students worldwide
1 out of 12
Related Documents


Your All-in-One AI-Powered Toolkit for Academic Success.
+13062052269
info@desklib.com
Available 24*7 on WhatsApp / Email
![[object Object]](/_next/static/media/star-bottom.7253800d.svg)
Unlock your academic potential
Copyright © 2020–2026 A2Z Services. All Rights Reserved. Developed and managed by ZUCOL.