Syngenta Amistar Launch: Business Decision Making Report Analysis
VerifiedAdded on 2020/01/07
|20
|3946
|94
Report
AI Summary
This report examines Syngenta's business decision-making process in launching its Amistar product in India. It begins with an introduction to the company and the context of the product launch. Task 1 focuses on data collection, including a questionnaire designed to gather consumer insights and a discussion of primary and secondary data sources, survey methodology, and sampling methods. Task 2 delves into data analysis, calculating mean, median, mode, range, standard deviation, and interquartile range to assess the data. Task 3 presents graphical representations of sales, cost, and profit figures in the Japanese market, along with trend analysis to predict future performance. The report concludes with a summary of findings and recommendations, offering a comprehensive overview of the Amistar product's potential and the business strategies employed.

Business Decision
Making
1
Making
1
Paraphrase This Document
Need a fresh take? Get an instant paraphrase of this document with our AI Paraphraser
Table of Contents
INTRODUCTION...........................................................................................................................4
TASK 1 ...........................................................................................................................................4
Q.1 ...............................................................................................................................................4
Q. 2...............................................................................................................................................6
TASK 2............................................................................................................................................8
Q. 1...............................................................................................................................................8
Q.2 ...............................................................................................................................................8
Q.3................................................................................................................................................9
TASK 3..........................................................................................................................................10
Q.1..............................................................................................................................................10
Q. 2.............................................................................................................................................12
Q. 3.............................................................................................................................................13
Q. 4.............................................................................................................................................13
TASK 4..........................................................................................................................................14
Q. 1.............................................................................................................................................14
Q. 2.............................................................................................................................................15
Q.3..............................................................................................................................................17
CONCLUSION .............................................................................................................................19
REFERENCES..............................................................................................................................20
2
INTRODUCTION
Business decision making is the most important aspect for any corporation which assists
corporation to carry out all entities activities effectively. It includes varied decisions related to
expansion of business and improving the current performance of the same in order to cater need
of customers. Present report is based on scenario of Syngenta which employs more than 28000
workforces in 90 countries for meeting specific purpose “bringing plant potential to life” Here;
the company is launching its new product in India as Amistar for pest management. For this
purpose, research has been done in order to collected information related to new product and
assure about its effectiveness for business in term of higher rate of return. Furthermore, standard
deviation and project management tools are applied for assessing the effectiveness of selected
project.
TASK 1
Q.1
The questionnaire method plays important role in getting more information related to
consumers and their perception. In this regard, following questionnaire has been prepared to
collect primary data-
Name______________
Gender
Male
Female
Age
Under 18
18-30 Years
30-40 Years
40 and above
1. Do you find products offered by Syngenta are effective?
Yes
No
Can't say
3
⊘ This is a preview!⊘
Do you want full access?
Subscribe today to unlock all pages.
Trusted by 1+ million students worldwide
2. Do you agree that Syngenta provides best solution in context of pest management?
Strongly agree
Agree
Neutral
Disagree
Strongly disagree
3. Are you satisfied with quality of newly launched fungicides of Syngenta?
Highly satisfied
Satisfied
Neutral
Dissatisfied
Highly dissatisfied
4. Are you satisfied pricing strategies of Syngenta?
Highly satisfied
Satisfied
Neutral
Dissatisfied
Highly dissatisfied
5. What motivated you to buy fungicides products of Syngenta?
Price
Quality
Discount
Special offer
6. Do you think that new product “Amistar” will be effective in agriculture sector of India?
Yes
No
Can't say
7. Do you agree that company has presence of appropriate departmental store to deliver Amistar
products?
Strongly agree
4
Strongly agree
Agree
Neutral
Disagree
Strongly disagree
3. Are you satisfied with quality of newly launched fungicides of Syngenta?
Highly satisfied
Satisfied
Neutral
Dissatisfied
Highly dissatisfied
4. Are you satisfied pricing strategies of Syngenta?
Highly satisfied
Satisfied
Neutral
Dissatisfied
Highly dissatisfied
5. What motivated you to buy fungicides products of Syngenta?
Price
Quality
Discount
Special offer
6. Do you think that new product “Amistar” will be effective in agriculture sector of India?
Yes
No
Can't say
7. Do you agree that company has presence of appropriate departmental store to deliver Amistar
products?
Strongly agree
4
Paraphrase This Document
Need a fresh take? Get an instant paraphrase of this document with our AI Paraphraser
Agree
Neutral
Disagree
Strongly disagree
8. Which mode of communication is best suited for you to get information related to Amistar
product?
Internet
Mobile application
Television
9. Kindly provide your valuable
suggestions__________________________________________________________________-
Q. 2
The data collection plan is very important for business which facilitates to collect large
amount of information related to products and services that are to be launched or launched in the
market. Basically two types of data are collected such as primary and secondary which are
explained as follows- Primary data-Primary data are collected first time from research in accordance with set
purpose and requirement. There are different types of methods used for collection of
primary data such as interviews, focus group and observation as well as questionnaire.
Basically, all of the stated techniques consume extensive time as well as cost (Mackey
and Gass, 2015). It can be critically evaluated that questionnaire method is comparatively
good to meet the purpose of researcher. This is because of benefits associated with the
same through which respondents can easily understand the questionnaire and need of
direct interaction can also be resolved. However, questionnaire method will be selected to
interact with respondents and gather detail information (Barake, 2011). Secondary data-Secondary data are collected by accessing varied available sources like
journals, books and online articles. This proves to be effective to gather large amount of
information and fulfilled purpose of researcher in an effectual manner. However, the
current investigation on launching new product as Amistar, both primary and secondary
5
data is collected. In addition to this, stated sources of secondary information will be
referred for collection of secondary data (Neuman and Robson, 2012). It proves to be
effective for researcher to develop deep understanding related to set concepts and
accordingly frame strategies to meet the purpose of study. However, internal record
keeping of business will be accessed for the purpose of gathered fruitful information.
Survey methodology
Survey methodology refers the the process of selecting the appropriate design for
collection of information relate to particular research problem. Basically varied techniques such
as questionnaire is used for the purpose of interacting with respondents and incorporate their
views and suggestion in the decision making process of companies like Syngenta (Pickard,
2012). Here, present study will be based upon questionnaire method under which both open and
closes ended questionnaire will be used. This aids to gather information related to reviews of
products, price and place as well as promotion of Amistar.
Sampling method
Sampling refers to individual unit of population which represent overall people who are
directly or indirectly connected with the study. Under the current study, managers of agriculture
department will be considered as population throughout the India. However, two types of
sampling design such probabilistic and non-probabilistic are used. However, current
investigation will be based upon probabilistic sampling in order to ensure equal probability of all
mangers to get selected in the study (Taylor, Bogdan and DeVault, 2015). However, researcher
will use simple random sampling whereby researcher can easily accomplish the set aim.
However, sample size plays important role because researcher has to select the sample out of
tentative population. Here, 20 managers from different cities like Udaipur, Pubjan and Haryana
will be taken. This proves to be effective to analyze their preferences in term of overall product,
price and place as well as promotion. This in turn research can reach at the aim of the study by
drawing appropriate outcome (Williams, 2011).
TASK 2
Q. 1
Annual
expenses No. of countries (F) M. V. (x) CF FX X^2 FX^2
6
⊘ This is a preview!⊘
Do you want full access?
Subscribe today to unlock all pages.
Trusted by 1+ million students worldwide
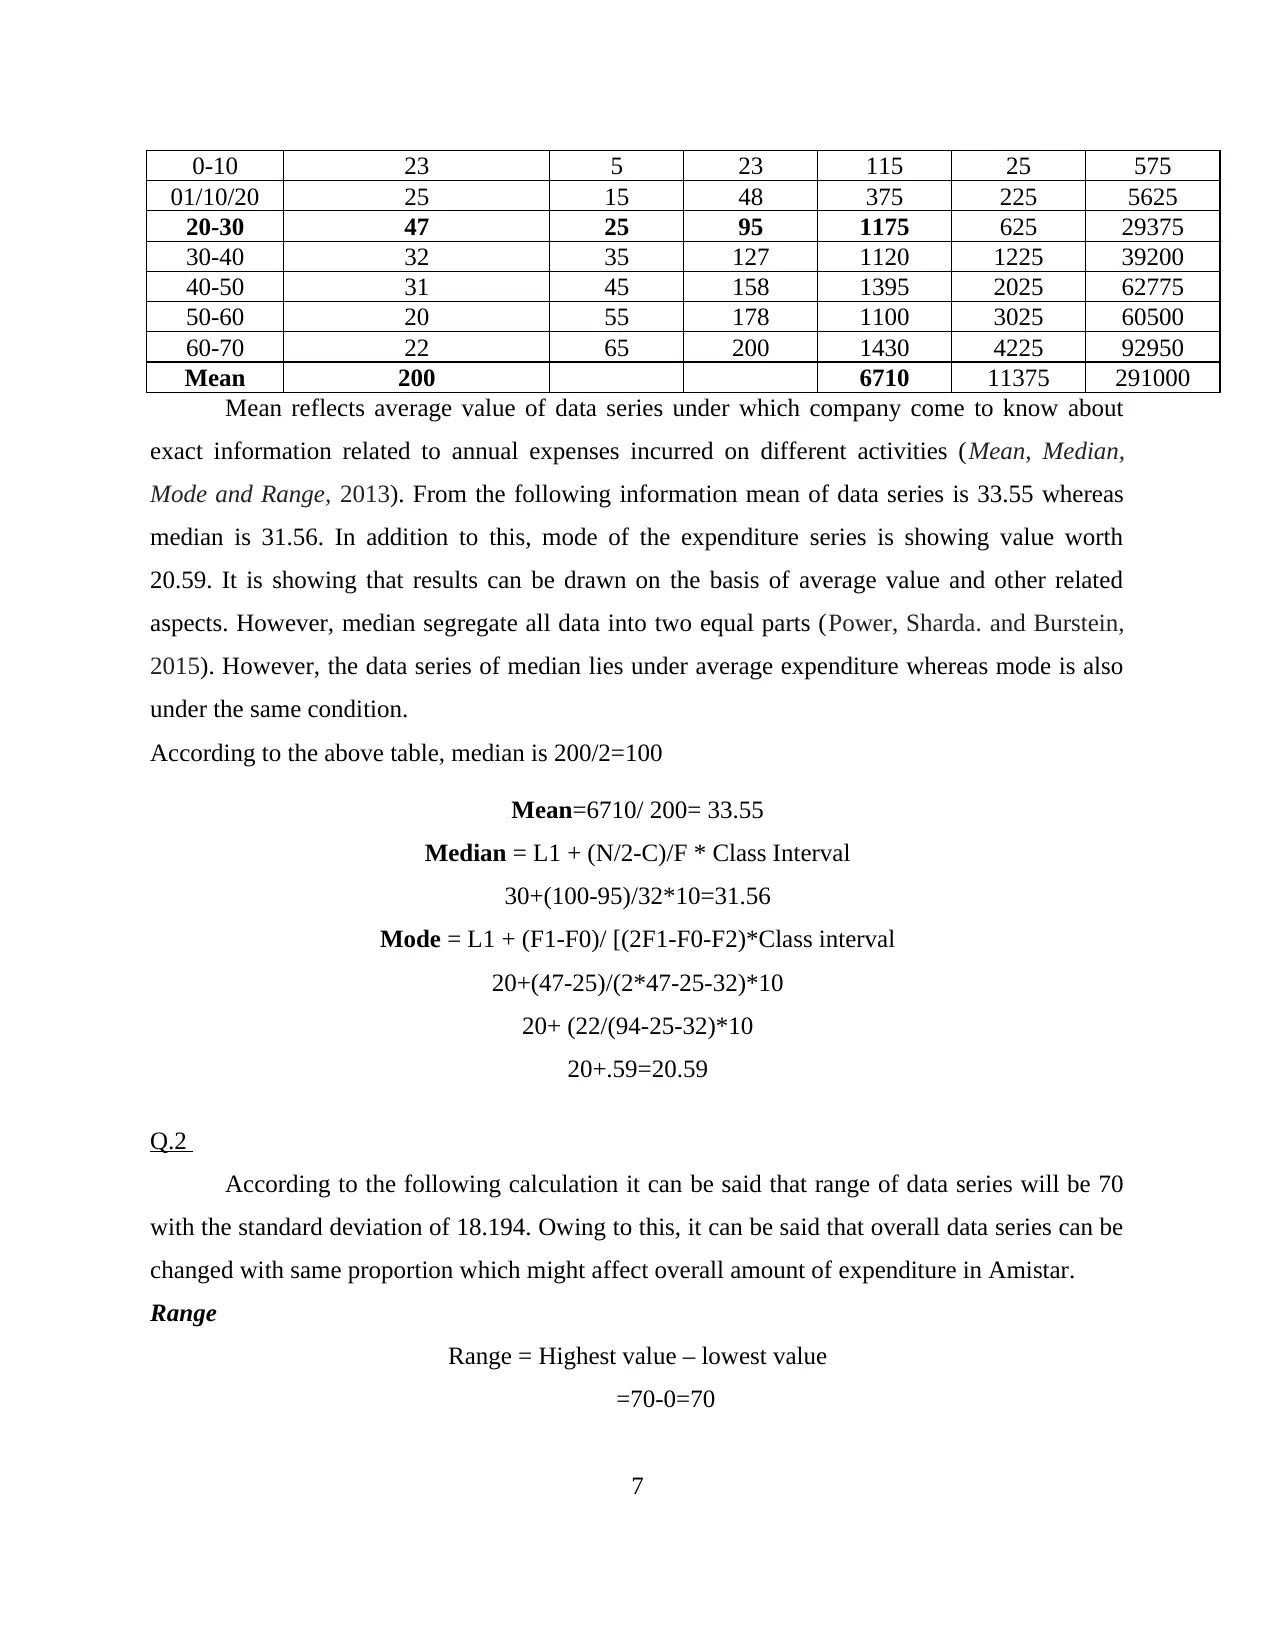
0-10 23 5 23 115 25 575
01/10/20 25 15 48 375 225 5625
20-30 47 25 95 1175 625 29375
30-40 32 35 127 1120 1225 39200
40-50 31 45 158 1395 2025 62775
50-60 20 55 178 1100 3025 60500
60-70 22 65 200 1430 4225 92950
Mean 200 6710 11375 291000
Mean reflects average value of data series under which company come to know about
exact information related to annual expenses incurred on different activities (Mean, Median,
Mode and Range, 2013). From the following information mean of data series is 33.55 whereas
median is 31.56. In addition to this, mode of the expenditure series is showing value worth
20.59. It is showing that results can be drawn on the basis of average value and other related
aspects. However, median segregate all data into two equal parts (Power, Sharda. and Burstein,
2015). However, the data series of median lies under average expenditure whereas mode is also
under the same condition.
According to the above table, median is 200/2=100
Mean=6710/ 200= 33.55
Median = L1 + (N/2-C)/F * Class Interval
30+(100-95)/32*10=31.56
Mode = L1 + (F1-F0)/ [(2F1-F0-F2)*Class interval
20+(47-25)/(2*47-25-32)*10
20+ (22/(94-25-32)*10
20+.59=20.59
Q.2
According to the following calculation it can be said that range of data series will be 70
with the standard deviation of 18.194. Owing to this, it can be said that overall data series can be
changed with same proportion which might affect overall amount of expenditure in Amistar.
Range
Range = Highest value – lowest value
=70-0=70
7
Paraphrase This Document
Need a fresh take? Get an instant paraphrase of this document with our AI Paraphraser
Standard deviation
Variance (S^2) = ∑Fx2 – ((∑Fx)2 /n)/ n – 1
= [291000 – (6710)^2/200]/(200-1)
= 331.05
Standard deviation = √ Variance
= √ 331.05
= 18.194
Q.3
Inter-quartile range
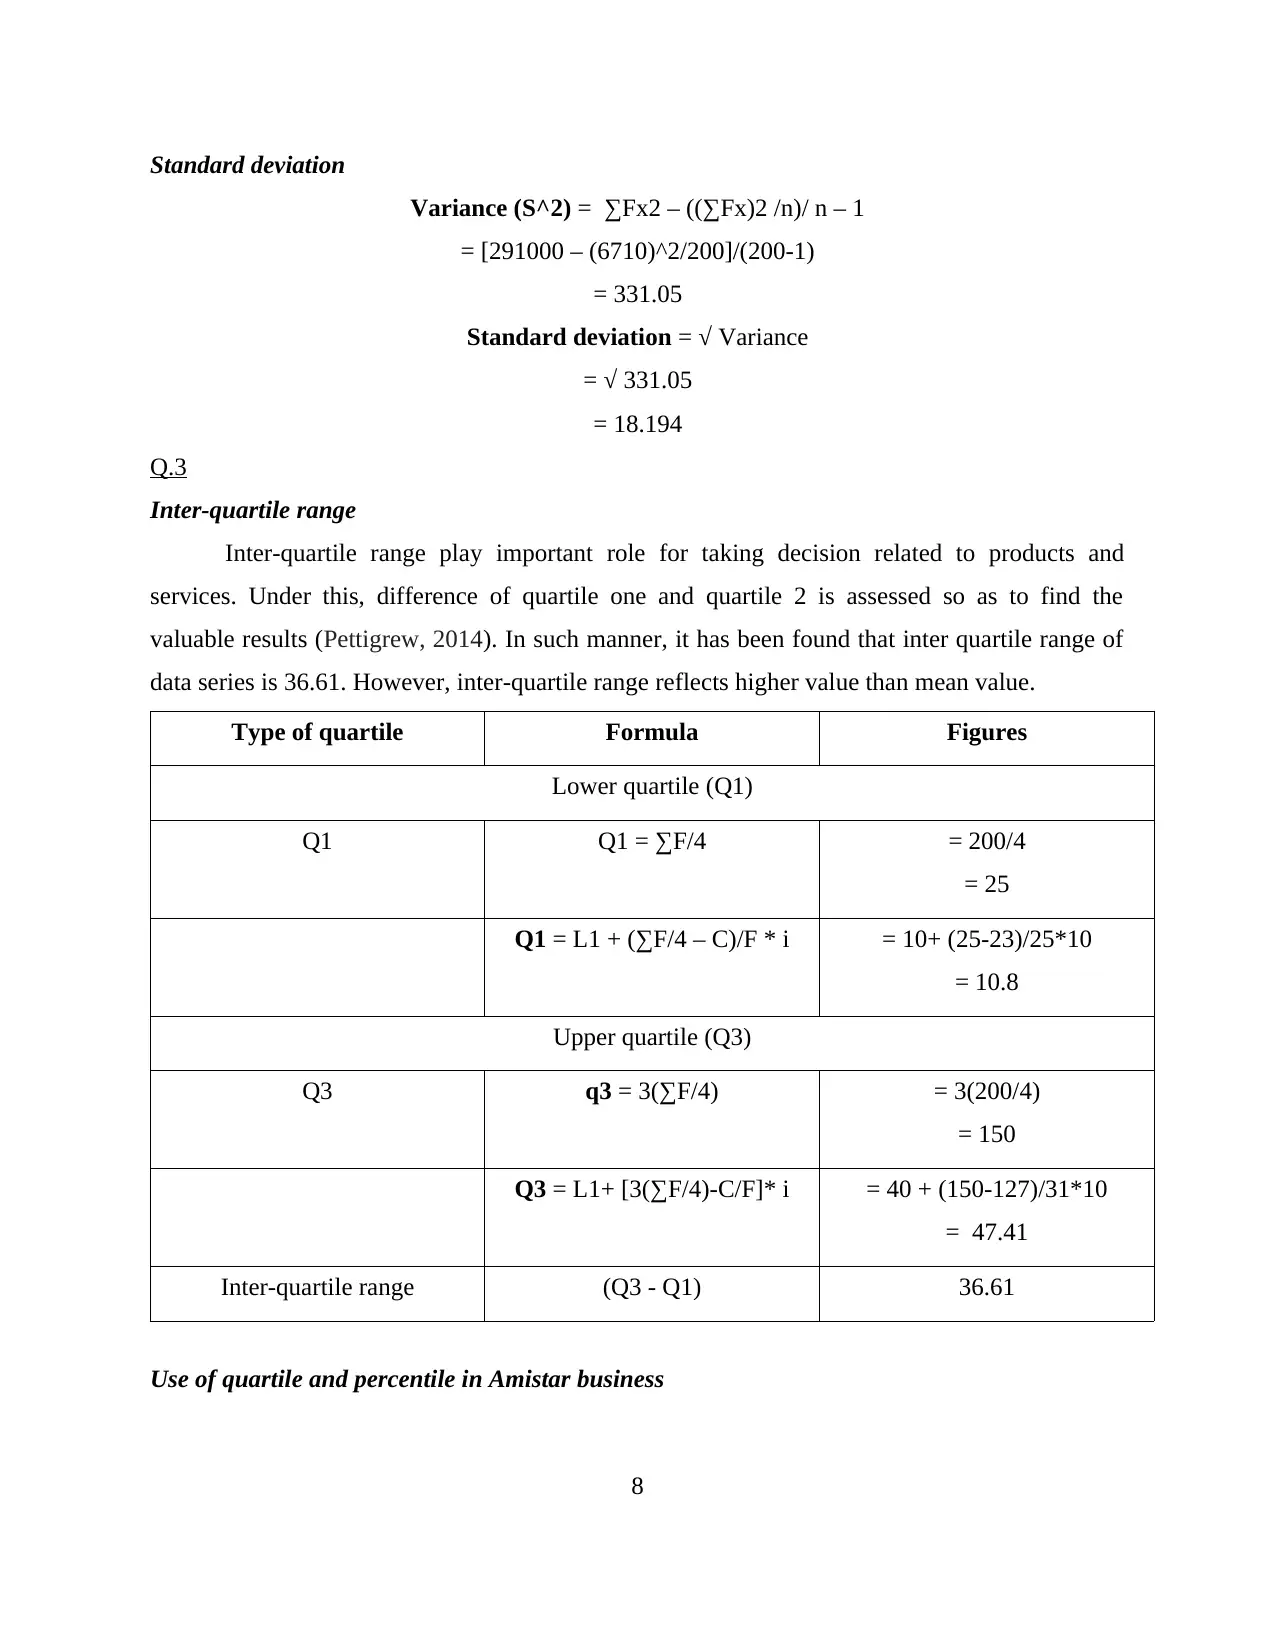
Inter-quartile range play important role for taking decision related to products and
services. Under this, difference of quartile one and quartile 2 is assessed so as to find the
valuable results (Pettigrew, 2014). In such manner, it has been found that inter quartile range of
data series is 36.61. However, inter-quartile range reflects higher value than mean value.
Type of quartile Formula Figures
Lower quartile (Q1)
Q1 Q1 = ∑F/4 = 200/4
= 25
Q1 = L1 + (∑F/4 – C)/F * i = 10+ (25-23)/25*10
= 10.8
Upper quartile (Q3)
Q3 q3 = 3(∑F/4) = 3(200/4)
= 150
Q3 = L1+ [3(∑F/4)-C/F]* i = 40 + (150-127)/31*10
= 47.41
Inter-quartile range (Q3 - Q1) 36.61
Use of quartile and percentile in Amistar business
8
Variance (S^2) = ∑Fx2 – ((∑Fx)2 /n)/ n – 1
= [291000 – (6710)^2/200]/(200-1)
= 331.05
Standard deviation = √ Variance
= √ 331.05
= 18.194
Q.3
Inter-quartile range
Inter-quartile range play important role for taking decision related to products and
services. Under this, difference of quartile one and quartile 2 is assessed so as to find the
valuable results (Pettigrew, 2014). In such manner, it has been found that inter quartile range of
data series is 36.61. However, inter-quartile range reflects higher value than mean value.
Type of quartile Formula Figures
Lower quartile (Q1)
Q1 Q1 = ∑F/4 = 200/4
= 25
Q1 = L1 + (∑F/4 – C)/F * i = 10+ (25-23)/25*10
= 10.8
Upper quartile (Q3)
Q3 q3 = 3(∑F/4) = 3(200/4)
= 150
Q3 = L1+ [3(∑F/4)-C/F]* i = 40 + (150-127)/31*10
= 47.41
Inter-quartile range (Q3 - Q1) 36.61
Use of quartile and percentile in Amistar business
8
Quartile is the most important aspect for assessing the views and suggestions of
respondents related to products and services of corporation. Furthermore, percentile reflects that
how many people are having varying attitude about particular aspect. In this manner, it can be
said that 25th percentile 10.8 whereas 75th percentile is 47.41. It is showing that views and
suggestions of 75% people do not lie in the category of average expenditure series. In this
manner, researcher can accomplish the aim of the study by drawing valid outcome.
Percentiles Quartiles Values
25th percentile Lower quartile (Q1) 10.8
75th percentile Upper quartile (Q3) 47.41
TASK 3
Q.1
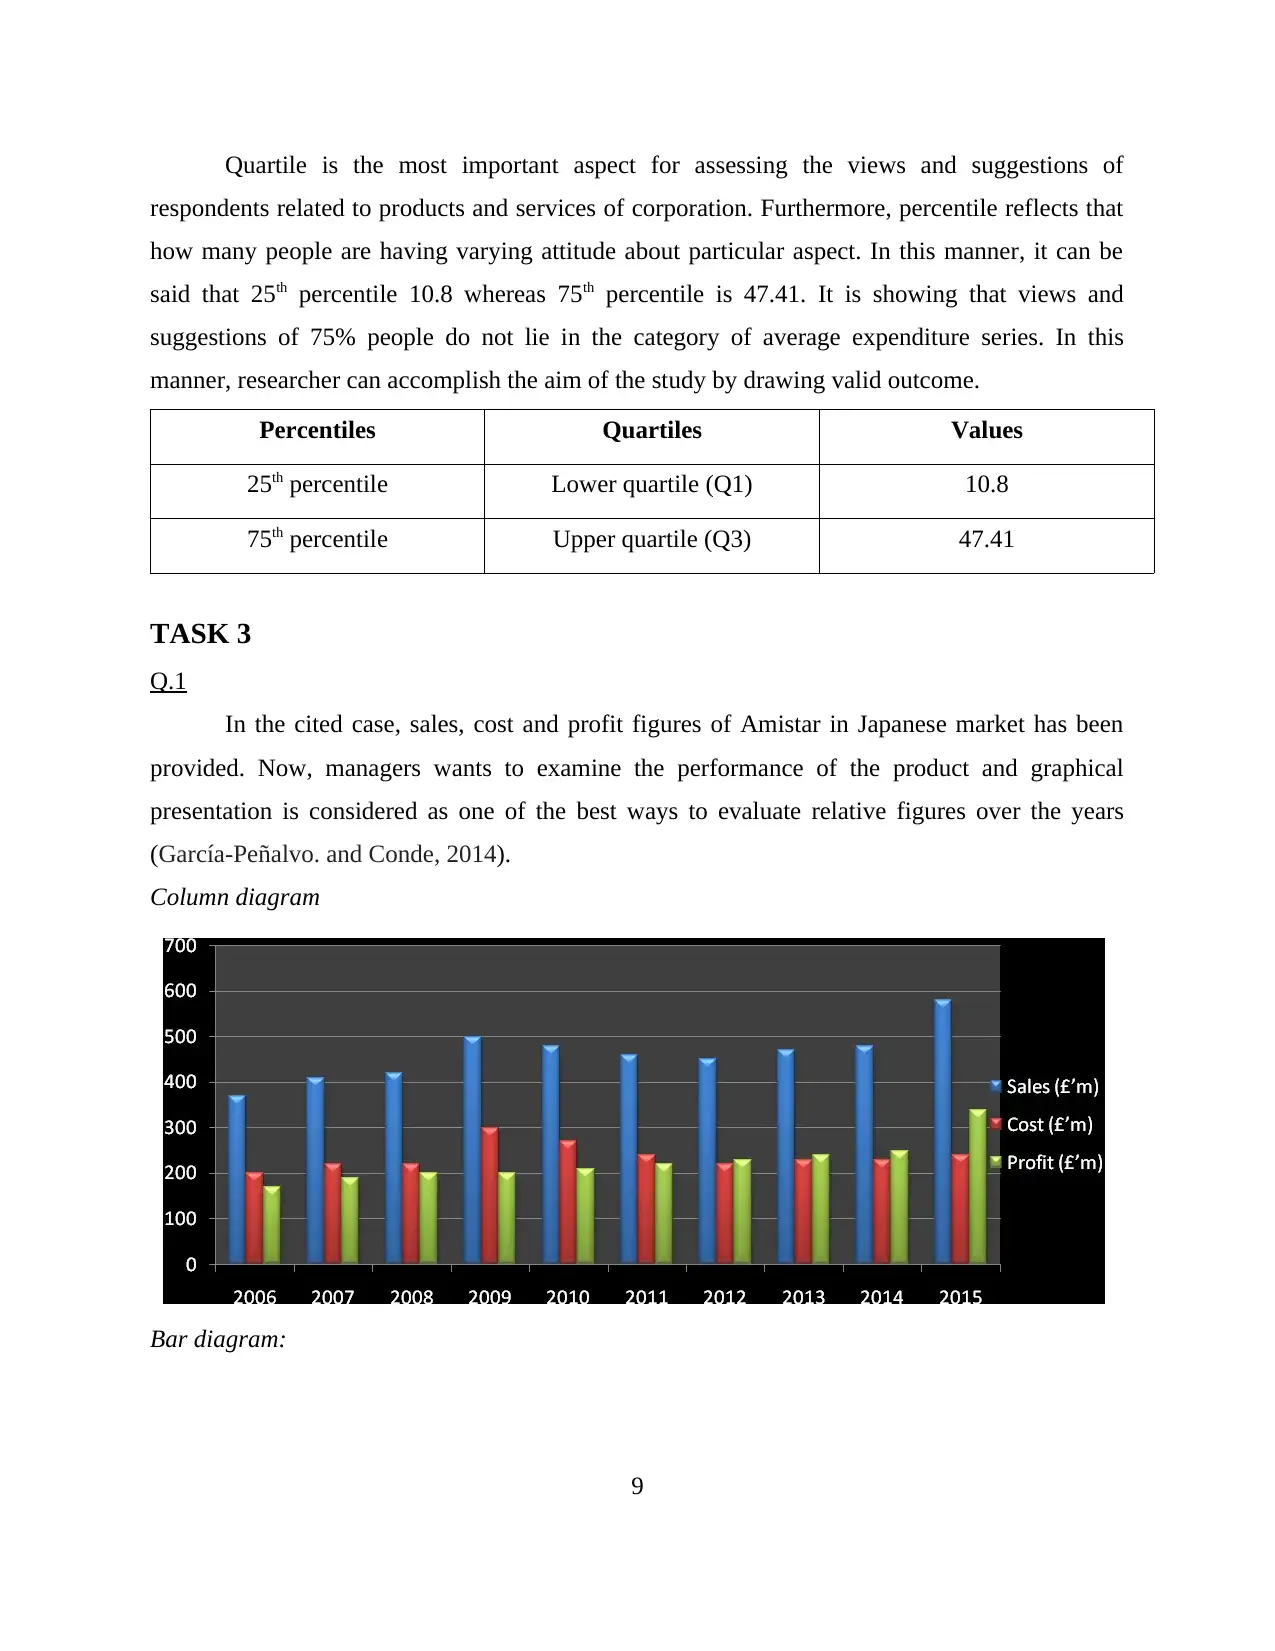
In the cited case, sales, cost and profit figures of Amistar in Japanese market has been
provided. Now, managers wants to examine the performance of the product and graphical
presentation is considered as one of the best ways to evaluate relative figures over the years
(García-Peñalvo. and Conde, 2014).
Column diagram
Bar diagram:
9
respondents related to products and services of corporation. Furthermore, percentile reflects that
how many people are having varying attitude about particular aspect. In this manner, it can be
said that 25th percentile 10.8 whereas 75th percentile is 47.41. It is showing that views and
suggestions of 75% people do not lie in the category of average expenditure series. In this
manner, researcher can accomplish the aim of the study by drawing valid outcome.
Percentiles Quartiles Values
25th percentile Lower quartile (Q1) 10.8
75th percentile Upper quartile (Q3) 47.41
TASK 3
Q.1
In the cited case, sales, cost and profit figures of Amistar in Japanese market has been
provided. Now, managers wants to examine the performance of the product and graphical
presentation is considered as one of the best ways to evaluate relative figures over the years
(García-Peñalvo. and Conde, 2014).
Column diagram
Bar diagram:
9
⊘ This is a preview!⊘
Do you want full access?
Subscribe today to unlock all pages.
Trusted by 1+ million students worldwide
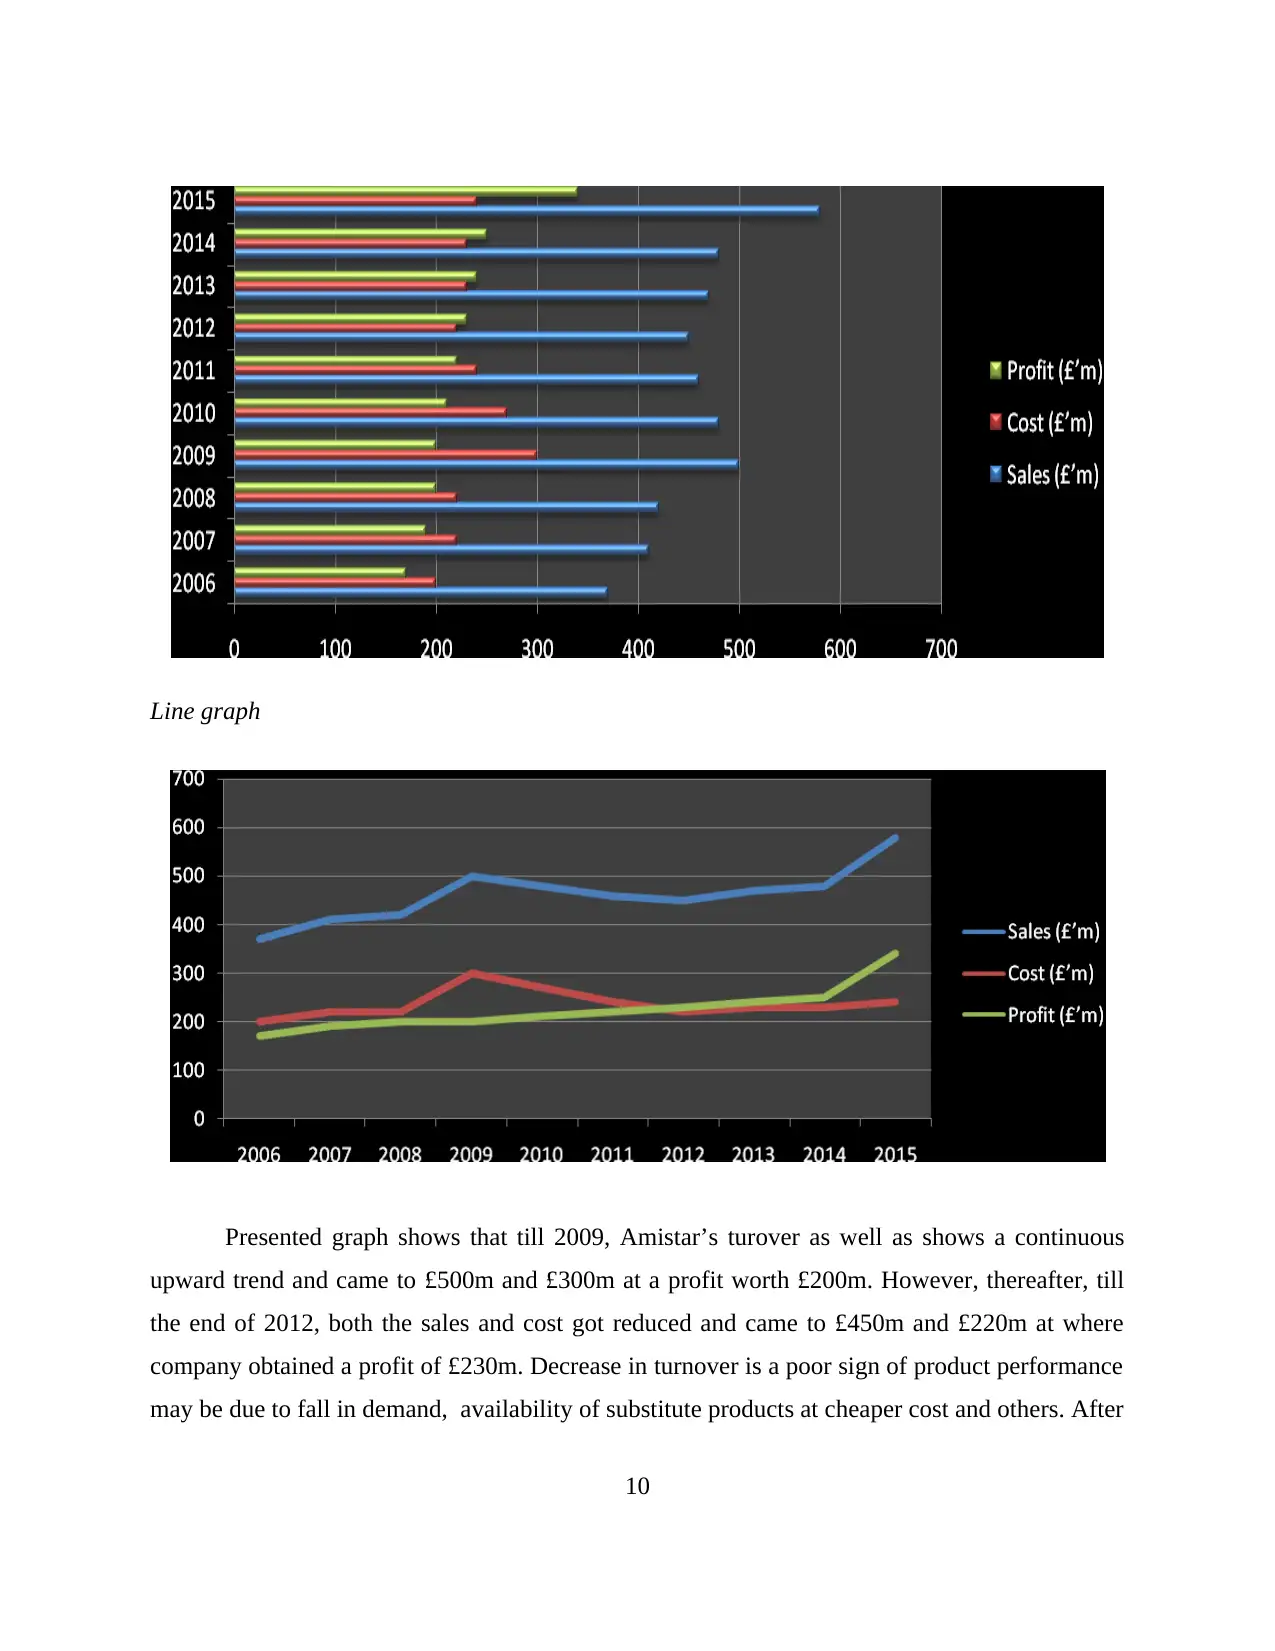
Line graph
Presented graph shows that till 2009, Amistar’s turover as well as shows a continuous
upward trend and came to £500m and £300m at a profit worth £200m. However, thereafter, till
the end of 2012, both the sales and cost got reduced and came to £450m and £220m at where
company obtained a profit of £230m. Decrease in turnover is a poor sign of product performance
may be due to fall in demand, availability of substitute products at cheaper cost and others. After
10
Paraphrase This Document
Need a fresh take? Get an instant paraphrase of this document with our AI Paraphraser
2012, Amistar’s turnover shows a positive change as its total sales revenue got improved to
£580m at the end of the period may be due to more consumer awareness and rising demand.
However, cost has been increased at lower rate which is a sign of effective managerial control. It
helps to generate high profitability margin worth £340m in the year 2015.
Q. 2
Trend analysis is a statistical tool applied in businesses to forecast or predict future by
examining historical or general course of tendency (Sutherland. and Holstead, 2014). With
reference to Amistar’s sales and profitability figures in Japanese market, its trend line has been
constructed hereunder:
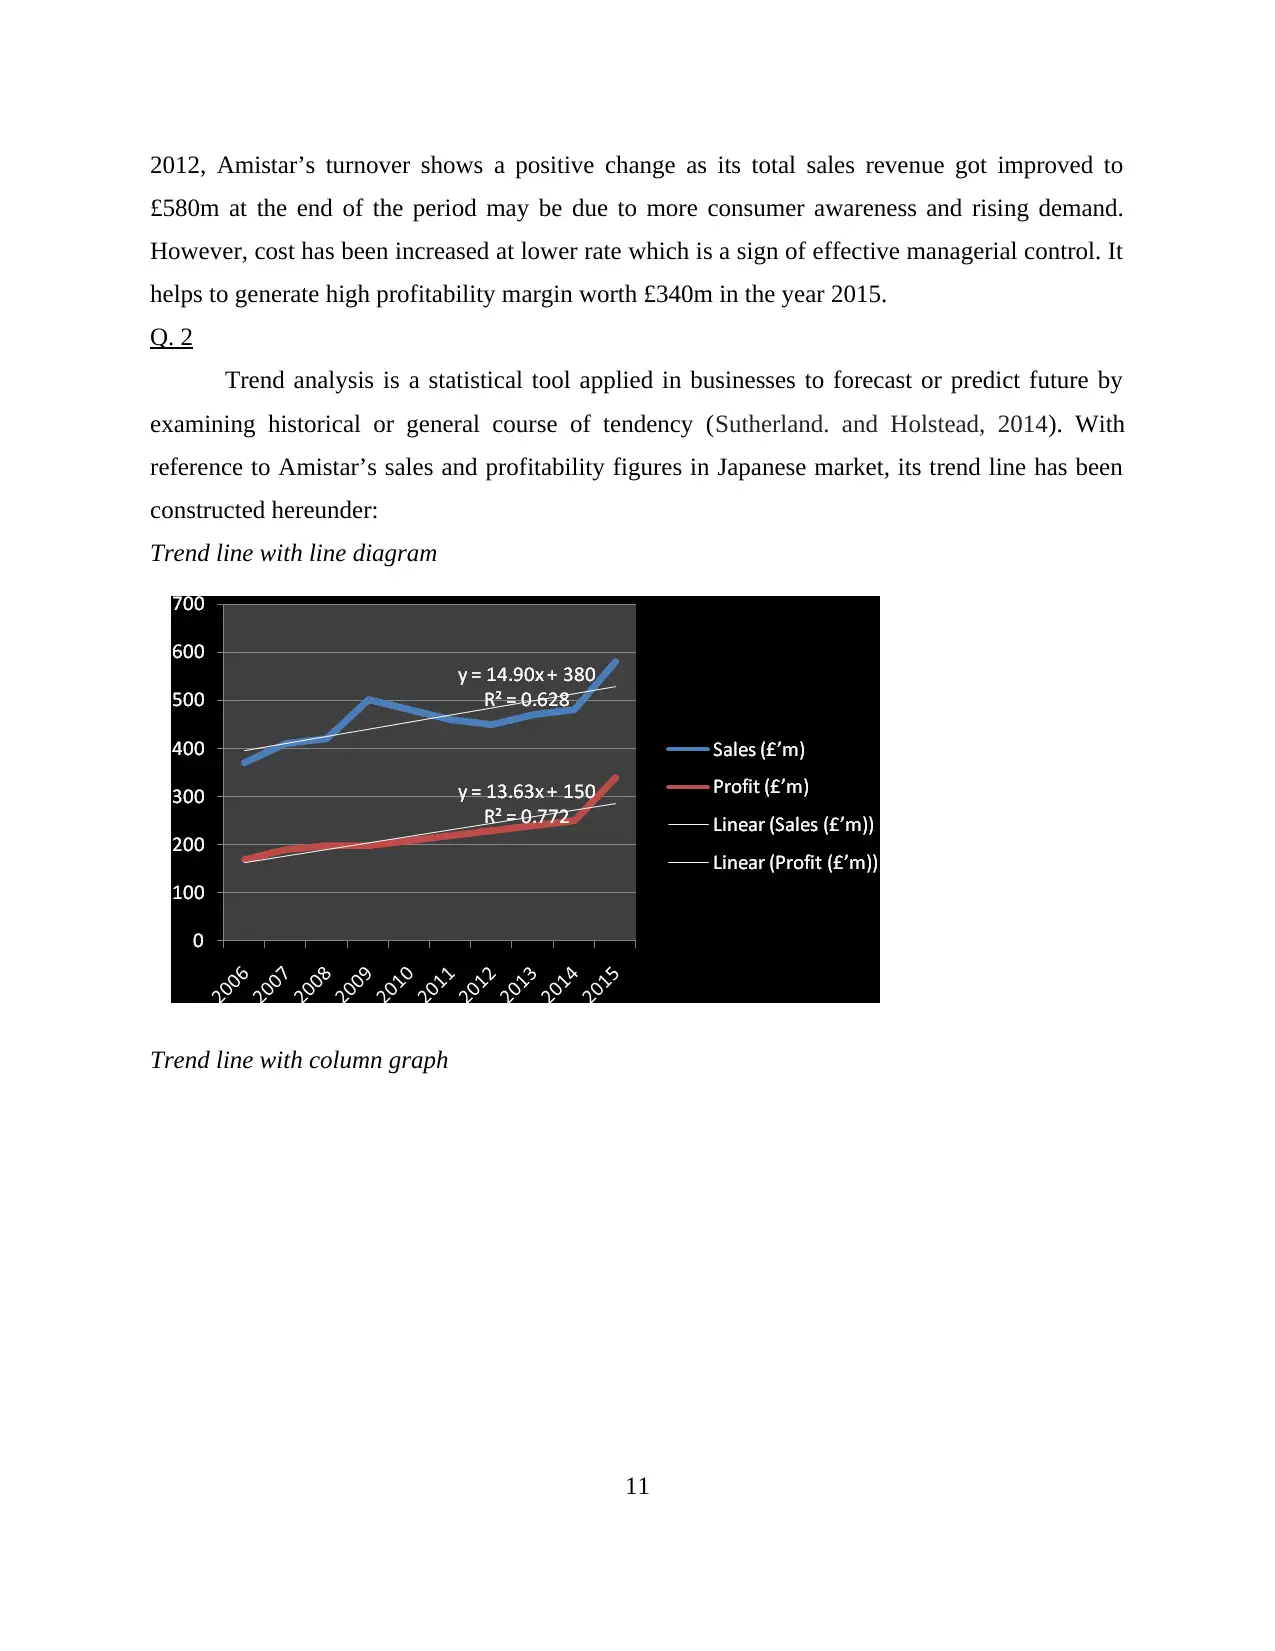
Trend line with line diagram
Trend line with column graph
11
£580m at the end of the period may be due to more consumer awareness and rising demand.
However, cost has been increased at lower rate which is a sign of effective managerial control. It
helps to generate high profitability margin worth £340m in the year 2015.
Q. 2
Trend analysis is a statistical tool applied in businesses to forecast or predict future by
examining historical or general course of tendency (Sutherland. and Holstead, 2014). With
reference to Amistar’s sales and profitability figures in Japanese market, its trend line has been
constructed hereunder:
Trend line with line diagram
Trend line with column graph
11
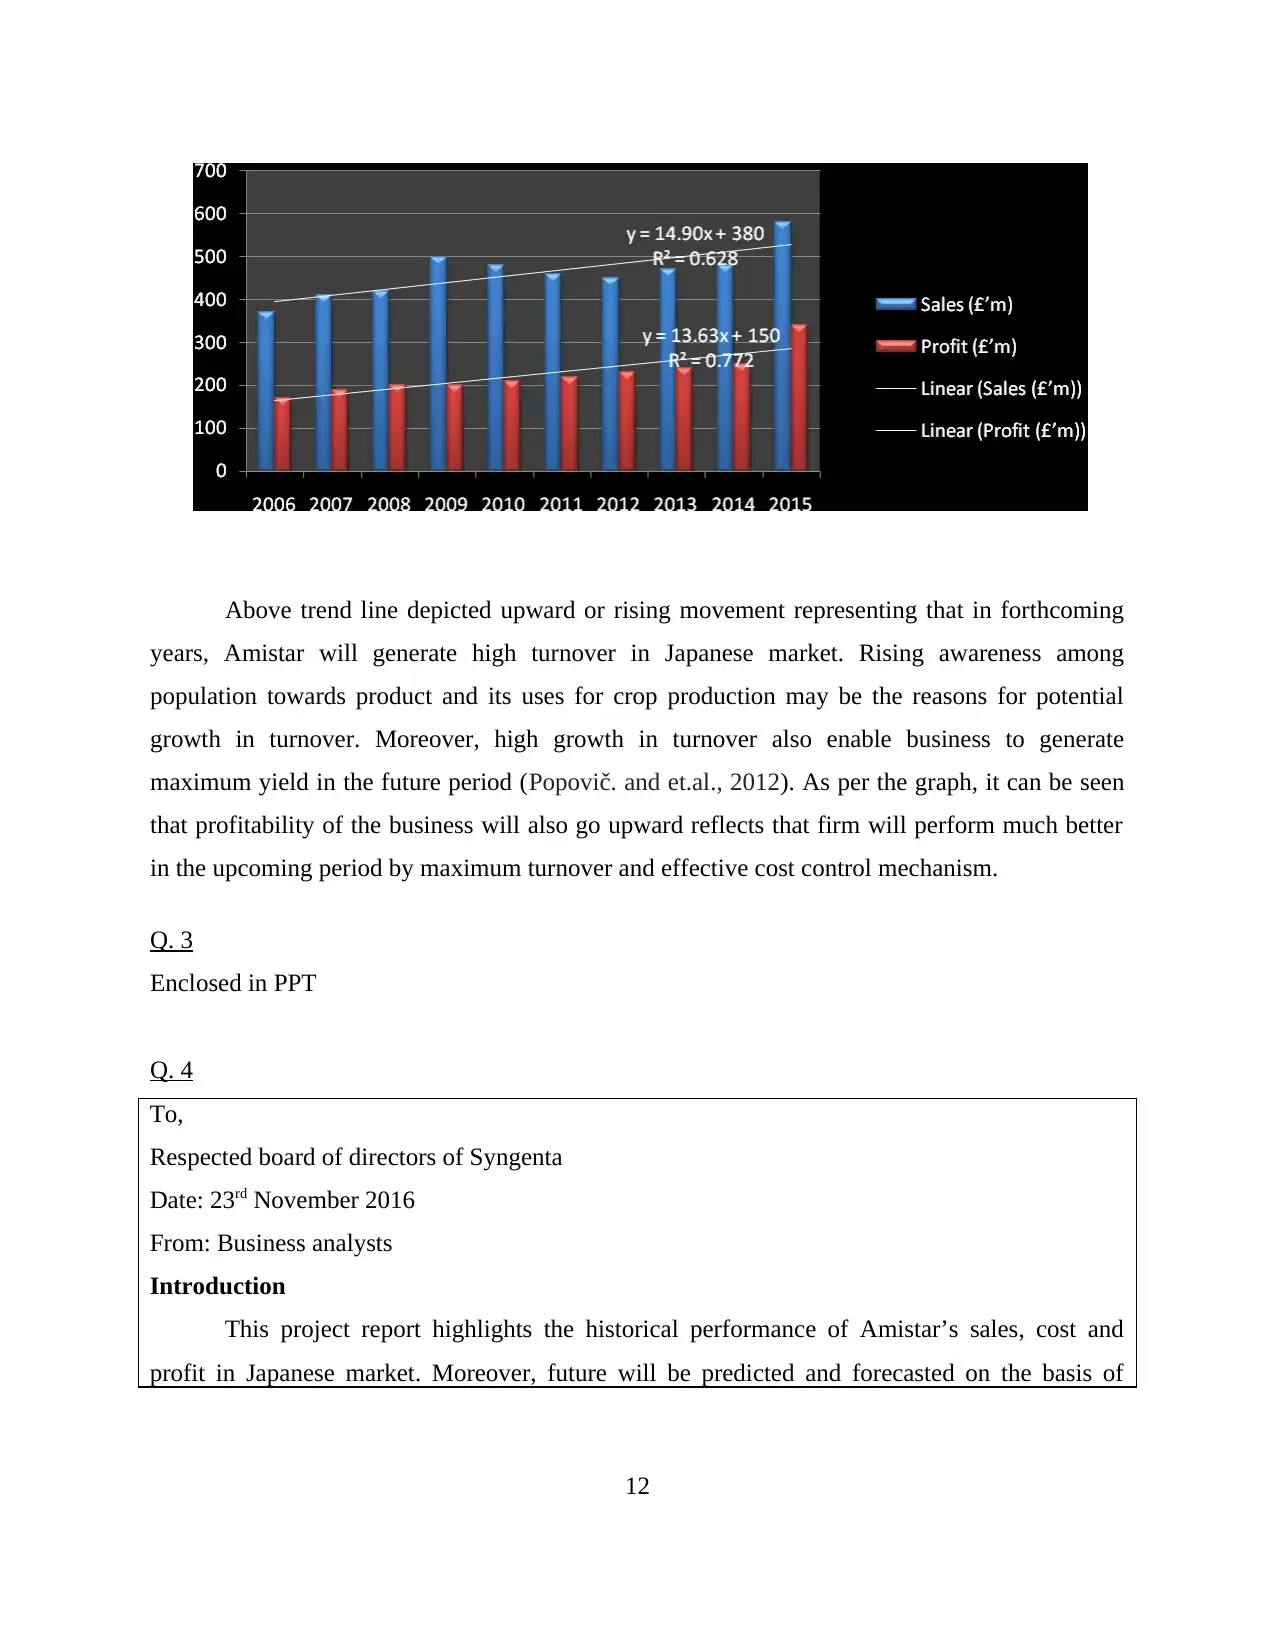
Above trend line depicted upward or rising movement representing that in forthcoming
years, Amistar will generate high turnover in Japanese market. Rising awareness among
population towards product and its uses for crop production may be the reasons for potential
growth in turnover. Moreover, high growth in turnover also enable business to generate
maximum yield in the future period (Popovič. and et.al., 2012). As per the graph, it can be seen
that profitability of the business will also go upward reflects that firm will perform much better
in the upcoming period by maximum turnover and effective cost control mechanism.
Q. 3
Enclosed in PPT
Q. 4
To,
Respected board of directors of Syngenta
Date: 23rd November 2016
From: Business analysts
Introduction
This project report highlights the historical performance of Amistar’s sales, cost and
profit in Japanese market. Moreover, future will be predicted and forecasted on the basis of
12
⊘ This is a preview!⊘
Do you want full access?
Subscribe today to unlock all pages.
Trusted by 1+ million students worldwide
1 out of 20
Related Documents


Your All-in-One AI-Powered Toolkit for Academic Success.
+13062052269
info@desklib.com
Available 24*7 on WhatsApp / Email
![[object Object]](/_next/static/media/star-bottom.7253800d.svg)
Unlock your academic potential
Copyright © 2020–2026 A2Z Services. All Rights Reserved. Developed and managed by ZUCOL.