Environmental Study: NSW Students' Perception of Environmental Issues
VerifiedAdded on 2020/04/01
|11
|2151
|249
Report
AI Summary
This report presents a quantitative analysis of student perceptions regarding environmental issues, focusing on students from NSW. The study examines their behaviors related to energy and water conservation, time allocation (including homework, family time, and video games), and the potential impact of these factors on academic achievement. Data analysis includes descriptive statistics, t-tests, and chi-square tests to assess relationships between variables such as gender, time spent on various activities, and attitudes towards environmental practices like powering off main switches and installing water-saving showerheads. The report also explores the correlation between paid work hours and pocket money, offering conclusions on student time utilization, gender-specific conservation behaviors, and recommendations for promoting environmental awareness and academic success.
Running head: QUANTITATIVE METHODS
Quantitative Methods
Name:
Institution:
Quantitative Methods
Name:
Institution:
Paraphrase This Document
Need a fresh take? Get an instant paraphrase of this document with our AI Paraphraser
QUANTITATIVE METHODS
Introduction
It is critical to understand students’ perception about environmental issues and how
they take part in saving both energy and water. This can help in understanding future
generation and whether a sustainable environment can be attained through this young
generation. In accordance with (UNICEF, 2015), youth and children are an important part of
society that can help in creating a sustainable future. UNICEF targets this group on their
sensitization program about creating a sustainable future. Severn Cullis-Suzuki, in the 1992
speech silenced the world and pointed that the only way to create a sustainable future is
through educating the youths (Orfalea, 2017). Therefore, this report will investigate how
sensitive the students from the NSW are about environmental issues.
The research will evaluate some of the students’ characteristics and how different
aspects of life can impact their academic achievement. The key components that this report
will highlight include the hours of sleep during a school night, the time taken to travel to
school (minutes), time spent on different issues such as doing homework, doing things with
friends/family among others. The variables measuring time is on an interval scale, and those
asking for an opinion about environmental issues are nominal scale. Lastly, how important
the students value some issues both personal and environmental are on an ordinal scale.
Data Analysis
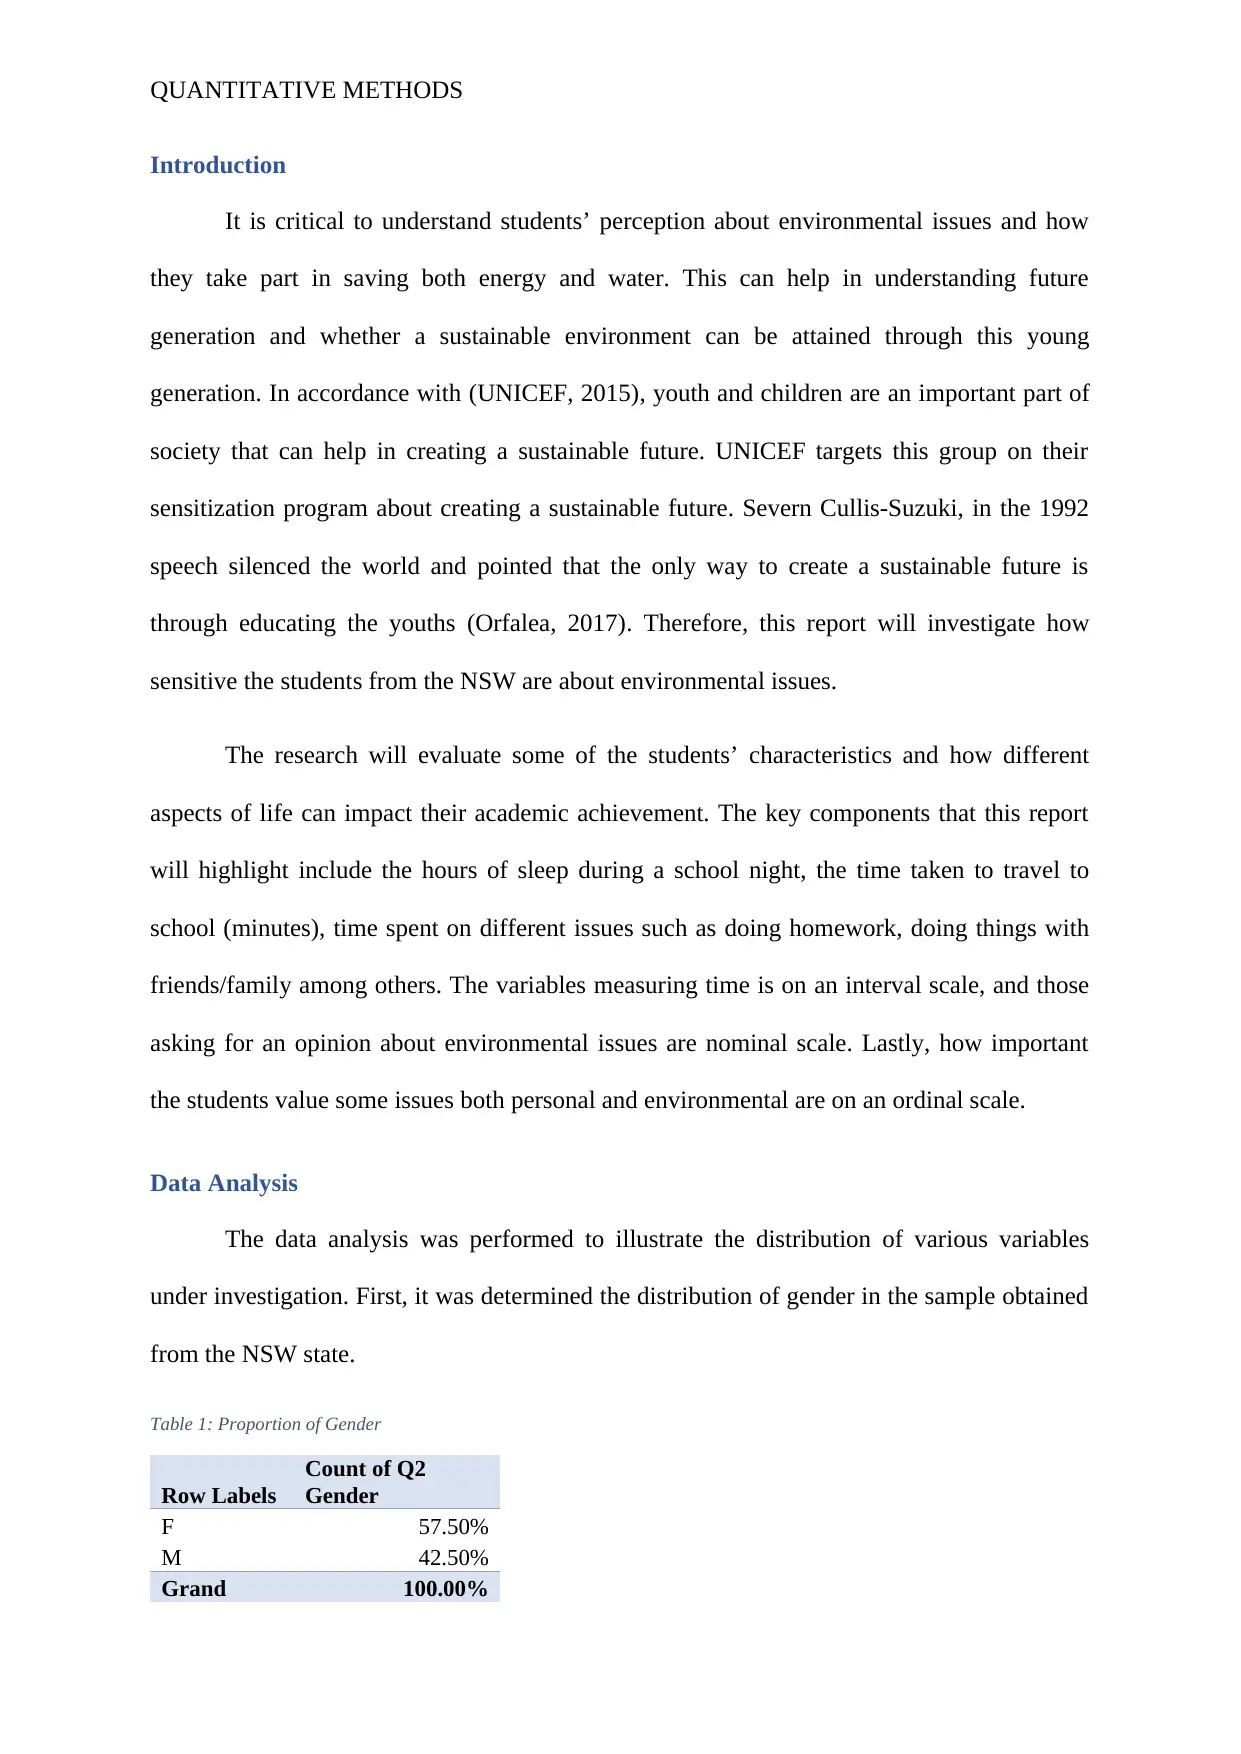
The data analysis was performed to illustrate the distribution of various variables
under investigation. First, it was determined the distribution of gender in the sample obtained
from the NSW state.
Table 1: Proportion of Gender
Row Labels
Count of Q2
Gender
F 57.50%
M 42.50%
Grand 100.00%
Introduction
It is critical to understand students’ perception about environmental issues and how
they take part in saving both energy and water. This can help in understanding future
generation and whether a sustainable environment can be attained through this young
generation. In accordance with (UNICEF, 2015), youth and children are an important part of
society that can help in creating a sustainable future. UNICEF targets this group on their
sensitization program about creating a sustainable future. Severn Cullis-Suzuki, in the 1992
speech silenced the world and pointed that the only way to create a sustainable future is
through educating the youths (Orfalea, 2017). Therefore, this report will investigate how
sensitive the students from the NSW are about environmental issues.
The research will evaluate some of the students’ characteristics and how different
aspects of life can impact their academic achievement. The key components that this report
will highlight include the hours of sleep during a school night, the time taken to travel to
school (minutes), time spent on different issues such as doing homework, doing things with
friends/family among others. The variables measuring time is on an interval scale, and those
asking for an opinion about environmental issues are nominal scale. Lastly, how important
the students value some issues both personal and environmental are on an ordinal scale.
Data Analysis
The data analysis was performed to illustrate the distribution of various variables
under investigation. First, it was determined the distribution of gender in the sample obtained
from the NSW state.
Table 1: Proportion of Gender
Row Labels
Count of Q2
Gender
F 57.50%
M 42.50%
Grand 100.00%
QUANTITATIVE METHODS
Total
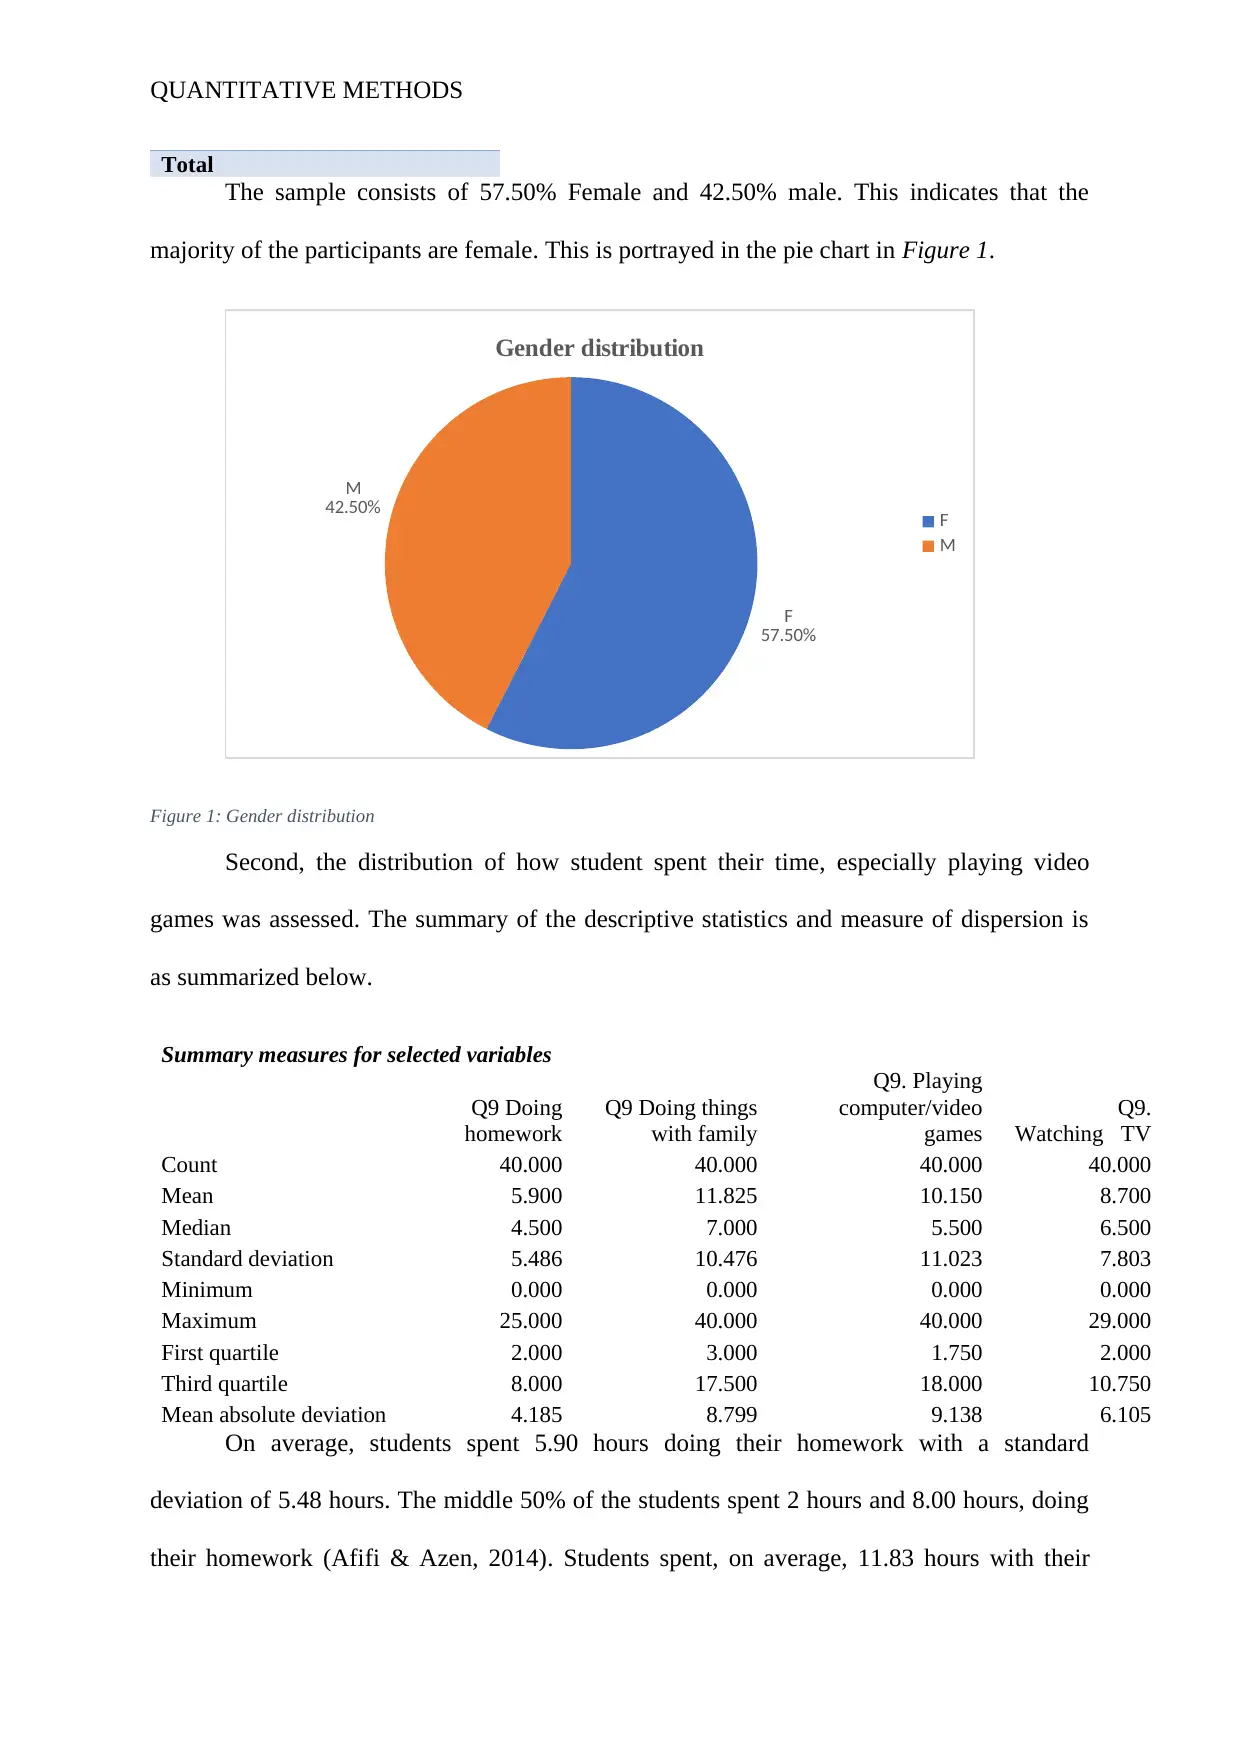
The sample consists of 57.50% Female and 42.50% male. This indicates that the
majority of the participants are female. This is portrayed in the pie chart in Figure 1.
F
57.50%
M
42.50%
Gender distribution
F
M
Figure 1: Gender distribution
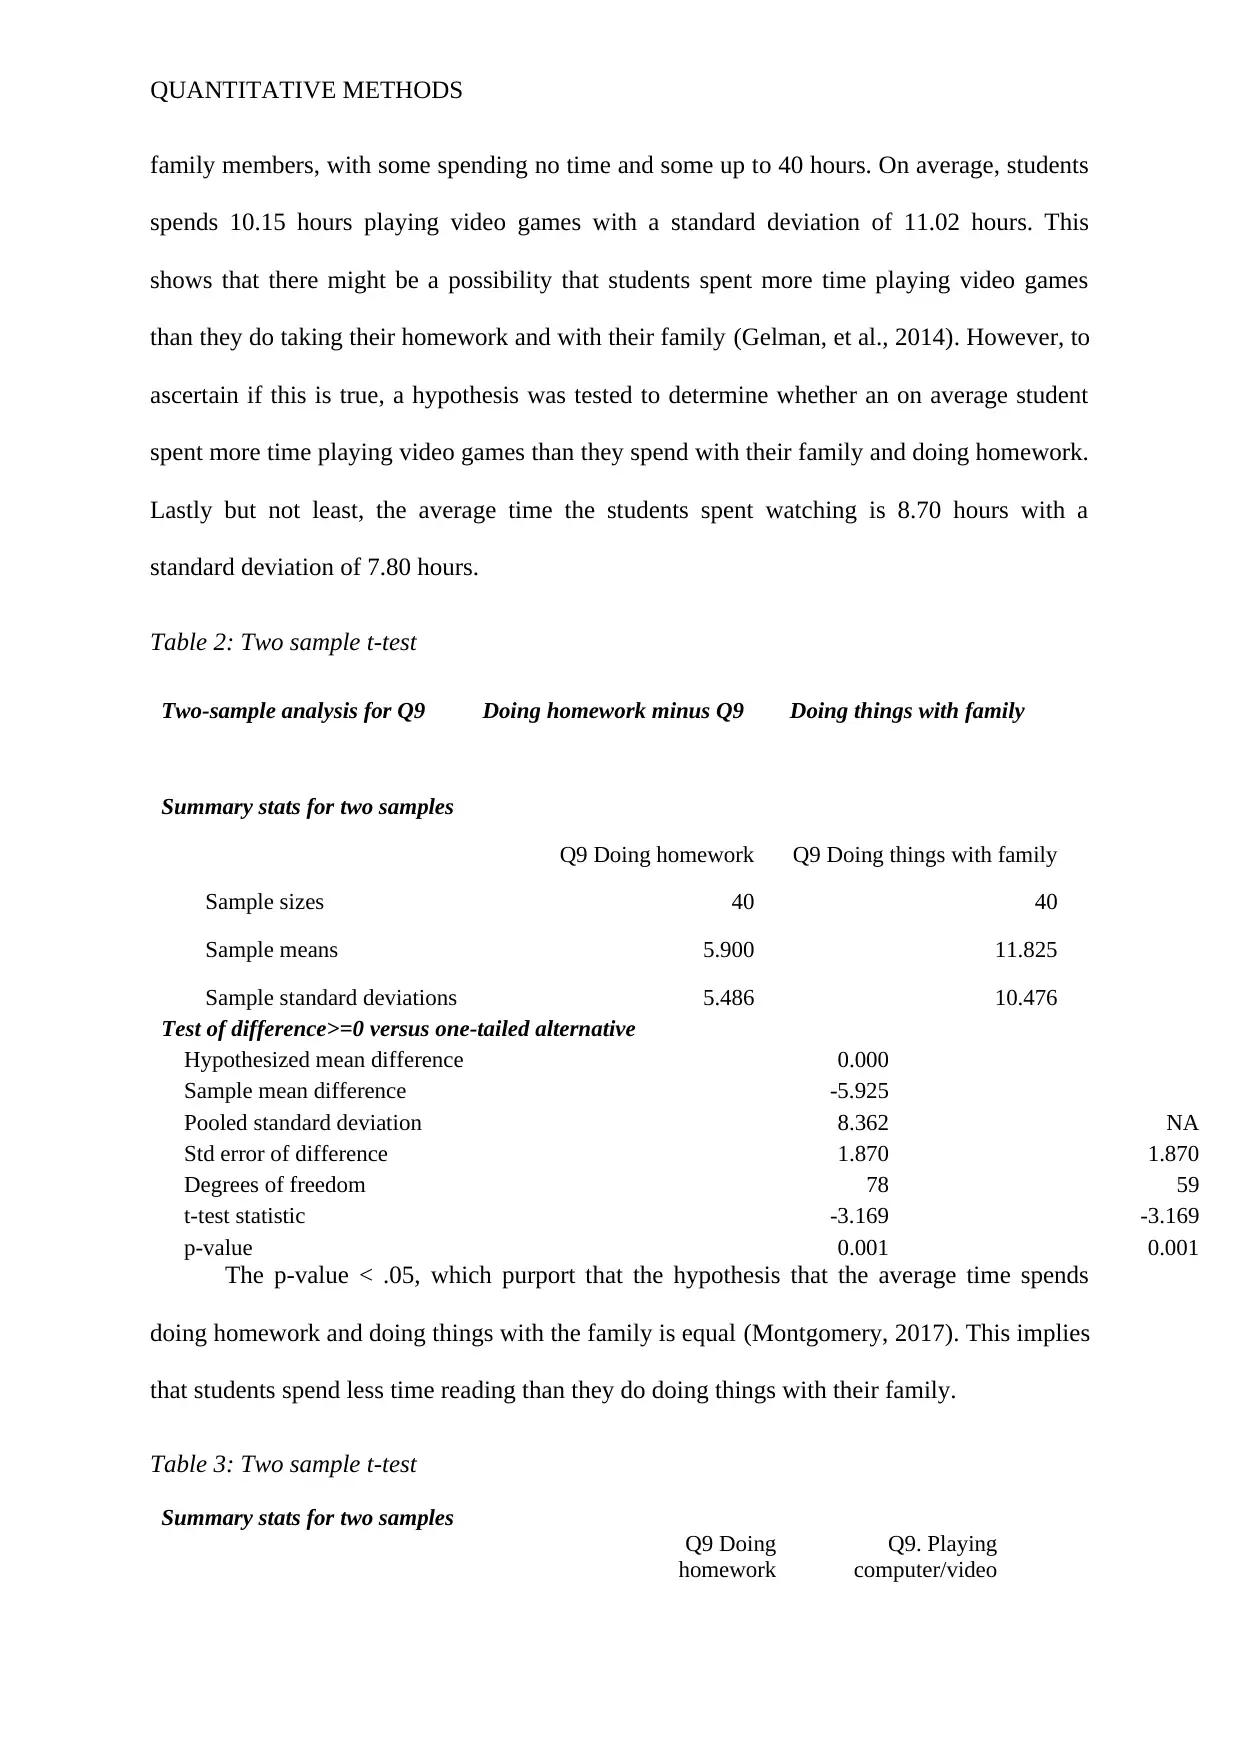
Second, the distribution of how student spent their time, especially playing video
games was assessed. The summary of the descriptive statistics and measure of dispersion is
as summarized below.
Summary measures for selected variables
Q9 Doing
homework
Q9 Doing things
with family
Q9. Playing
computer/video
games
Q9.
Watching TV
Count 40.000 40.000 40.000 40.000
Mean 5.900 11.825 10.150 8.700
Median 4.500 7.000 5.500 6.500
Standard deviation 5.486 10.476 11.023 7.803
Minimum 0.000 0.000 0.000 0.000
Maximum 25.000 40.000 40.000 29.000
First quartile 2.000 3.000 1.750 2.000
Third quartile 8.000 17.500 18.000 10.750
Mean absolute deviation 4.185 8.799 9.138 6.105
On average, students spent 5.90 hours doing their homework with a standard
deviation of 5.48 hours. The middle 50% of the students spent 2 hours and 8.00 hours, doing
their homework (Afifi & Azen, 2014). Students spent, on average, 11.83 hours with their
Total
The sample consists of 57.50% Female and 42.50% male. This indicates that the
majority of the participants are female. This is portrayed in the pie chart in Figure 1.
F
57.50%
M
42.50%
Gender distribution
F
M
Figure 1: Gender distribution
Second, the distribution of how student spent their time, especially playing video
games was assessed. The summary of the descriptive statistics and measure of dispersion is
as summarized below.
Summary measures for selected variables
Q9 Doing
homework
Q9 Doing things
with family
Q9. Playing
computer/video
games
Q9.
Watching TV
Count 40.000 40.000 40.000 40.000
Mean 5.900 11.825 10.150 8.700
Median 4.500 7.000 5.500 6.500
Standard deviation 5.486 10.476 11.023 7.803
Minimum 0.000 0.000 0.000 0.000
Maximum 25.000 40.000 40.000 29.000
First quartile 2.000 3.000 1.750 2.000
Third quartile 8.000 17.500 18.000 10.750
Mean absolute deviation 4.185 8.799 9.138 6.105
On average, students spent 5.90 hours doing their homework with a standard
deviation of 5.48 hours. The middle 50% of the students spent 2 hours and 8.00 hours, doing
their homework (Afifi & Azen, 2014). Students spent, on average, 11.83 hours with their
⊘ This is a preview!⊘
Do you want full access?
Subscribe today to unlock all pages.
Trusted by 1+ million students worldwide
QUANTITATIVE METHODS
family members, with some spending no time and some up to 40 hours. On average, students
spends 10.15 hours playing video games with a standard deviation of 11.02 hours. This
shows that there might be a possibility that students spent more time playing video games
than they do taking their homework and with their family (Gelman, et al., 2014). However, to
ascertain if this is true, a hypothesis was tested to determine whether an on average student
spent more time playing video games than they spend with their family and doing homework.
Lastly but not least, the average time the students spent watching is 8.70 hours with a
standard deviation of 7.80 hours.
Table 2: Two sample t-test
Two-sample analysis for Q9 Doing homework minus Q9 Doing things with family
Summary stats for two samples
Q9 Doing homework Q9 Doing things with family
Sample sizes 40 40
Sample means 5.900 11.825
Sample standard deviations 5.486 10.476
Test of difference>=0 versus one-tailed alternative
Hypothesized mean difference 0.000
Sample mean difference -5.925
Pooled standard deviation 8.362 NA
Std error of difference 1.870 1.870
Degrees of freedom 78 59
t-test statistic -3.169 -3.169
p-value 0.001 0.001
The p-value < .05, which purport that the hypothesis that the average time spends
doing homework and doing things with the family is equal (Montgomery, 2017). This implies
that students spend less time reading than they do doing things with their family.
Table 3: Two sample t-test
Summary stats for two samples
Q9 Doing
homework
Q9. Playing
computer/video
Paraphrase This Document
Need a fresh take? Get an instant paraphrase of this document with our AI Paraphraser
QUANTITATIVE METHODS
games
Sample sizes 40 40
Sample means 5.900 10.150
Sample standard deviations 5.486 11.023
Test of difference>=0 versus one-tailed alternative
Hypothesized mean difference 0.000
Sample mean difference -4.250
Pooled standard deviation 8.707 NA
Std error of difference 1.947 1.947
Degrees of freedom 78 57
t-test statistic -2.183 -2.183
p-value 0.016 0.017
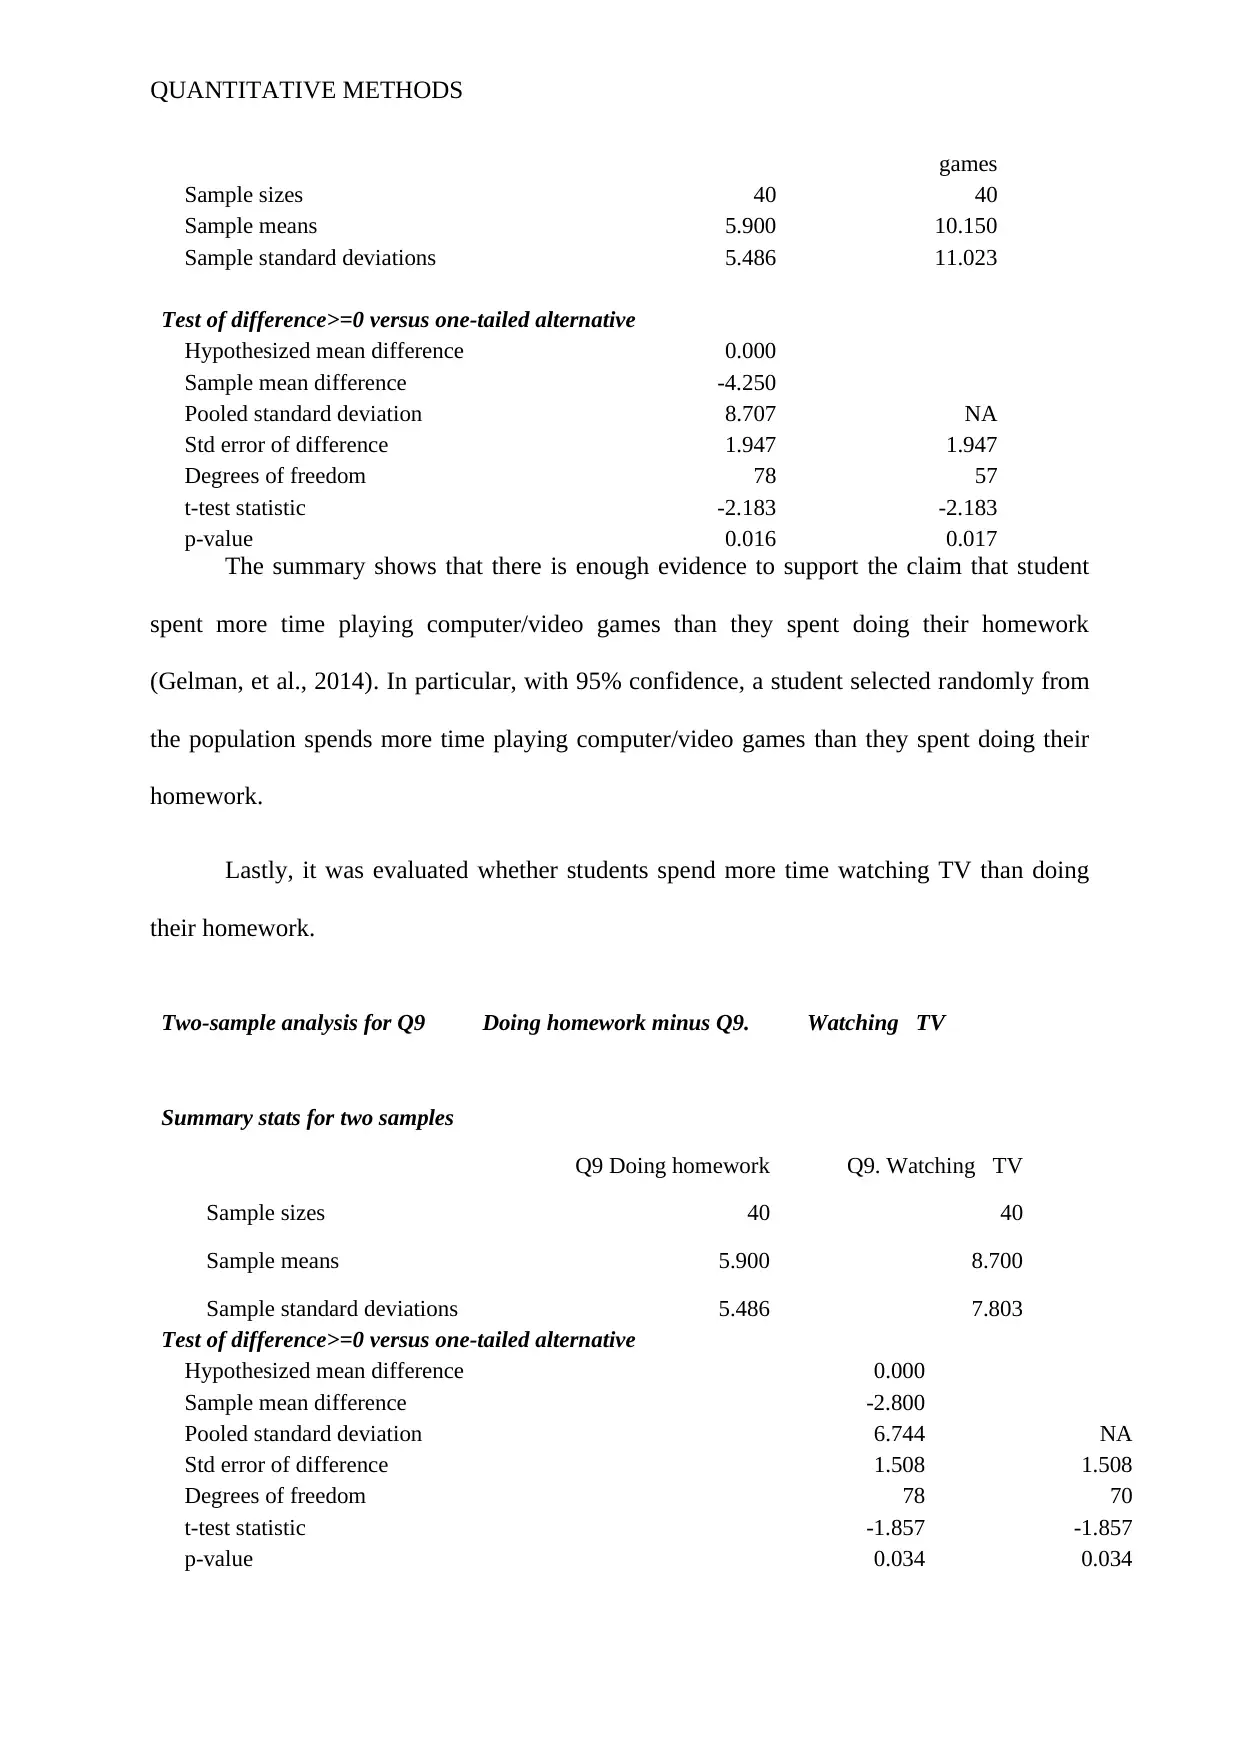
The summary shows that there is enough evidence to support the claim that student
spent more time playing computer/video games than they spent doing their homework
(Gelman, et al., 2014). In particular, with 95% confidence, a student selected randomly from
the population spends more time playing computer/video games than they spent doing their
homework.
Lastly, it was evaluated whether students spend more time watching TV than doing
their homework.
Two-sample analysis for Q9 Doing homework minus Q9. Watching TV
Summary stats for two samples
Q9 Doing homework Q9. Watching TV
Sample sizes 40 40
Sample means 5.900 8.700
Sample standard deviations 5.486 7.803
Test of difference>=0 versus one-tailed alternative
Hypothesized mean difference 0.000
Sample mean difference -2.800
Pooled standard deviation 6.744 NA
Std error of difference 1.508 1.508
Degrees of freedom 78 70
t-test statistic -1.857 -1.857
p-value 0.034 0.034
games
Sample sizes 40 40
Sample means 5.900 10.150
Sample standard deviations 5.486 11.023
Test of difference>=0 versus one-tailed alternative
Hypothesized mean difference 0.000
Sample mean difference -4.250
Pooled standard deviation 8.707 NA
Std error of difference 1.947 1.947
Degrees of freedom 78 57
t-test statistic -2.183 -2.183
p-value 0.016 0.017
The summary shows that there is enough evidence to support the claim that student
spent more time playing computer/video games than they spent doing their homework
(Gelman, et al., 2014). In particular, with 95% confidence, a student selected randomly from
the population spends more time playing computer/video games than they spent doing their
homework.
Lastly, it was evaluated whether students spend more time watching TV than doing
their homework.
Two-sample analysis for Q9 Doing homework minus Q9. Watching TV
Summary stats for two samples
Q9 Doing homework Q9. Watching TV
Sample sizes 40 40
Sample means 5.900 8.700
Sample standard deviations 5.486 7.803
Test of difference>=0 versus one-tailed alternative
Hypothesized mean difference 0.000
Sample mean difference -2.800
Pooled standard deviation 6.744 NA
Std error of difference 1.508 1.508
Degrees of freedom 78 70
t-test statistic -1.857 -1.857
p-value 0.034 0.034
QUANTITATIVE METHODS
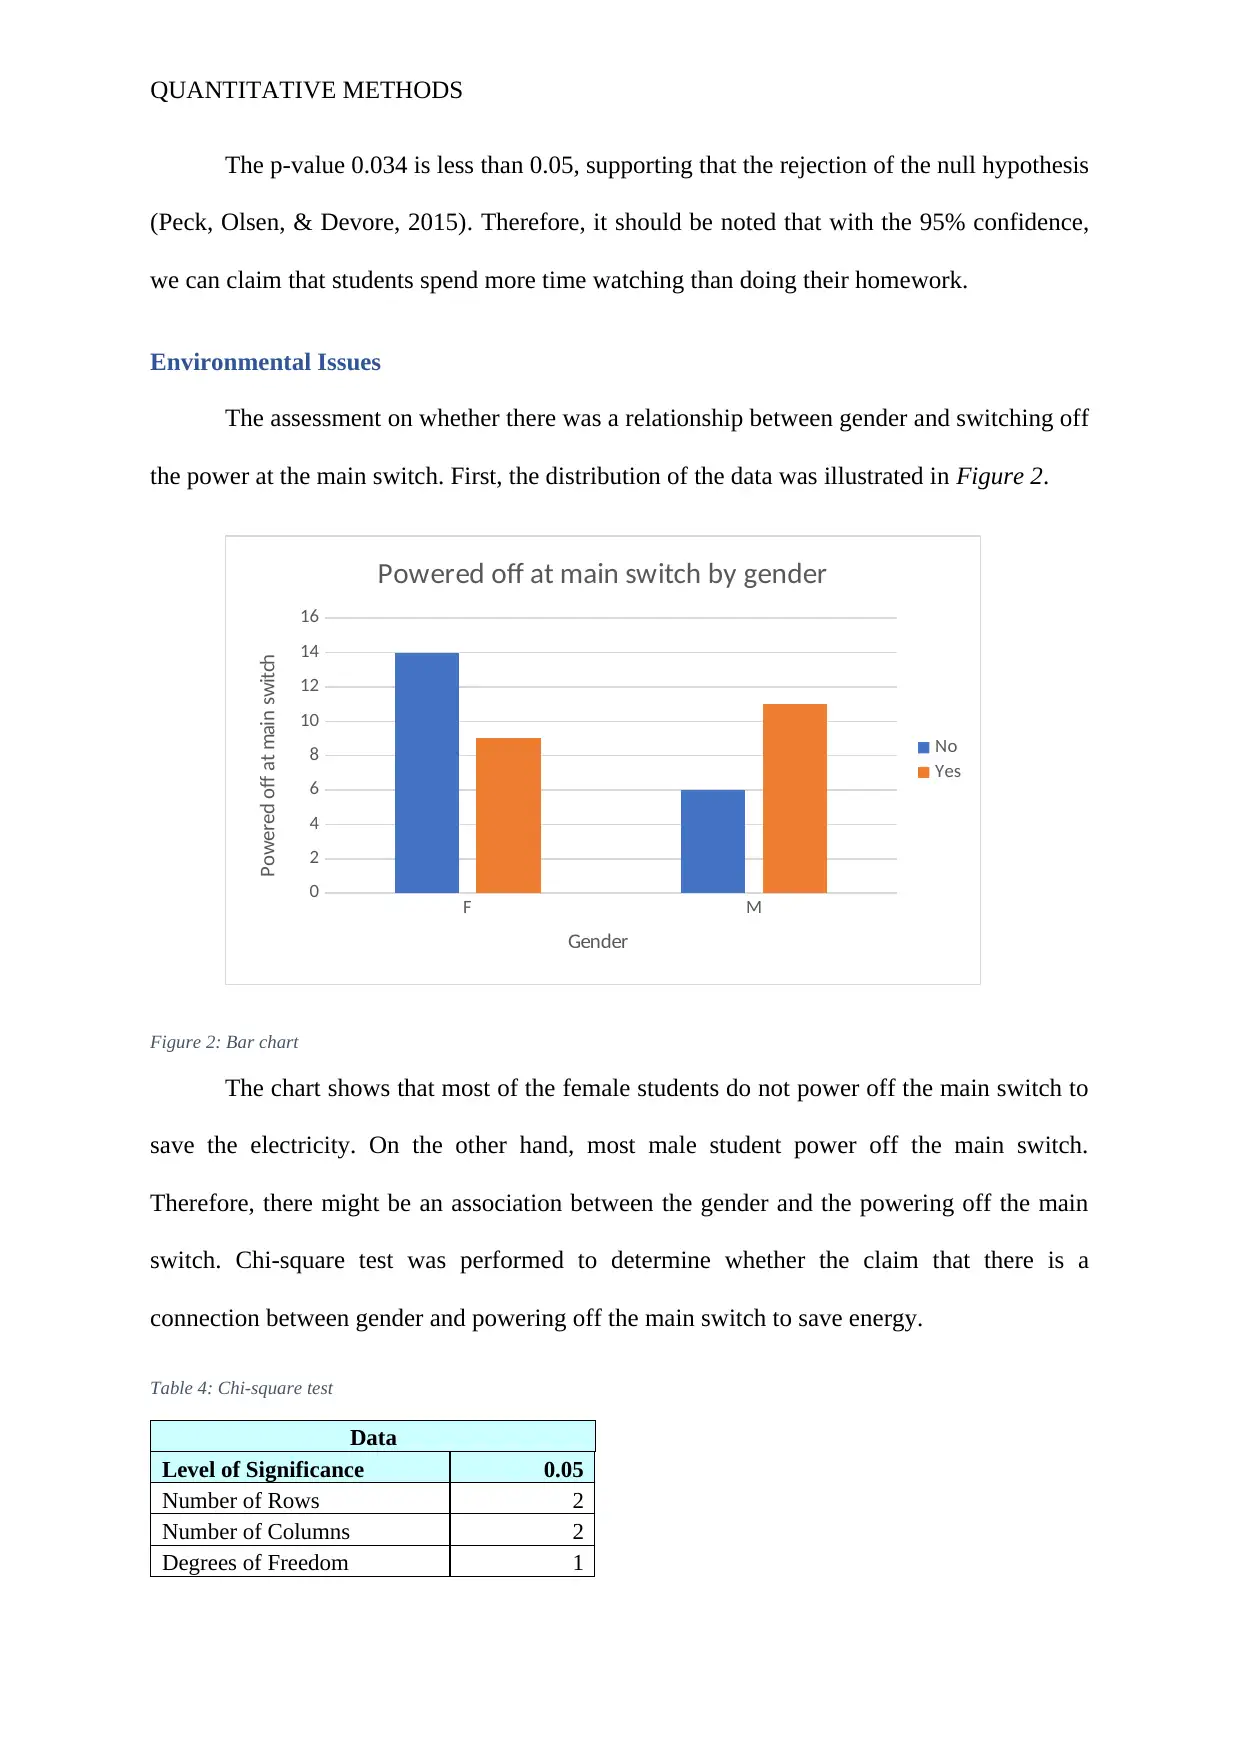
The p-value 0.034 is less than 0.05, supporting that the rejection of the null hypothesis
(Peck, Olsen, & Devore, 2015). Therefore, it should be noted that with the 95% confidence,
we can claim that students spend more time watching than doing their homework.
Environmental Issues
The assessment on whether there was a relationship between gender and switching off
the power at the main switch. First, the distribution of the data was illustrated in Figure 2.
F M
0
2
4
6
8
10
12
14
16
Powered off at main switch by gender
No
Yes
Gender
Powered off at main switch
Figure 2: Bar chart
The chart shows that most of the female students do not power off the main switch to
save the electricity. On the other hand, most male student power off the main switch.
Therefore, there might be an association between the gender and the powering off the main
switch. Chi-square test was performed to determine whether the claim that there is a
connection between gender and powering off the main switch to save energy.
Table 4: Chi-square test
Data
Level of Significance 0.05
Number of Rows 2
Number of Columns 2
Degrees of Freedom 1
⊘ This is a preview!⊘
Do you want full access?
Subscribe today to unlock all pages.
Trusted by 1+ million students worldwide
QUANTITATIVE METHODS
Results
Critical Value 3.841458821
Chi-Square Test Statistic 2.557544757
p-Value 0.10976894
Do not reject the null hypothesis
Expected frequency assumption
is met.
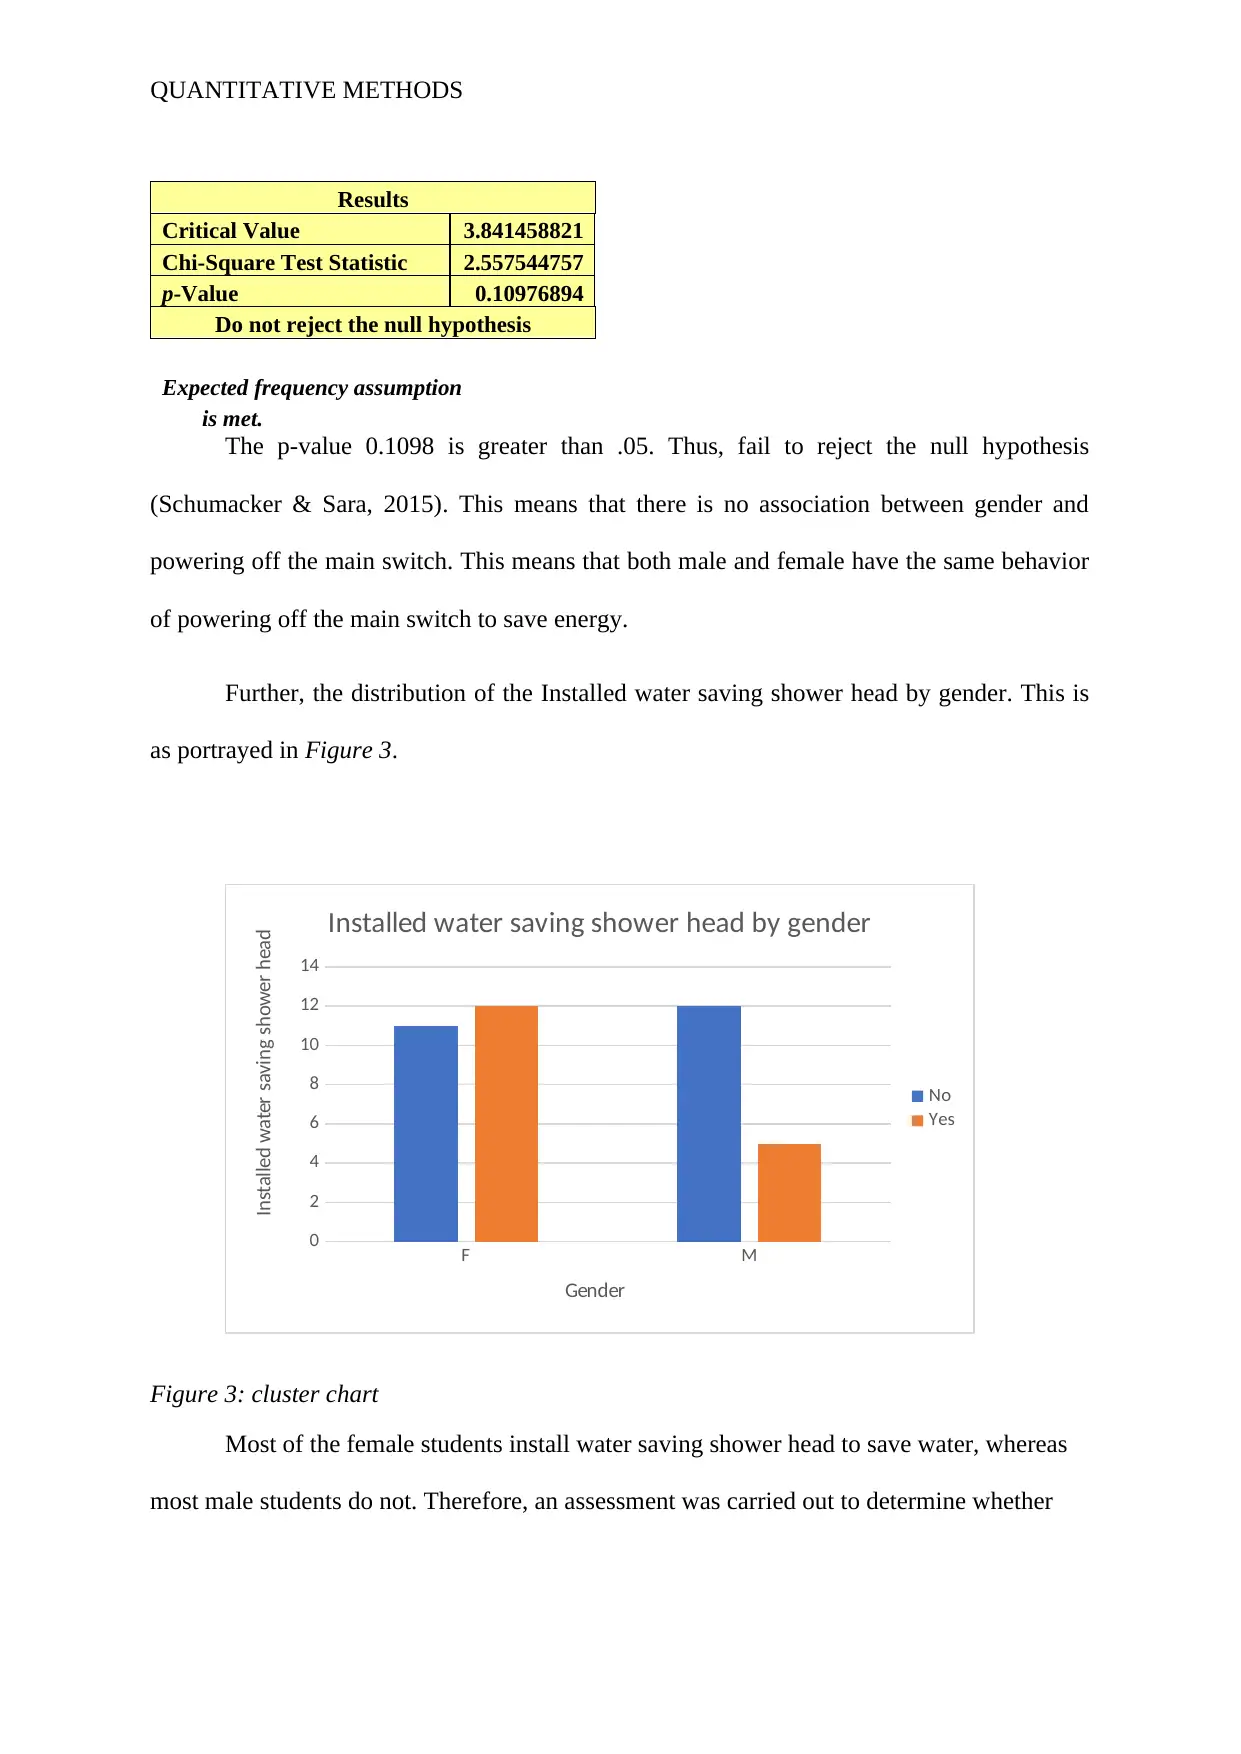
The p-value 0.1098 is greater than .05. Thus, fail to reject the null hypothesis
(Schumacker & Sara, 2015). This means that there is no association between gender and
powering off the main switch. This means that both male and female have the same behavior
of powering off the main switch to save energy.
Further, the distribution of the Installed water saving shower head by gender. This is
as portrayed in Figure 3.
F M
0
2
4
6
8
10
12
14
Installed water saving shower head by gender
No
Yes
Gender
Installed water saving shower head
Figure 3: cluster chart
Most of the female students install water saving shower head to save water, whereas
most male students do not. Therefore, an assessment was carried out to determine whether
Results
Critical Value 3.841458821
Chi-Square Test Statistic 2.557544757
p-Value 0.10976894
Do not reject the null hypothesis
Expected frequency assumption
is met.
The p-value 0.1098 is greater than .05. Thus, fail to reject the null hypothesis
(Schumacker & Sara, 2015). This means that there is no association between gender and
powering off the main switch. This means that both male and female have the same behavior
of powering off the main switch to save energy.
Further, the distribution of the Installed water saving shower head by gender. This is
as portrayed in Figure 3.
F M
0
2
4
6
8
10
12
14
Installed water saving shower head by gender
No
Yes
Gender
Installed water saving shower head
Figure 3: cluster chart
Most of the female students install water saving shower head to save water, whereas
most male students do not. Therefore, an assessment was carried out to determine whether
Paraphrase This Document
Need a fresh take? Get an instant paraphrase of this document with our AI Paraphraser
QUANTITATIVE METHODS
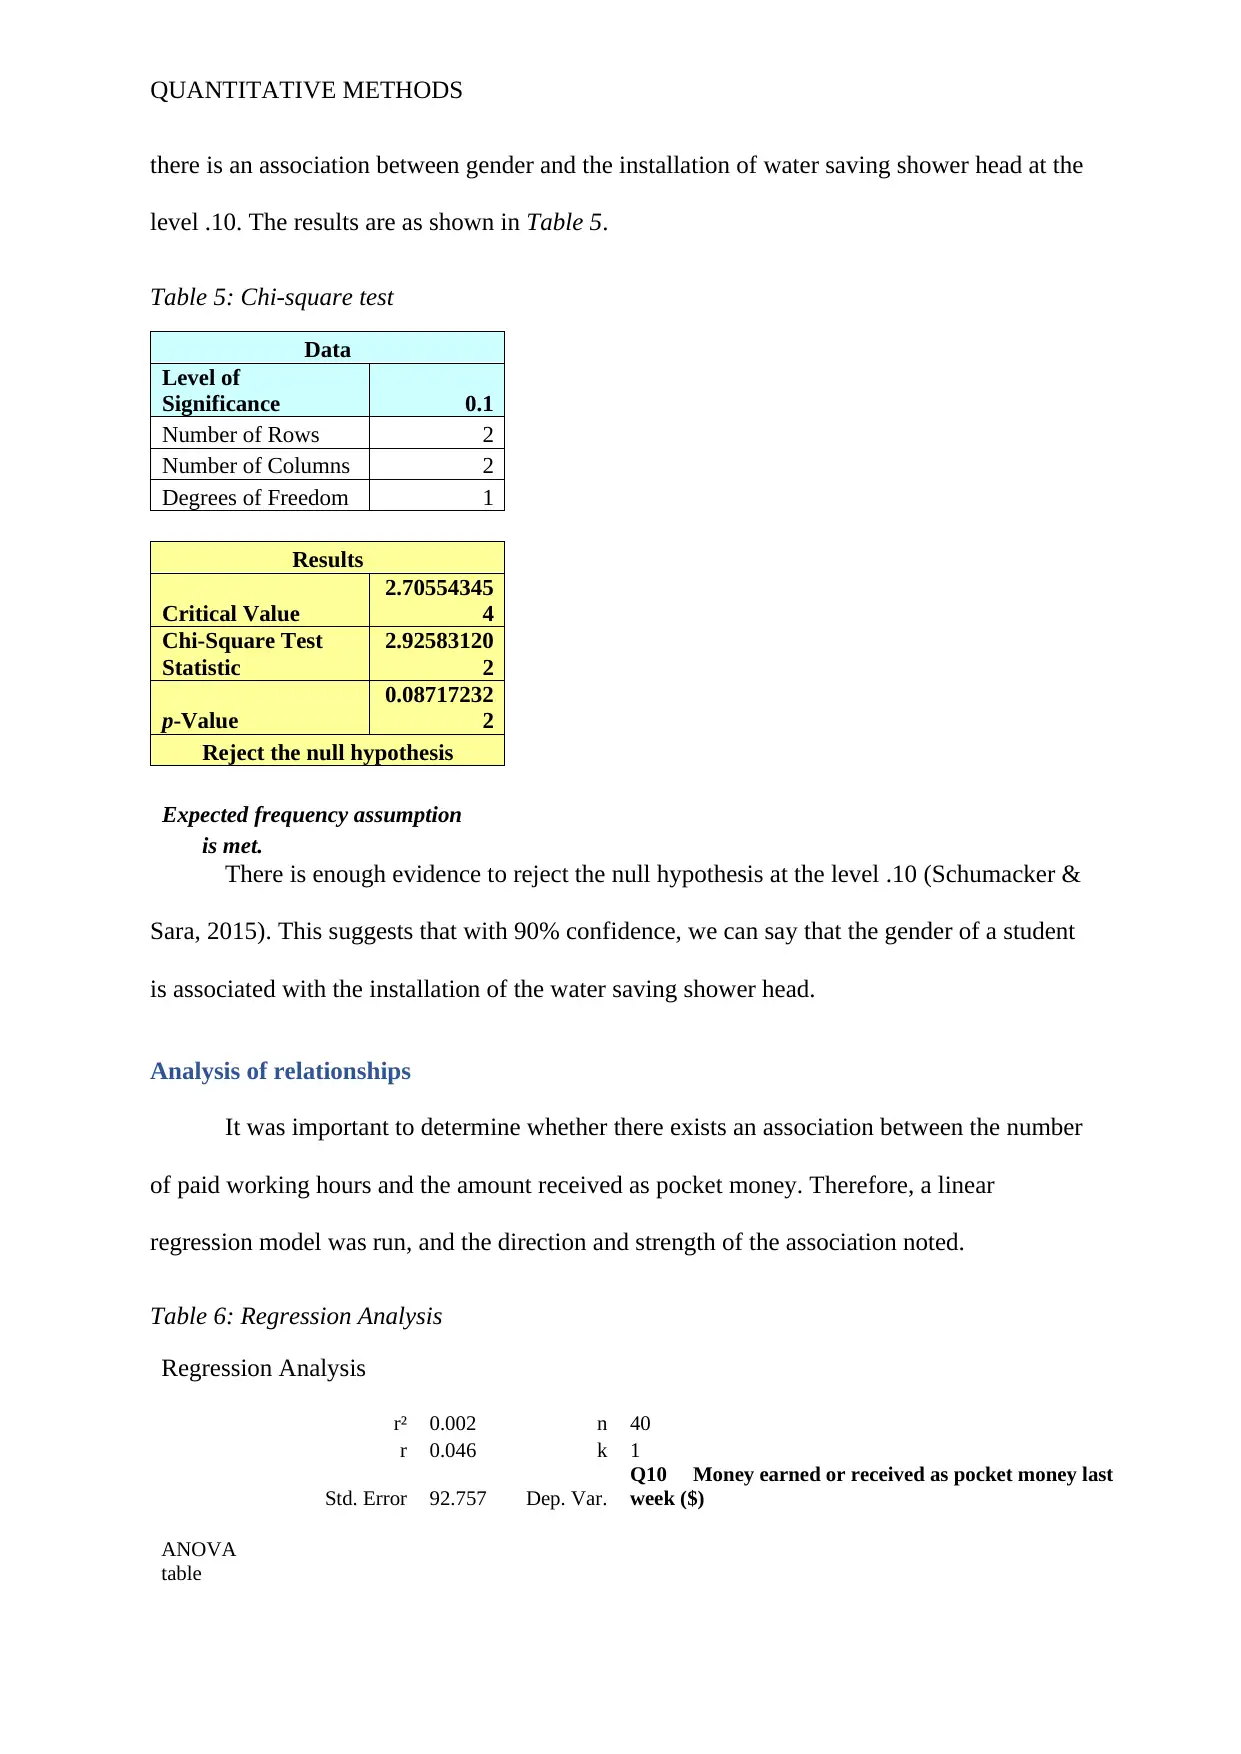
there is an association between gender and the installation of water saving shower head at the
level .10. The results are as shown in Table 5.
Table 5: Chi-square test
Data
Level of
Significance 0.1
Number of Rows 2
Number of Columns 2
Degrees of Freedom 1
Results
Critical Value
2.70554345
4
Chi-Square Test
Statistic
2.92583120
2
p-Value
0.08717232
2
Reject the null hypothesis
Expected frequency assumption
is met.
There is enough evidence to reject the null hypothesis at the level .10 (Schumacker &
Sara, 2015). This suggests that with 90% confidence, we can say that the gender of a student
is associated with the installation of the water saving shower head.
Analysis of relationships
It was important to determine whether there exists an association between the number
of paid working hours and the amount received as pocket money. Therefore, a linear
regression model was run, and the direction and strength of the association noted.
Table 6: Regression Analysis
Regression Analysis
r² 0.002 n 40
r 0.046 k 1
Std. Error 92.757 Dep. Var.
Q10 Money earned or received as pocket money last
week ($)
ANOVA
table
QUANTITATIVE METHODS
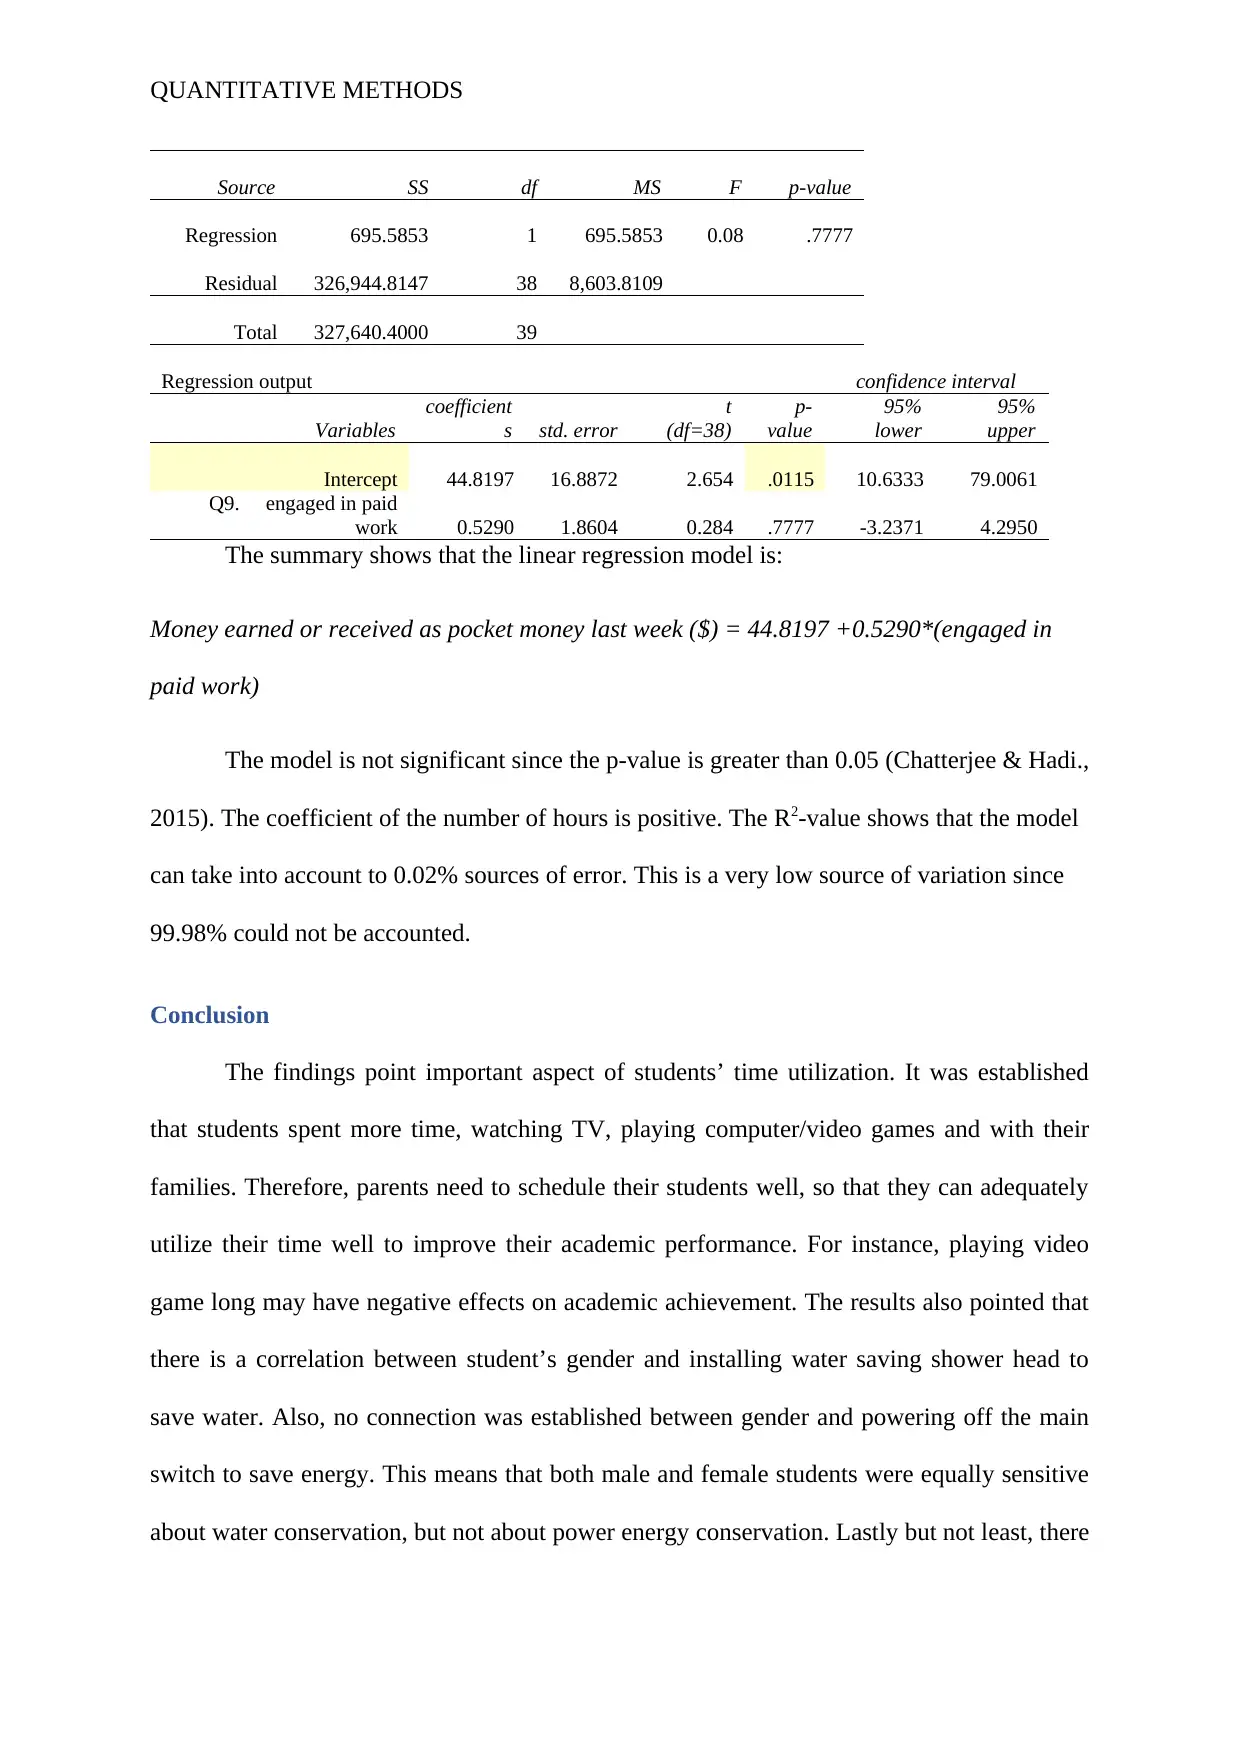
Source SS df MS F p-value
Regression 695.5853 1 695.5853 0.08 .7777
Residual 326,944.8147 38 8,603.8109
Total 327,640.4000 39
Regression output confidence interval
Variables
coefficient
s std. error
t
(df=38)
p-
value
95%
lower
95%
upper
Intercept 44.8197 16.8872 2.654 .0115 10.6333 79.0061
Q9. engaged in paid
work 0.5290 1.8604 0.284 .7777 -3.2371 4.2950
The summary shows that the linear regression model is:
Money earned or received as pocket money last week ($) = 44.8197 +0.5290*(engaged in
paid work)
The model is not significant since the p-value is greater than 0.05 (Chatterjee & Hadi.,
2015). The coefficient of the number of hours is positive. The R2-value shows that the model
can take into account to 0.02% sources of error. This is a very low source of variation since
99.98% could not be accounted.
Conclusion
The findings point important aspect of students’ time utilization. It was established
that students spent more time, watching TV, playing computer/video games and with their
families. Therefore, parents need to schedule their students well, so that they can adequately
utilize their time well to improve their academic performance. For instance, playing video
game long may have negative effects on academic achievement. The results also pointed that
there is a correlation between student’s gender and installing water saving shower head to
save water. Also, no connection was established between gender and powering off the main
switch to save energy. This means that both male and female students were equally sensitive
about water conservation, but not about power energy conservation. Lastly but not least, there
⊘ This is a preview!⊘
Do you want full access?
Subscribe today to unlock all pages.
Trusted by 1+ million students worldwide
QUANTITATIVE METHODS
was no relationship between the number of hours student spent on a paid work and the
amount they receive as pocket money.
It should be noted that there might be one gender that is more sensitive on water
conservation than the other. Therefore, the government should conduct a sensitization
program to increase water conservation strategies like installing water saving shower head to
all people. The parents should discourage a lot of video game playing and Tv watching.
Students should be encouraged to use most of their time improving their studies.
References
Afifi, A. A., & Azen, S. P. (2014). Statistical analysis: a computer oriented approach.
Academic press.
Chatterjee, S., & Hadi., A. S. (2015). Regression analysis by example. John Wiley & Sons.
Gelman, A., Carlin, J. B., Stern, H. S., Dunson, D. B., Vehtari, A., & Rubin, D. B. (2014).
Bayesian data analysis. 2. Boca Raton, FL: CRC press.
Montgomery, D. C. (2017). Design and analysis of experiments. John Wiley & Sons.
Orfalea, M. (2017, June 26). Girl Who Silenced the World (25 yrs later). Retrieved from
Youtube: https://www.youtube.com/watch?v=3ipOdsd1SmA
Peck, R., Olsen, C., & Devore, J. L. (2015). Introduction to statistics and data analysis.
Cengage Learning.
Schumacker, R., & Sara, T. (2015). Chi-square test. Understanding Statistics Using R, 169-
175.
Paraphrase This Document
Need a fresh take? Get an instant paraphrase of this document with our AI Paraphraser

QUANTITATIVE METHODS
UNICEF. (2015, Februalt 13). Environment and climate change. Retrieved October 2, 2017,
from UNICEF: https://www.unicef.org/environment/index_60524.html
UNICEF. (2015, Februalt 13). Environment and climate change. Retrieved October 2, 2017,
from UNICEF: https://www.unicef.org/environment/index_60524.html
1 out of 11

Your All-in-One AI-Powered Toolkit for Academic Success.
+13062052269
info@desklib.com
Available 24*7 on WhatsApp / Email
![[object Object]](/_next/static/media/star-bottom.7253800d.svg)
Unlock your academic potential
Copyright © 2020–2026 A2Z Services. All Rights Reserved. Developed and managed by ZUCOL.