Comprehensive Data Analysis: Statistical Interpretation and Insights
VerifiedAdded on 2023/06/12
|15
|2540
|111
Report
AI Summary
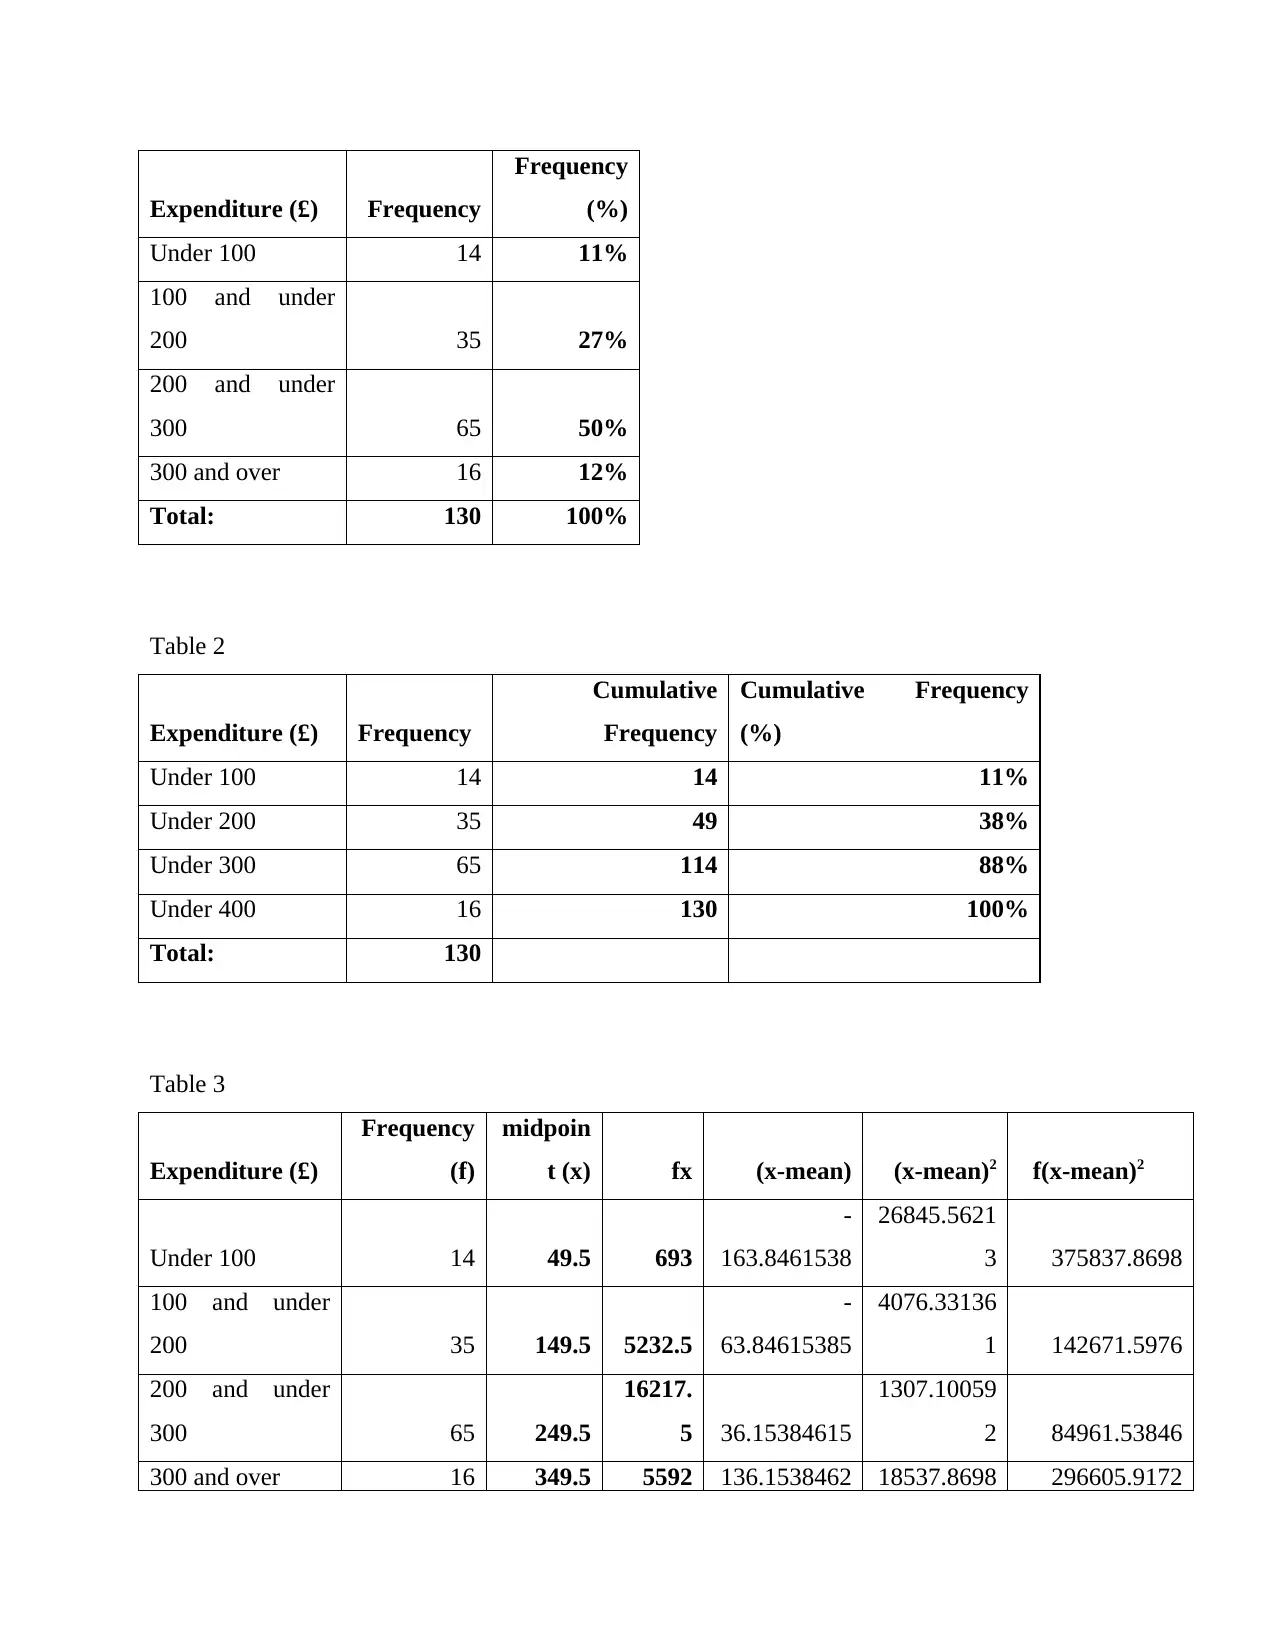
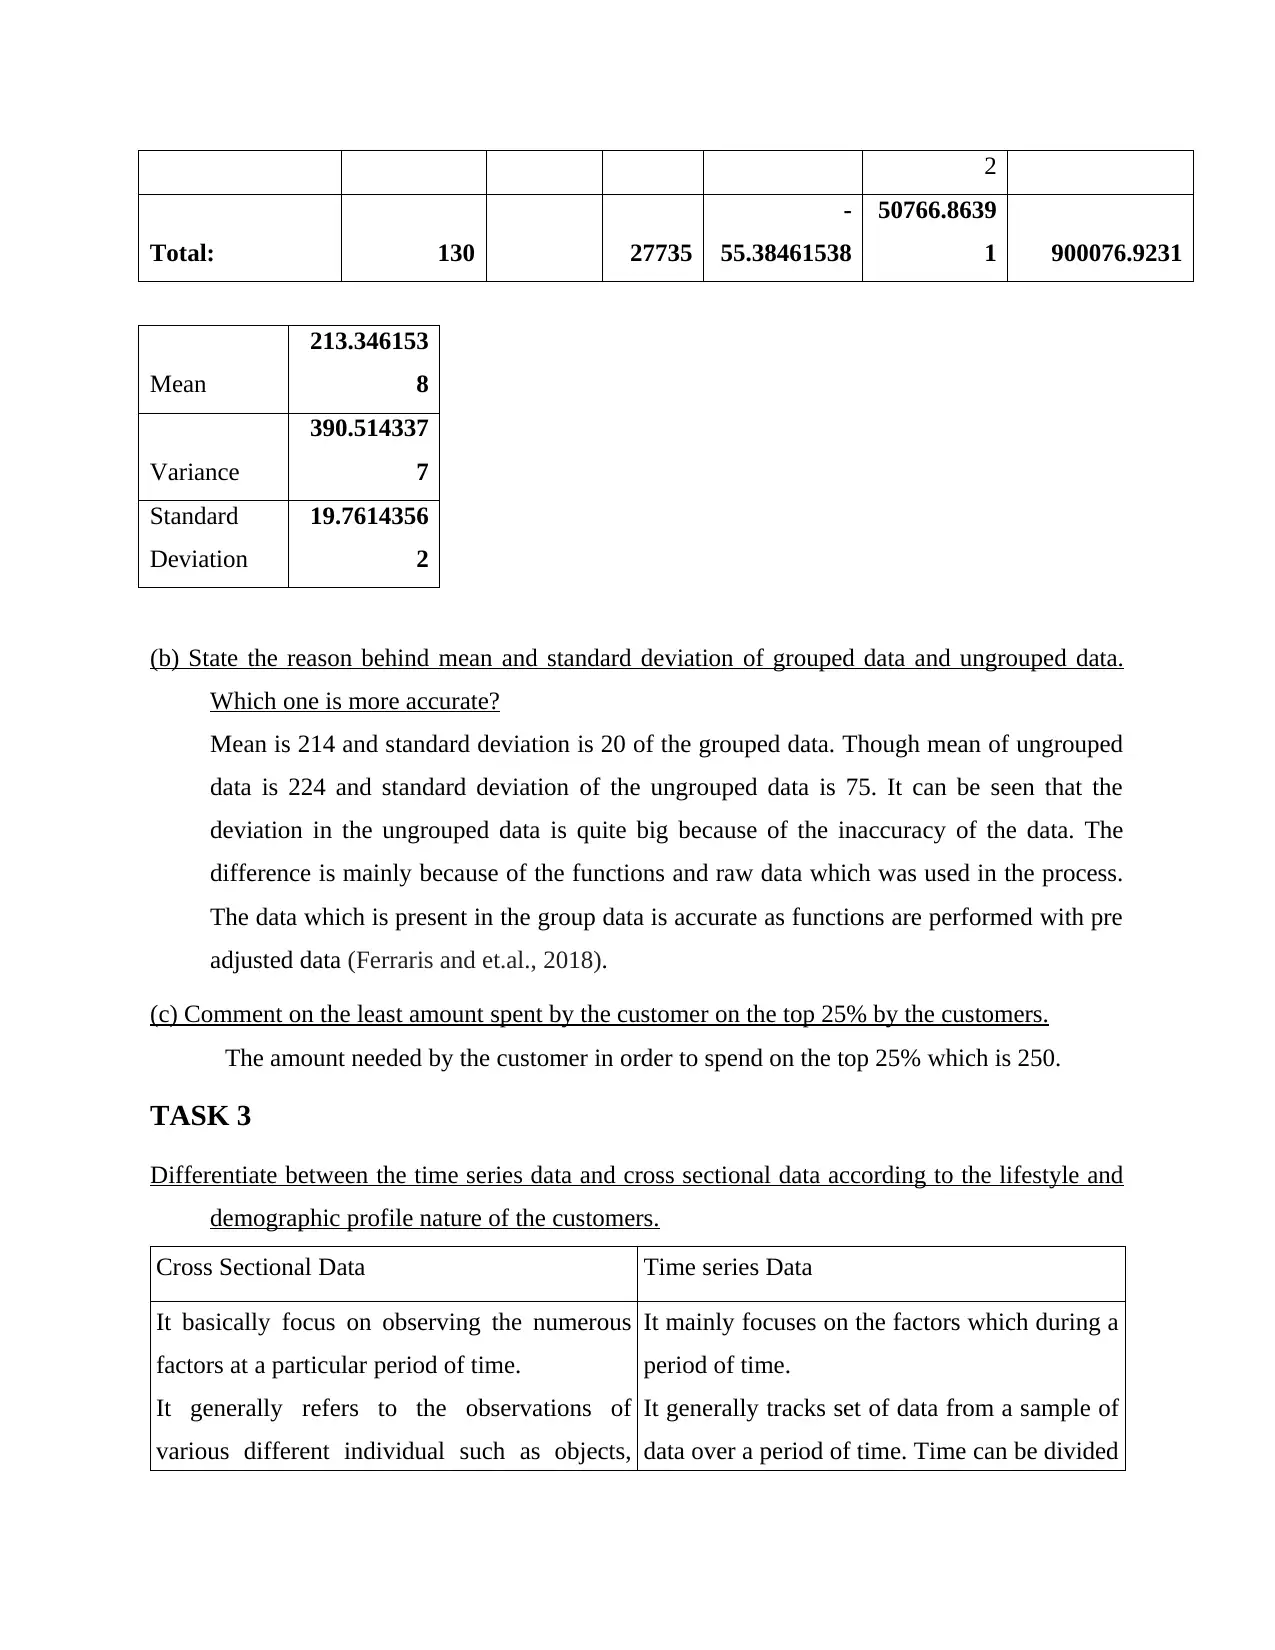
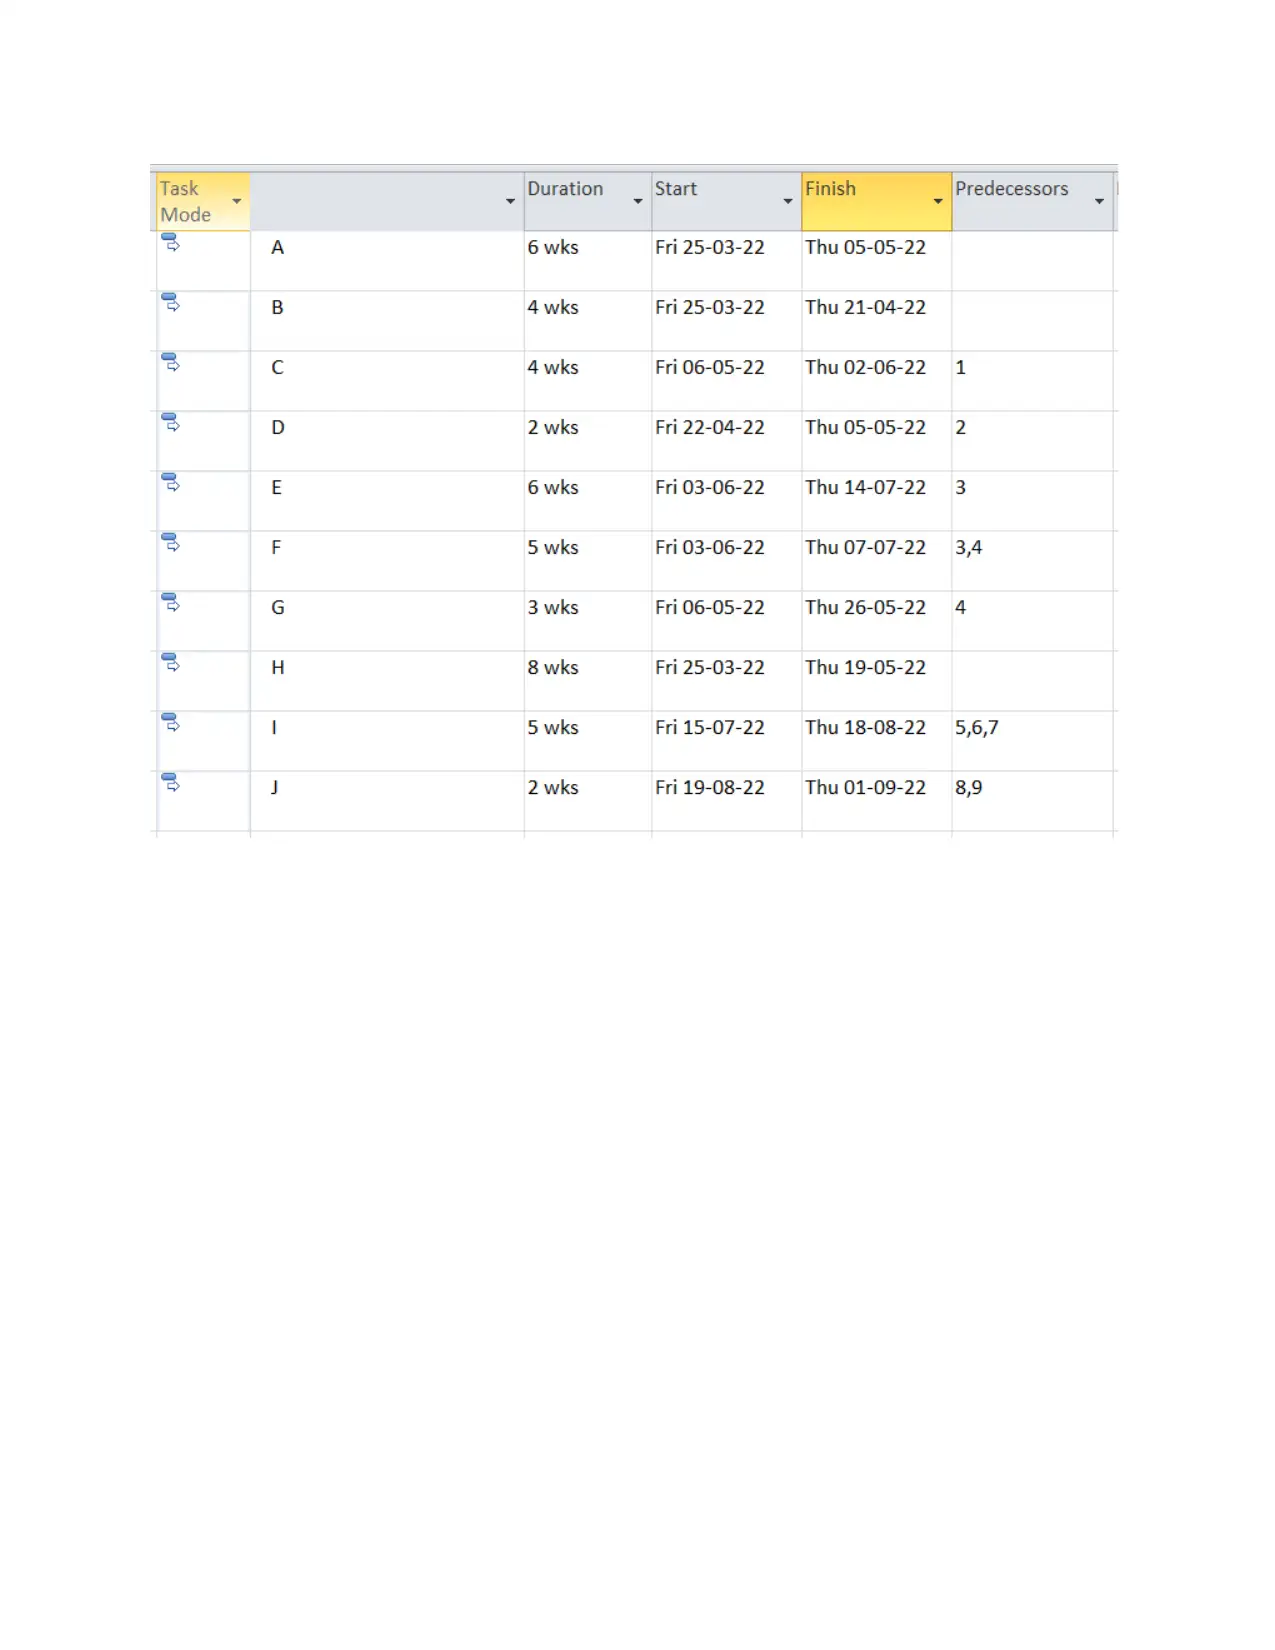
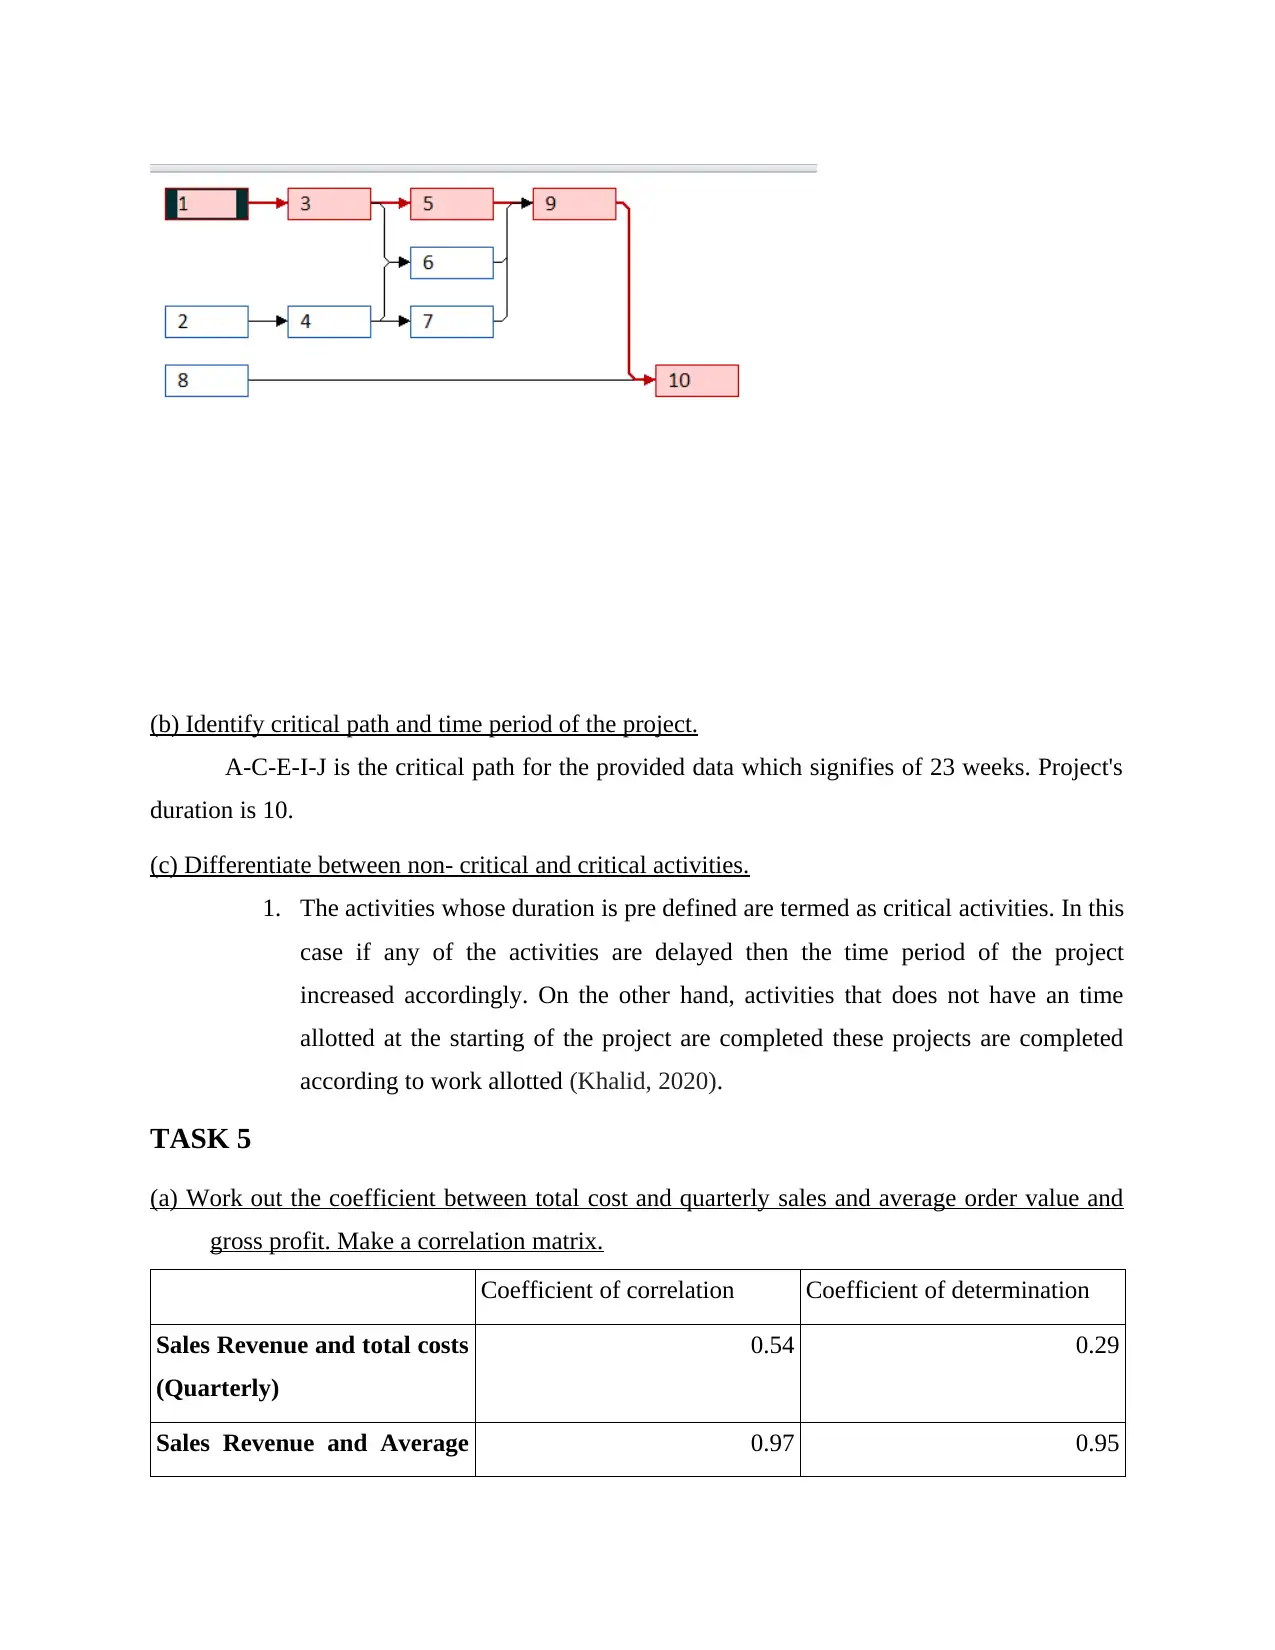
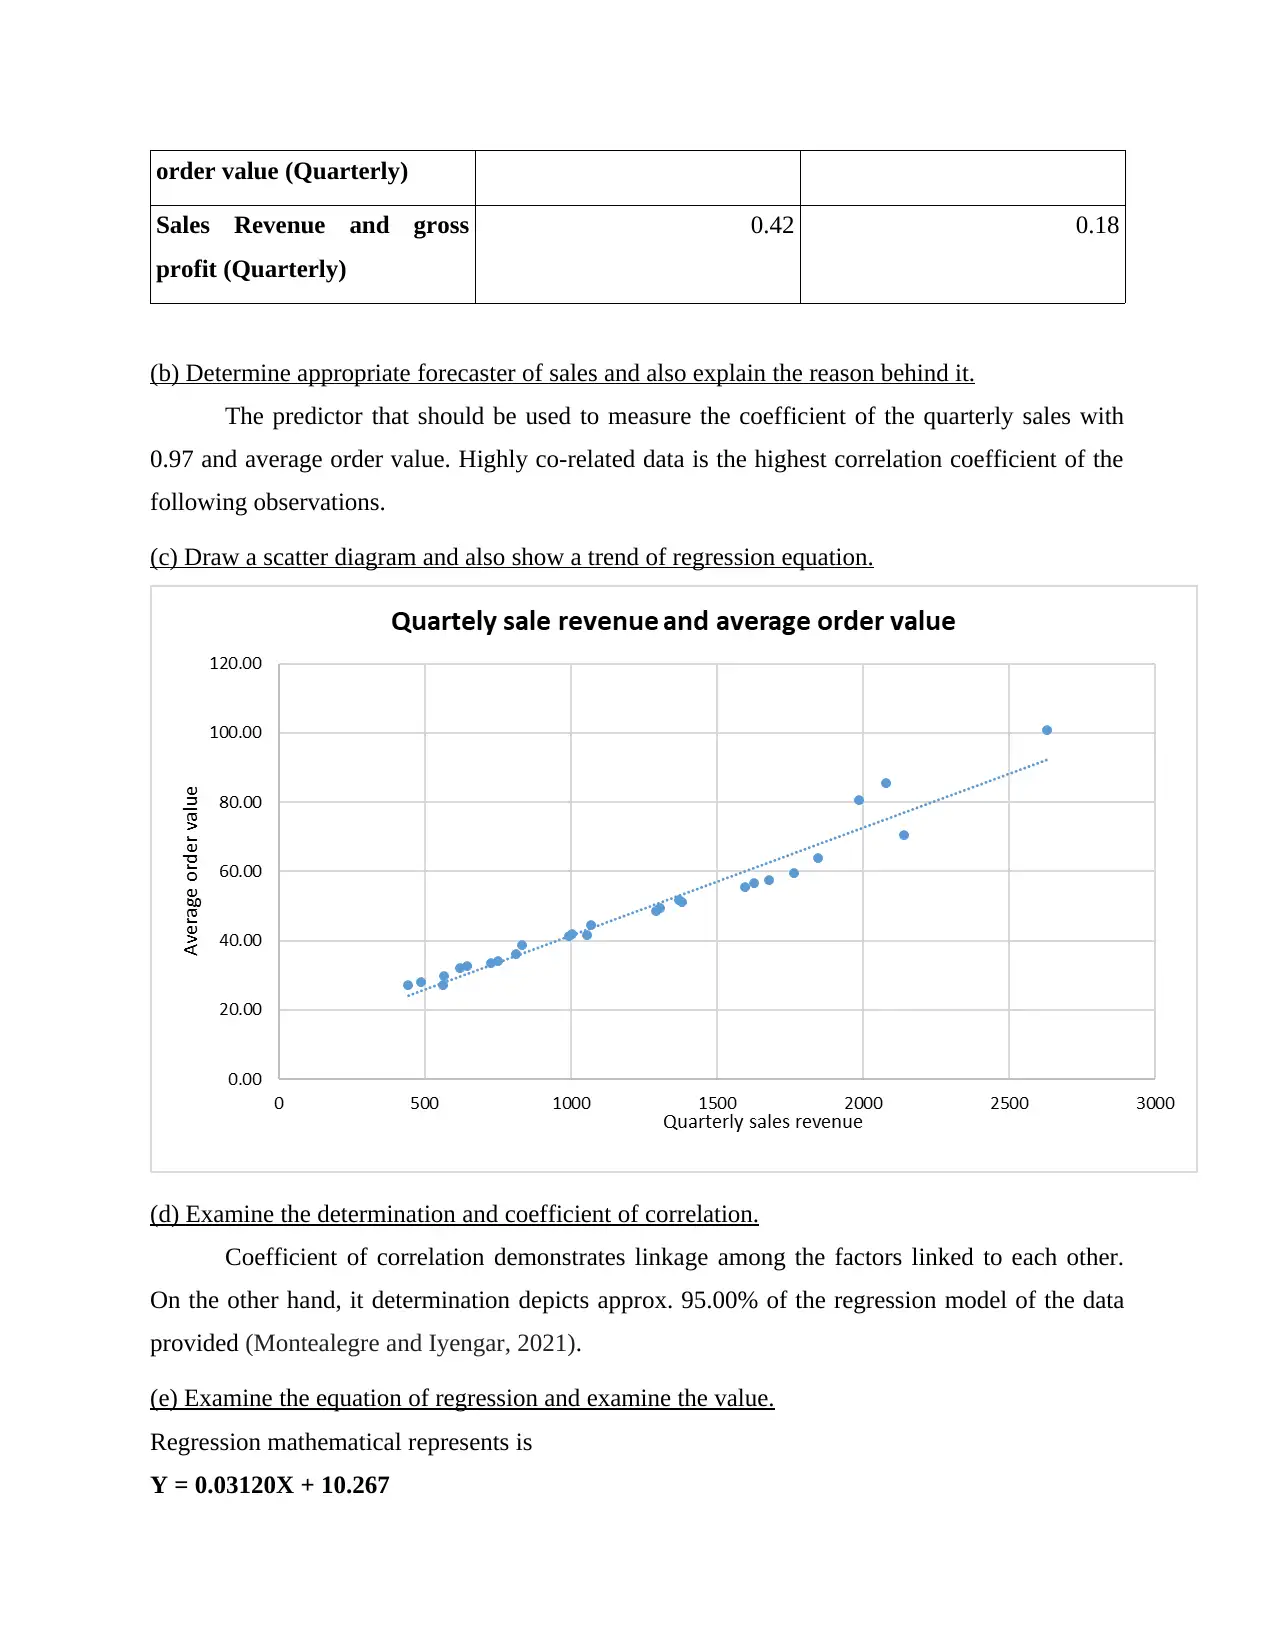
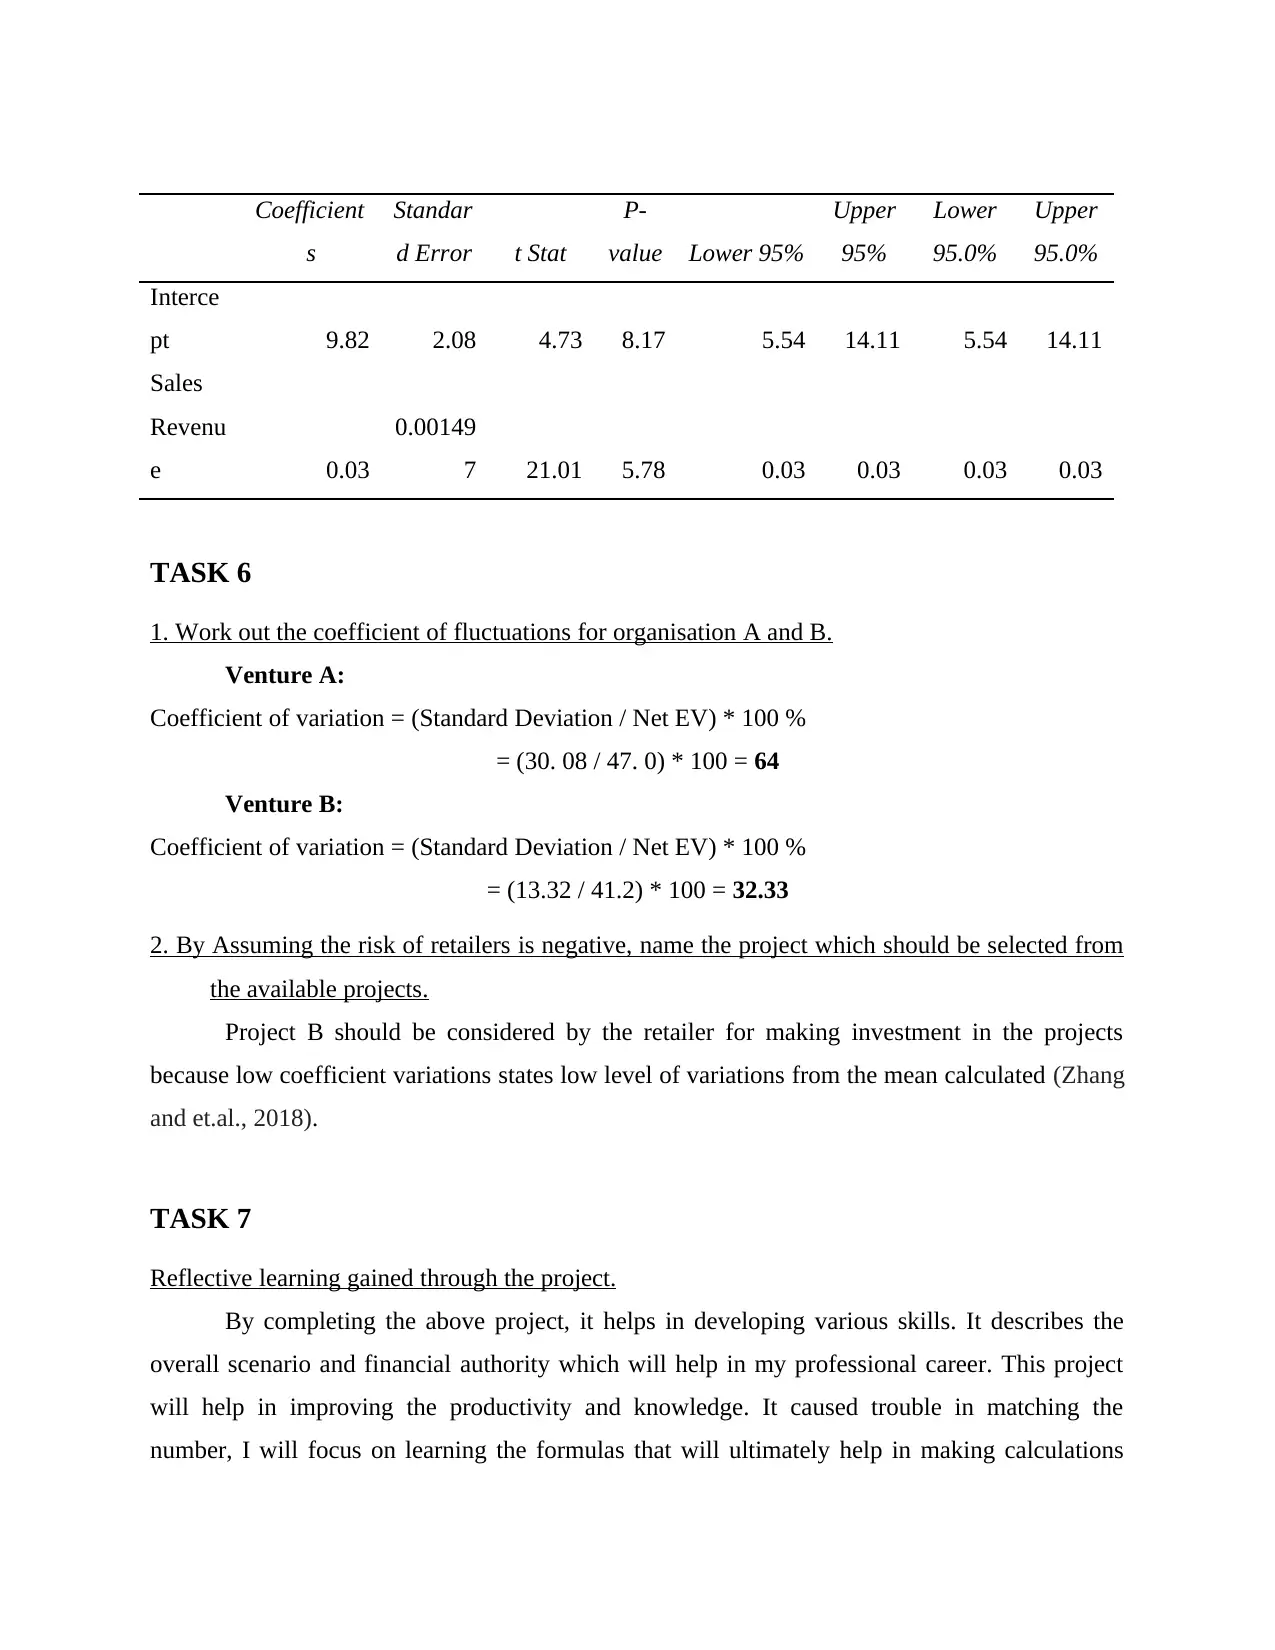
This report provides a comprehensive analysis of data using various statistical methods. It includes computations of mean, standard deviation, variance, and correlation coefficients. The report differentiates between time series and cross-sectional data, constructs a network diagram for project management, and identifies the critical path. Furthermore, it examines regression equations, coefficients of determination, and performs break-even analysis. The analysis includes a reflective learning section, detailing the skills gained and areas for improvement. The high-low method is used to compute variable costs and fixed costs, and the margin of safety is calculated. The report concludes with an analysis of the computations, providing insights into sales targets and break-even points.


1 out of 15
Related Documents


Your All-in-One AI-Powered Toolkit for Academic Success.
+13062052269
info@desklib.com
Available 24*7 on WhatsApp / Email
![[object Object]](/_next/static/media/star-bottom.7253800d.svg)
Copyright © 2020–2026 A2Z Services. All Rights Reserved. Developed and managed by ZUCOL.