Detailed Analysis of Uniform and Normal Probability Distribution

Verified

Added on  2023/06/18

|6
|627
|143
Homework Assignment
AI Summary
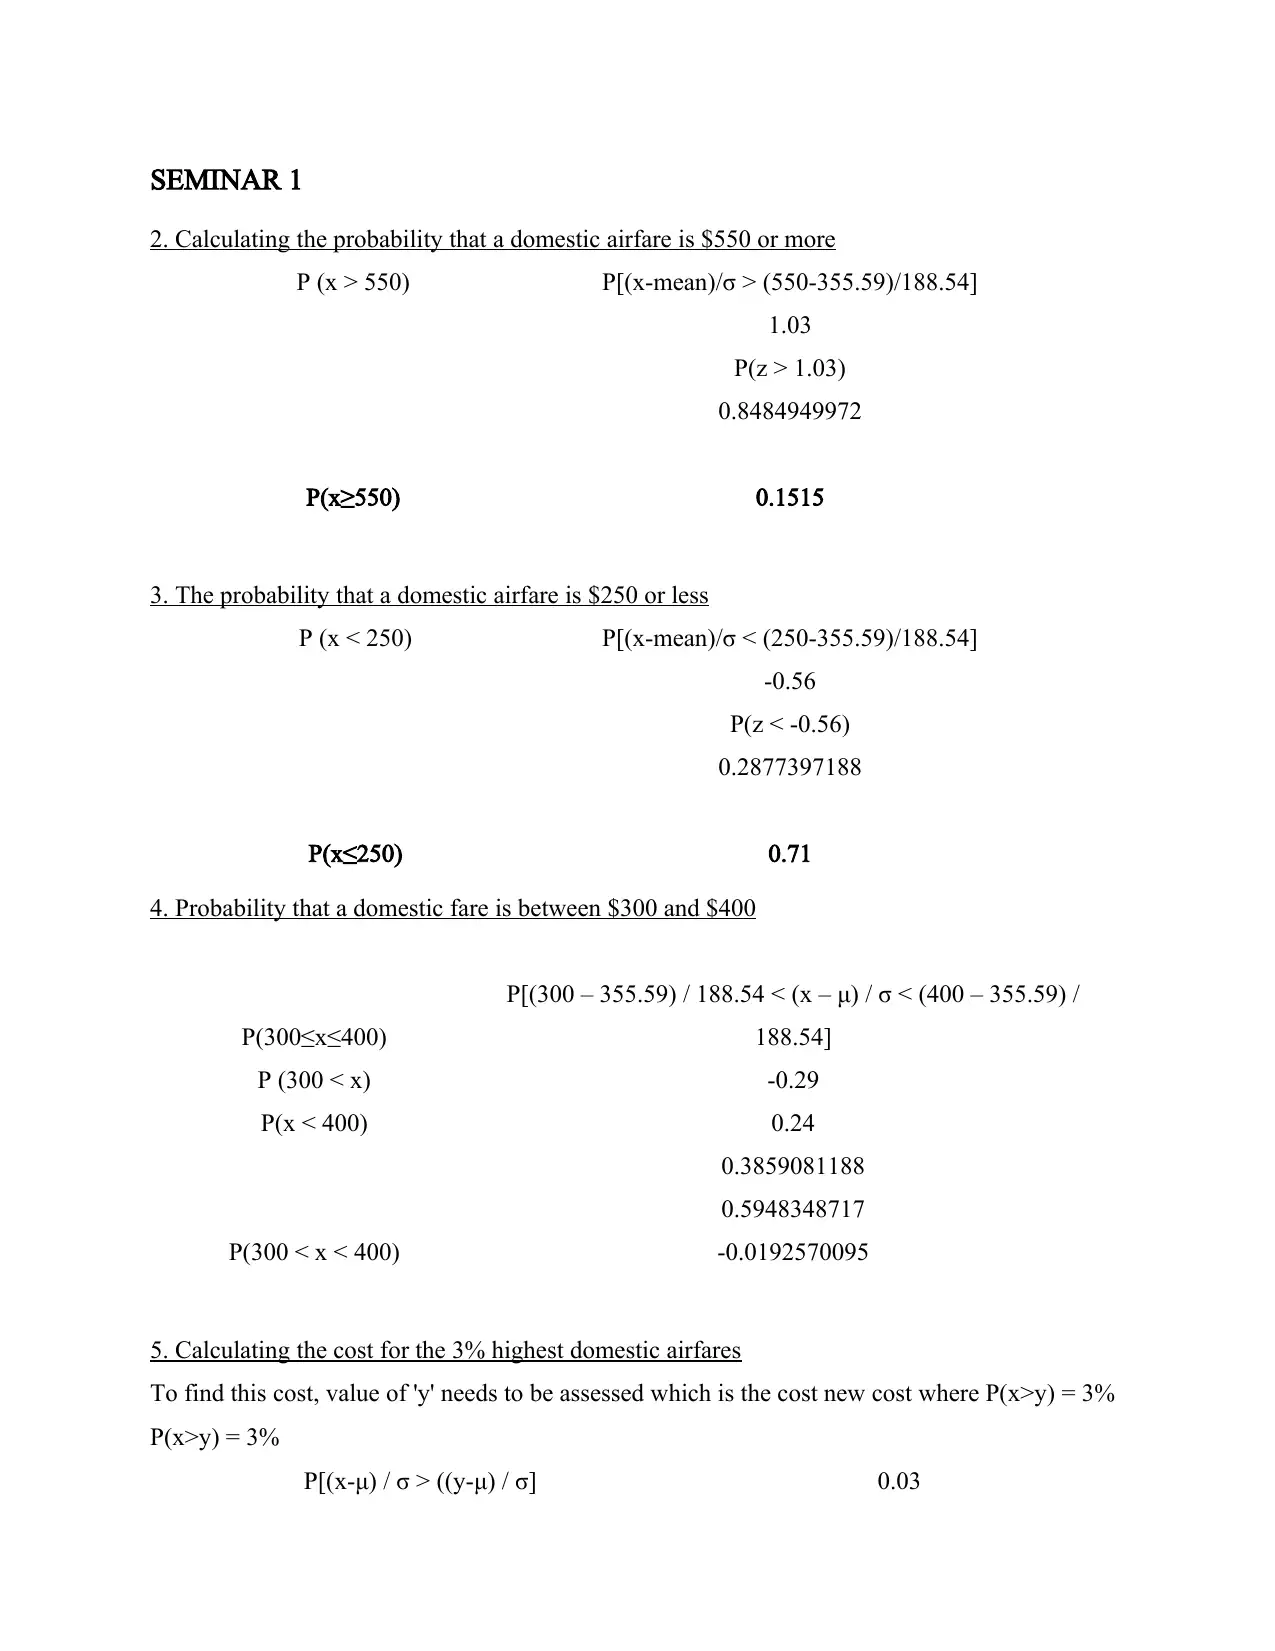
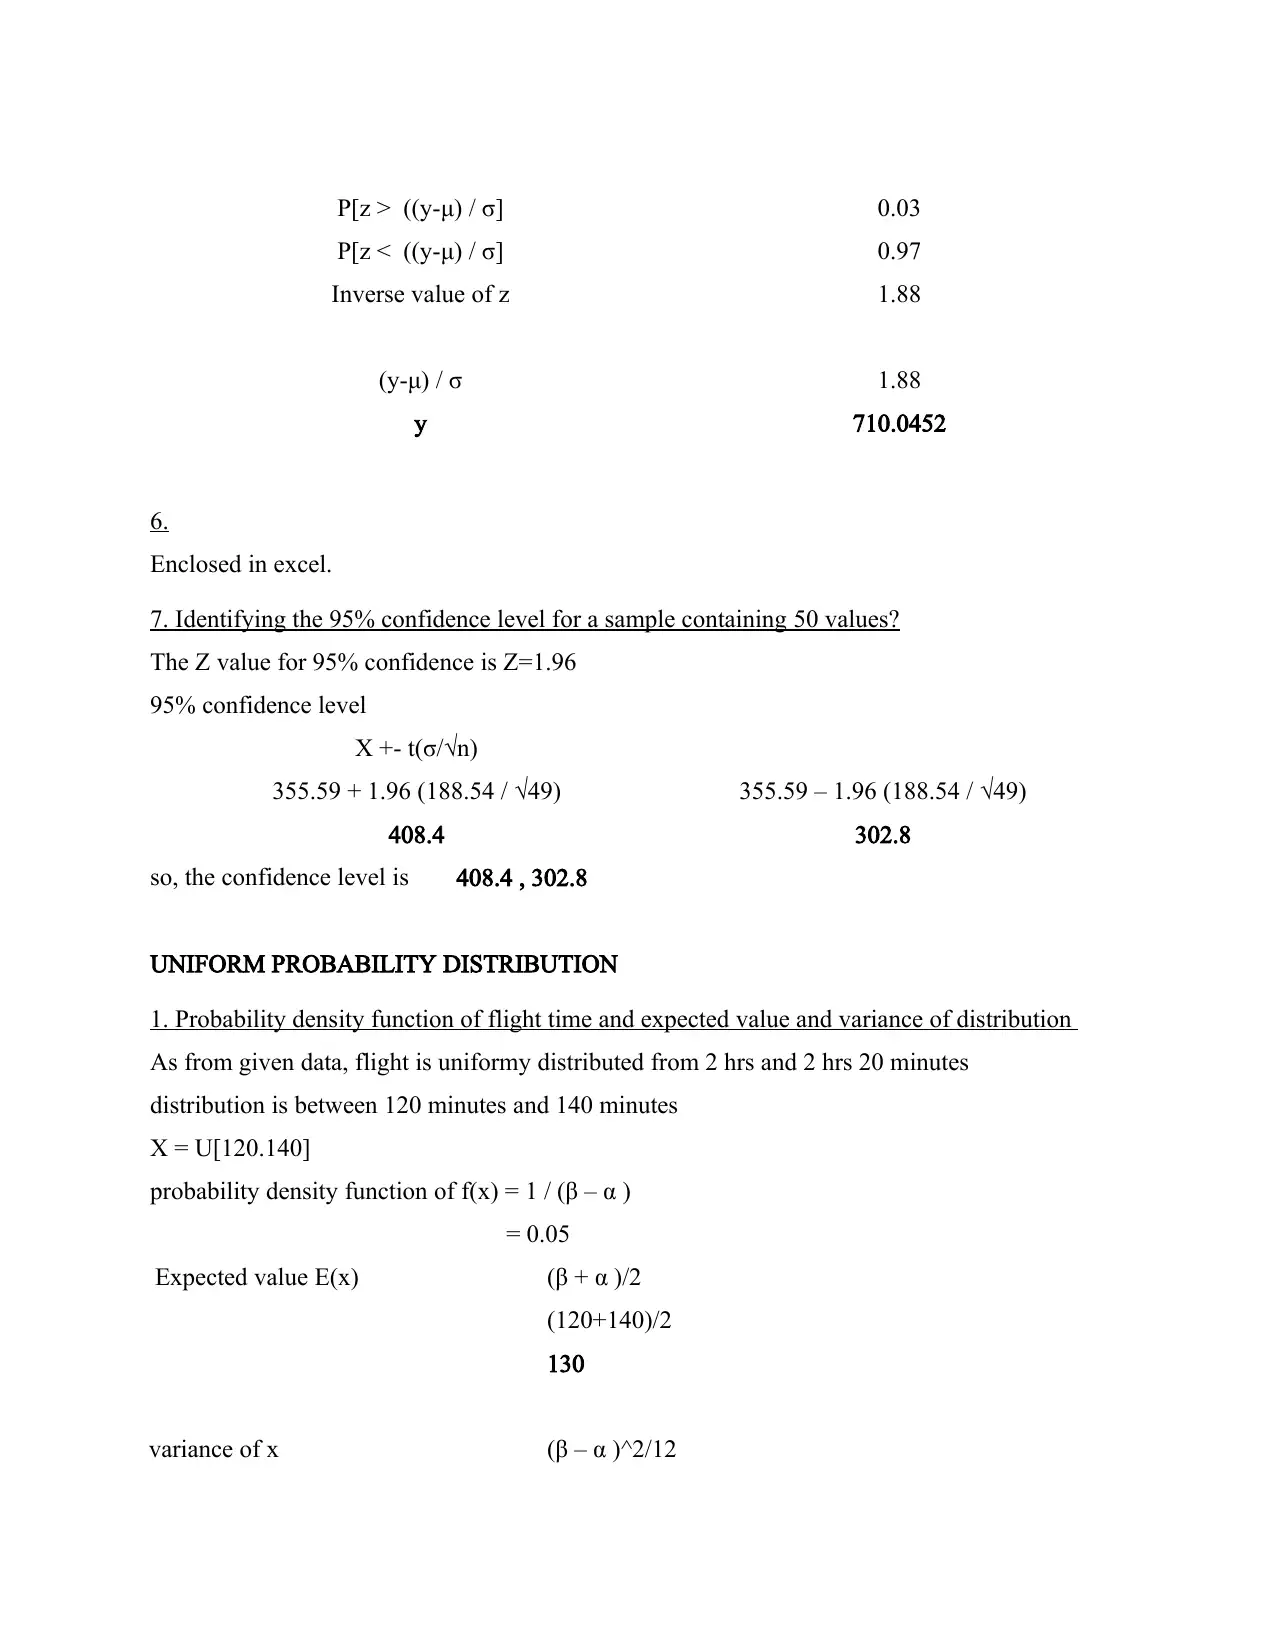
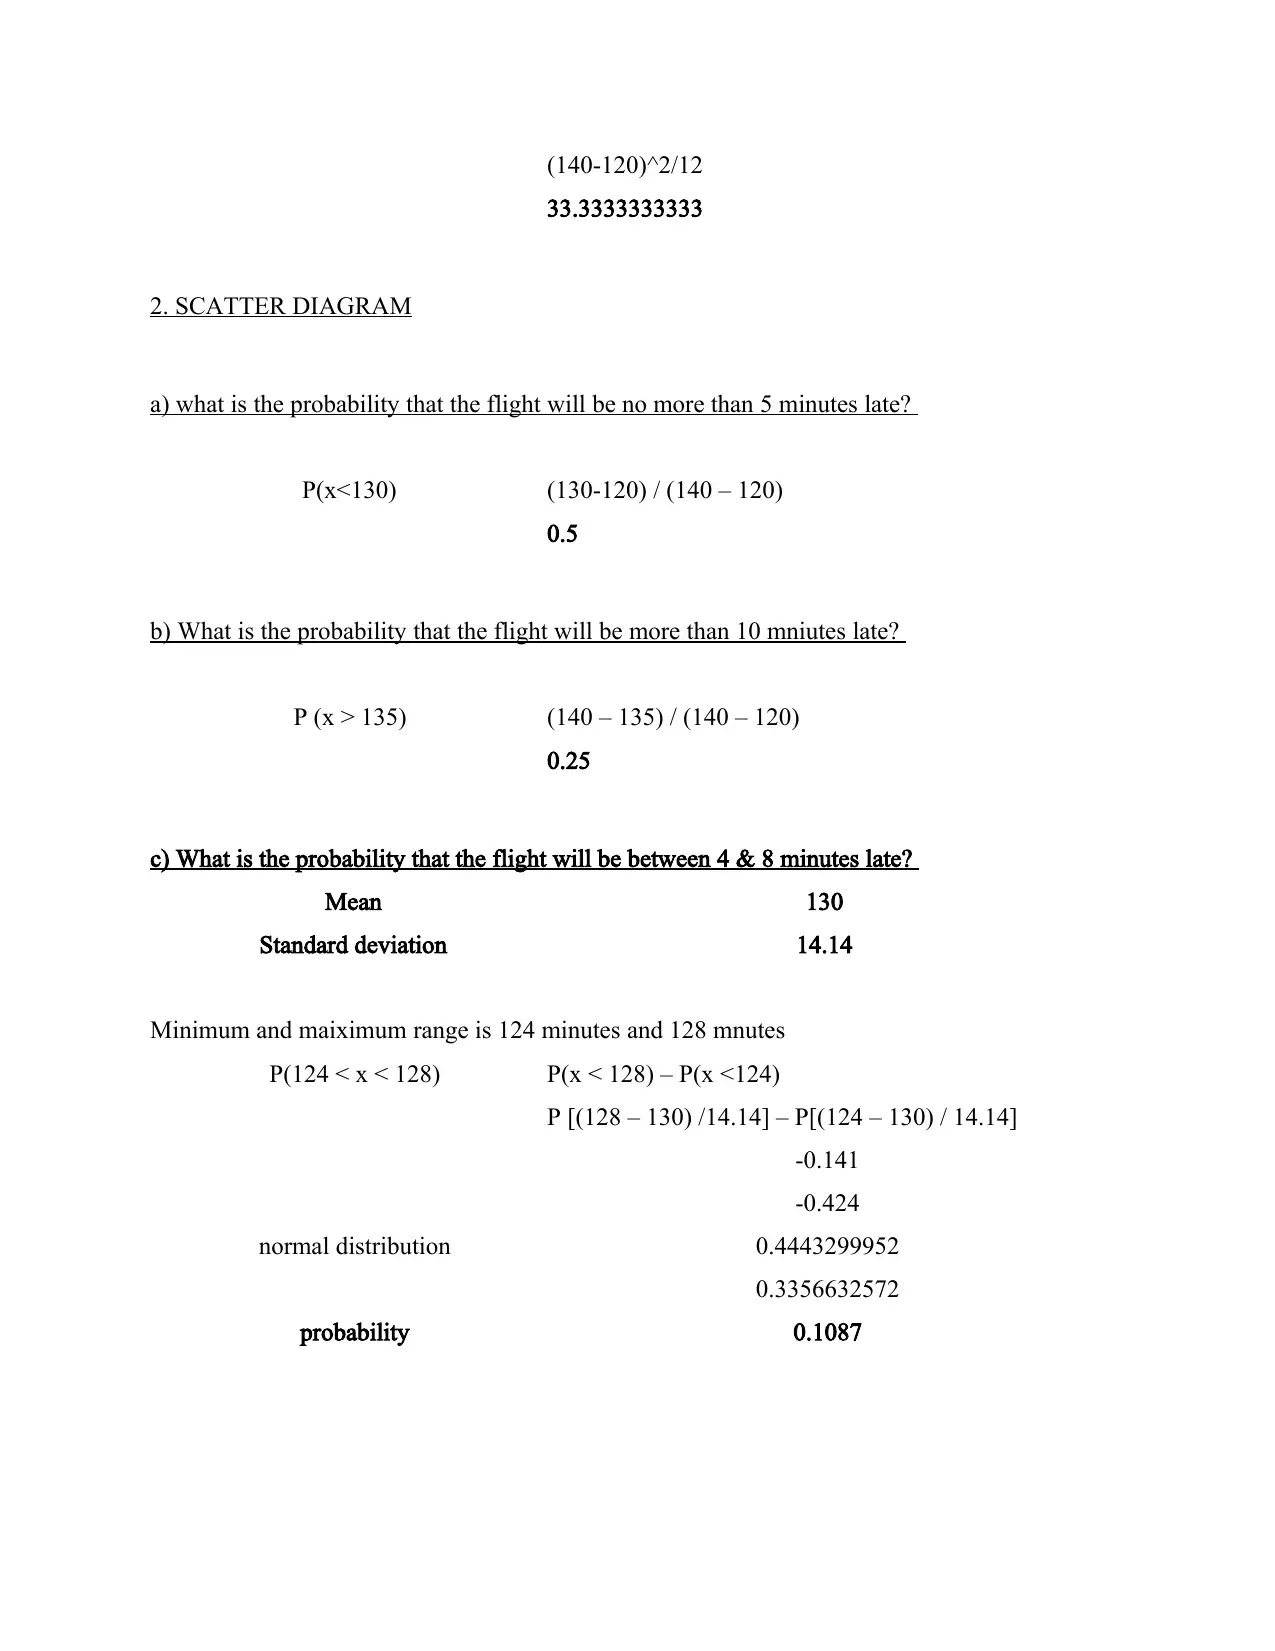
This assignment solution delves into the concepts of uniform and normal probability distributions, providing detailed calculations and explanations. It covers various aspects, including calculating probabilities for domestic airfares using normal distribution, determining costs for the highest airfares, and identifying confidence levels. Furthermore, it explores the probability density function of flight times using uniform distribution, calculates probabilities related to flight delays, and includes scatter diagram analysis. The solutions are supported by relevant formulas and references, offering a comprehensive understanding of these statistical concepts. Desklib provides more solved assignments and past papers for students.
Document Page
Uniform and Normal
Probability Distribution
tabler-icon-diamond-filled.svg

Paraphrase This Document

Need a fresh take? Get an instant paraphrase of this document with our AI Paraphraser
Document Page
TABLE OF CONTENTS
REFERENCES................................................................................................................................6
Document Page
SEMINAR 1
2. Calculating the probability that a domestic airfare is $550 or more
P (x > 550) P[(x-mean)/σ > (550-355.59)/188.54]
1.03
P(z > 1.03)
0.8484949972
P(x≥550) 0.1515
3. The probability that a domestic airfare is $250 or less
P (x < 250) P[(x-mean)/σ < (250-355.59)/188.54]
-0.56
P(z < -0.56)
0.2877397188
P(x≤250) 0.71
4. Probability that a domestic fare is between $300 and $400
P(300≤x≤400)
P[(300 – 355.59) / 188.54 < (x – μ) / σ < (400 – 355.59) /
188.54]
P (300 < x) -0.29
P(x < 400) 0.24
0.3859081188
0.5948348717
P(300 < x < 400) -0.0192570095
5. Calculating the cost for the 3% highest domestic airfares
To find this cost, value of 'y' needs to be assessed which is the cost new cost where P(x>y) = 3%
P(x>y) = 3%
P[(x-μ) / σ > ((y-μ) / σ] 0.03
Document Page
P[z > ((y-μ) / σ] 0.03
P[z < ((y-μ) / σ] 0.97
Inverse value of z 1.88
(y-μ) / σ 1.88
y 710.0452
6.
Enclosed in excel.
7. Identifying the 95% confidence level for a sample containing 50 values?
The Z value for 95% confidence is Z=1.96
95% confidence level
X +- t(σ/√n)
355.59 + 1.96 (188.54 / √49) 355.59 – 1.96 (188.54 / √49)
408.4 302.8
so, the confidence level is 408.4 , 302.8
UNIFORM PROBABILITY DISTRIBUTION
1. Probability density function of flight time and expected value and variance of distribution
As from given data, flight is uniformy distributed from 2 hrs and 2 hrs 20 minutes
distribution is between 120 minutes and 140 minutes
X = U[120.140]
probability density function of f(x) = 1 / (β – α )
= 0.05
Expected value E(x) (β + α )/2
(120+140)/2
130
variance of x (β – α )^2/12
tabler-icon-diamond-filled.svg

Paraphrase This Document

Need a fresh take? Get an instant paraphrase of this document with our AI Paraphraser
Document Page
(140-120)^2/12
33.3333333333
2. SCATTER DIAGRAM
a) what is the probability that the flight will be no more than 5 minutes late?
P(x<130) (130-120) / (140 – 120)
0.5
b) What is the probability that the flight will be more than 10 mniutes late?
P (x > 135) (140 – 135) / (140 – 120)
0.25
c) What is the probability that the flight will be between 4 & 8 minutes late?
Mean 130
Standard deviation 14.14
Minimum and maiximum range is 124 minutes and 128 mnutes
P(124 < x < 128) P(x < 128) – P(x <124)
P [(128 – 130) /14.14] – P[(124 – 130) / 14.14]
-0.141
-0.424
normal distribution 0.4443299952
0.3356632572
probability 0.1087
Document Page
REFERENCES
Books and Journals
Online
[Online]. Available through: <>
[Online]. Available through: <>
[Online]. Available through: <>
chevron_up_icon
1 out of 6
circle_padding
hide_on_mobile
zoom_out_icon